

")


Patient dose monitoring software in radiology
- Авторлар: Shatenok M.P.1, Ryzhov S.A.1,2, Lantukh Z.A.1, Druzhinina Y.V.1,3, Tolkachev K.V.1
-
Мекемелер:
- Research and Practical Clinical Center for Diagnostics and Telemedicine Technologies
- Dmitry Rogachev National Medical Research Center of Pediatric Hematology, Oncology and Immunology
- Russian Medical Academy of Continuous Professional Education
- Шығарылым: Том 3, № 3 (2022)
- Беттер: 212-230
- Бөлім: Reviews
- ##submission.dateSubmitted##: 12.04.2022
- ##submission.dateAccepted##: 25.07.2022
- ##submission.datePublished##: 17.10.2022
- URL: https://jdigitaldiagnostics.com/DD/article/view/106083
- DOI: https://doi.org/10.17816/DD106083
- ID: 106083

Дәйексөз келтіру

Аннотация
An increase in the number of diagnostic procedures using ionizing radiation (computed tomography, interventional procedures, and the use of nuclear medicine) results in an increase in radiation exposure and, consequently, an increase in collective and individual doses of radiation to patients.
Diagnostic studies from the international professional community are extensively focusing on issues such as management and dose optimization. Worldwide practice can resolve these issues using software for monitoring patient doses to automatically collect, analyze, and account for patient doses in various types of diagnostic studies. The software allows to obtain data on the doses of patients from X-ray procedures and detailed information about studies, track the total accumulated dose of the patient, and maintain statistics on the device, X-ray laboratory, and the medical organization. It also helps analyze the collected dosimetric data, deduce the causal relationship between dose indications and diagnostic procedure conditions, and monitor the effectiveness of the equipment.
The basic capabilities of patient dose monitoring software (DMS) available on the global market were investigated. The major technical requirements for the software functional needed in practical work were defined.
Modern DMS have a wide range of possibilities for automated collection, storage, and management of patient radiation exposure data in radiology departments. DMS increase the quality of healthcare services, provide patient safety, and optimize the workflow of medical organizations.
Негізгі сөздер
Толық мәтін
LIST OF ACRONYMS AND ABBREVIATIONS
CT ― computed tomography
MD software ― software for monitoring patient doses
RDL ― reference diagnostic levels
AGD ― average glandular dose
CTDIvol (Volume CT Dose Index) ― absorbed radiation dose in a phantom during CT examination
DAP ― dose area product
DLP (dose length product) ― product of dose and length; absorbed dose for all CT examinations, taking into account the length of the scan area
SSDE (size-specific dose estimate) ― radiation exposure on the patient, taking into account its geometric dimensions.
BACKGROUND
Over the past decades, there has been an increase in the number of diagnostic procedures using ionizing radiation, which is primarily associated with an increase in the number of high-dose studies, such as computed tomography (CT), interventional procedures, and the use of nuclear medicine [1]. This increases the share of these methods in the structure of radiation dose and, as a result, an increase in the collective and individual doses of radiation exposure of patients.
It is noteworthy that the trends in the Russian Federation generally correspond to the global ones. According to form No. 3-DOZ1, the collective dose in Moscow increased from 10,946 man-Sv in 2017 to 16,662 man-Sv in 2020, which is directly related to the increase in the share of CT examinations (from 5.5% in 2017 to 13.1% in 2020). The specific contribution to the collective dose from CT studies reached 75.9% in 2020, according to the reporting form No. 3-DOZ [2, 3]. It is highly possible that this trend will continue in the coming years.
The scientific community is particularly concerned with cases of unjustified multiple studies conducted on the same patient, as well as the facts of single studies with doses of more than 100 mSv [4]. According to some scientists, only two or three CT procedures, especially in children, can significantly increase the risk of malignant neoplasms [5].
In this context, according to a number of publications by W. Bogdanich in The New York Times2, cases of visible skin lesions caused by errors in brain perfusion CT in the USA should attract close attention, and their investigation and identification of causes should gain the widest publicity in the professional community. In Western countries, such cases served as a powerful impetus for the creation of new requirements in the field of radiation safety, particularly the mandatory use of special software for accounting for patient radiation doses. Unfortunately, cases of deterministic effects do not have a broad resonance in Russia, and their description in scientific Russian-language sources is typically associated with the peculiarities of surgical treatment of patients [6–8]. In this regard, the requirements of regulatory documents on radiation safety currently do not reflect the need to record patient doses using software in the workflows of the radiology departments, but use the capabilities of software products only for the statistical collection of information from various healthcare organizations3.
At the same time, it is challenging to conduct proper monitoring of radiation safety due to the manual collection of information used in Russia for reporting on the patient’s radiation dose and the use of paper logs in the radiology unit make. Lack of automation increases the complexity of the process and entails possible errors due to the human factor.
The management and optimization of the dose from diagnostic studies are major concerns in the international professional community. In accordance with the European Directive 2013/59/Euratom [9], it is recommended to monitor and control the radiation dose of patients from diagnostic procedures “much more accurately than before”, as well as to follow the basic principle of modern radiation protection as low as reasonably achievable when justifying and optimizing diagnostic radiation exposure.
The use of patient dose monitoring software (MD software) for the automated collection, analysis, and accounting of patient doses throughout various types of diagnostic studies (CT, radiography/fluoroscopy, mammography, angiography, etc.) is the standard practice used worldwide for solving this problem.
The MD software makes it possible to track the total accumulated dose of the patient, collect statistics on the device, X-ray laboratory assistant, healthcare organization, as well as analyze the collected dosimetric data, derive a causal relationship between dose readings and conditions of research, and monitor the efficiency of the equipment. It also enables to obtain data on patient doses from X-ray radiological procedures, as well as detailed information about studies.
R.W. Loose et al. [10] identified the following tasks of radiation safety in healthcare organizations, which solution is facilitated by the use of MD software:
- collection of dosimetric data to establish local and national reference diagnostic levels (RDLs) or typical dose values;
- verification of compliance of average doses from studies with established RDLs;
- prevention, detection, and reporting in case of unintentional exposure;
- optimization of radiation exposure of patients, especially in the field of CT and interventional procedures;
- structured consolidation of patient exposure documentation, as well as reporting, and tracking;
- notifications about exceeding the established local or national levels;
- local, regional, or national benchmarking of radiation exposure of patients for various modalities and procedures.
The need to assess organ doses and lifetime attributable risks can also be included on this list.
It should be noted that the use of MD software requires collaboration between general practitioners and specialists, such as medical physicists, X-ray laboratory assistant, radiologists, roentgenologists, who are involved in the diagnostic process. However, it is considered that the main responsibility for the use of the MD software rests with a qualified medical physicist who should supervise the initial installation and configuration of the system, verify the correctness of data transfer, and calculate the main dose parameters.
STAGES OF WORKING WITH THE SOFTWARE
This work aimed to investigate the main potentialities of the MD software available on the global market and to determine the key technical requirements for the software functionality. The initial stage of the study involved a review of the literature on the subject in the English and Russian languages versions of PubMed, Google Scholar, and eLibrary databases. The search was conducted using the terms “dose monitoring system”, “patient dose in radiology”, “dose tracking software”, “patient radiation dose during X-ray diagnostics”, and “patient dose monitoring”.
A list of patient’s MD software was compiled for research and testing of the main potentialities based on the results of the analysis of Russian and international literature sources:
- DoseWatch (GE);
- TQM-Dose (Qaelum);
- Radimetrics (Bayer)4;
- DoseWise Portal v3.0 (Philips);
- Teamplay (Siemens Healthineers);
- DoseTrack (Sectra).
Work with MD software was arranged according to the following scheme:
- Acquaintance and establishing contact with the manufacturer of MD software.
- Presentation of the product by the manufacturer.
- Obtaining access to the demo version of the MD software.
- Loading the test data set into the MD software. The data set contained information on the X-ray examinations performed from 15 X-ray CT scans. For the data set formation, the most common types of CT examination procedures for patients were selected. Complete and irreversible anonymization of studies in the Unified Radiological Information Service5 was performed. In total, 3,102 studies on 20 types of procedures were included in the data set.
- Approbation and testing of MD software in a closed loop. The testing period was at least 1 month for the possibility of a complete assessment of all technical parameters of the software.
Due to the different level of access to the MD software provided by the manufacturers, the procedure for examining each system had its own characteristics. For some MD software, due to technical reasons, testing was performed using the manufacturer’s test data set.
These works were conducted during the year, starting from June 2019.
CONNECTING THE DOSE MONITORING SOFTWARE
The patient’s MD software has a multimodal structure with the ability to connect equipment from different manufacturers. These systems also offer the possibility to connect nonionizing equipment to control the efficiency of personnel work and make management decisions.
Due to the availability of data on dose indices in the DICOM protocol (CTDIvol, DLP, DAP, AGD, SSDE, etc.), studies using the digital method of X-ray diagnostics (X-ray diagnostics, mammography, angiography, CT, etc.) are well systematized and can be used to control radiation exposure of the patient. Dose information can be retrieved from DICOM in three ways:
- recording of dose information in specialized tags available from individual manufacturers;
- reading the information stored in the Dose report of the study, using the Optical character recognition method (OCR);
- use of a DICOM file, a structured report containing information on registration of the patient’s calculated radiation dose (radiation dose structure report [RDSR]).
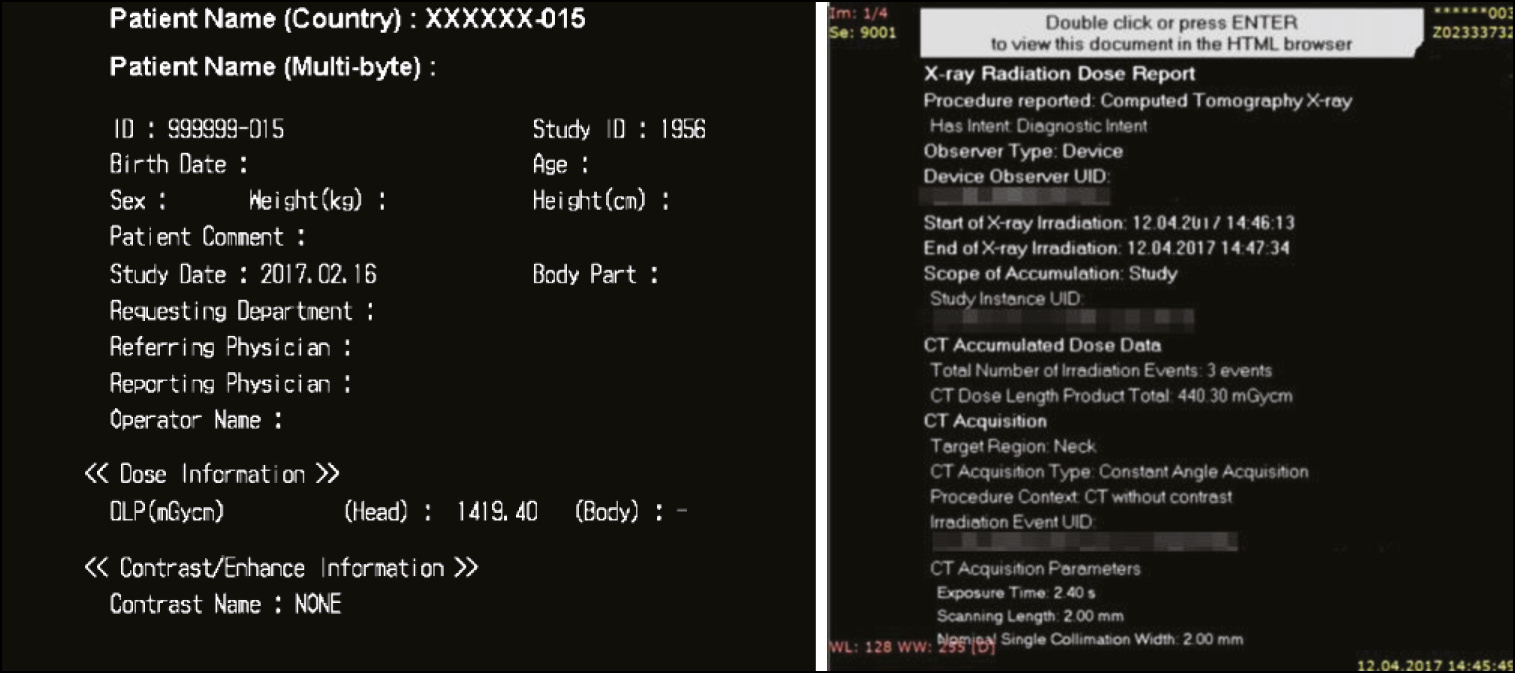
The RDSR is a file of a hierarchical structure that contains information about the study conducted, such as general information about the study and information about each series of exposure and dose indicators (Fig. 1). This format enables to obtain the most complete information about the study and the patient, for example, anthropometric and demographic data that are necessary for calculating organ doses and other personalized dose indicators. Without the exact parameters of the study, which are transmitted in the RDSR format, it is impossible to calculation the peak dose to the skin. Unfortunately, this format is supported by equipment manufactured not earlier than 2013; in the study, the share of such equipment with RDSR was 7%.

Fig. 1. An example of Dose Report and RDSR.
Most MD software is installed on a server that is used to record, display, analyze, and transfer data to other related systems. The server could be physical, virtual, or even a cloud solution.
The MD software can be connected directly to the CT workstation; however, the most common connection architecture is connection of the MD software to PACS. A typical connection, as well as the roles of responsible specialists, is presented in Fig. 2.

Fig. 2. An example of a typical connection of software for monitoring patient doses.
Note. MIS, medical information system; RIS, radiological information system.
Configuring the data transfer from diagnostic devices is necessary after connecting the MD software to the information network of the HO/HO group. Study information from the DICOM format must be recorded in the correct fields of the MD software. Each MD software has peculiarities in setting up data export. When configuring, the correctness of displaying the dimensions of quantities, the calculation algorithm, and the accuracy of determining dose indicators are all checked. A particularly labor-intensive task is the standardization of the names of study protocols and the assignment of studies into groups for the installation of RDL and further comparison with national and international data.
KEY OPPORTUNITIES OF PATIENT DOSE MONITORING SOFTWARE
Because of the work, the key opportunities of the MD software were identified and described, taking into account the practical benefits of X-ray diagnostic procedures.
The MD software supports various modalities, namely, CT, interventional radiology, radiography and fluoroscopy, mammography, positron emission tomography (PET), PET/CT, single photon emission CT (SPECT), and SPECT/CT, depending on the manufacturer and configuration.
Statistics
The MD software represents a database of diagnostic study parameters with various tools for analysis and statistical processing. In various MD software, these opportunities are implemented with peculiarities; however, the main ones can be distinguished:
- the presence of filters by date, type of study, modality, device, protocol, radiation dose, scanning area, healthcare organization, demographic and anthropometric data of the patient, full name (surname, name, patronymic) of the X-ray laboratory assistant, and others;
- the ability to view the list of studies in tabular form (Fig 3). For each study, a list of key parameters is displayed, namely, the study and protocol code, dose values (CTDIvol, DLP, SSDE, DAP, etc.), fluoroscopy time, demographic and anthropometric data of the patient, name of the medical institution, device model, full name of the doctor and operator, and others;
- color indication of studies for which warning alerts were generated, depending on their status;
- possibility to customize the dashboard and apply different types of graphs and charts to visualize the filtered data. Typically, MD software suggests using standard charts or creating new ones as necessary.

Fig. 3. Tabular view of data presentation, DoseTrack, Sectra.
The statistical processing tools enable to calculate the maximum, minimum, mean, and median values, as well as determine quantiles, standard deviations, and construct trends. For example, it is possible to plot the histogram of distribution of studies by effective dose for a selected protocol and compare the dose from a particular study with doses from other studies in the same protocol. The diagram presents the established RDL levels for the considered CT protocol (Fig. 4). Real-time dashboard monitoring enables to identify possible deviations in the operation of equipment and personnel. It is also possible to perform a statistical analysis of dose distributions for a specific type of study, for example, by the DLP parameter (Fig. 5). Some MD software has a module for monitoring the study time, including the preparation stage, the study itself, and the waiting period between studies (Fig. 6). The tool can be useful for both controlling the duration of studies and following the recommendations on the use of equipment.

Fig. 4. Diagnosis reference level diagram for patient dose monitoring software, Radimetrics, Bayer.

Fig. 5. Statistical analysis of dose distributions by DLP parameter, Teamplay, Siemens Healthineers.

Fig. 6. Histogram for the parameter “interval between patients in minutes,” Teamplay, Siemens Healthineers.
Patient card
The patient card comprises information about the patient, including ID (unique individual number), full name, gender, age, weight, height, and body mass index (BMI). This section also contains the information about the studies that the patient underwent and that were loaded into the system. Information about the patient’s dose from the X-ray examination is usually presented in both graphical and tabular form. The total cumulative patient dose from all studies is displayed. The excess of the established dose levels, both for each study individually and for the total accumulated dose, is usually shown by a color-coded indication.
Alarm alerts
The automatic alarm notifications in the MD software enable to identify cases of exceeding the established permissible levels for radiation dose quickly. In most systems, the setting of special “triggers” is implemented, according to which alerts are automatically generated and sent by e-mail to the responsible medical physicist or other users of the system (Fig. 7). For instance, the study parameters that act as triggers can be CTDIvol, DLP, DAP, ESD, SSDE, AGD, breast compression thickness, and mAs. For each of these parameters, the corresponding allowable levels are set.

Fig. 7. Formation of alarm alerts by levels of DLP values, DoseWise Portal, Philips.
Depending on the established permissible levels, there is usually a color-coded indication of the studies and their dose parameters according to the “traffic light” type; in Fig. 8, exceeded dose levels are indicated in red. Some MD software provides the ability to set allowable levels for the total accumulated dose from all studies that have been performed on the patient and that are loaded into the system. These capabilities in the MD software enable to track quickly the information about the dose both at the study level and at the patient level (Fig. 9).

Fig. 8. Color indication of CT parameters, Radimetrics, Bayer.

Fig. 9. Patient dose history, DoseWise Portal, Philips.
Effective dose calculation
The dose parameters of studies depending on the modality, obtained from DICOM (DLP, DAP, MGD, activity, etc.) are used to calculate the effective dose in the MD software. Most software uses the standard conversion factors published in recommendations 606 and 1037 of The International Commission on Radiological Protection (ICRP). The ability to alter dose coefficients and input own values is a significant advantage of the MD software since, for instance, in the Russian Federation, the values of the coefficients approved in MU 2.6.1.3584-198 differ from international ones.
Reference diagnostic levels
To study the RDL, the MD software has various functionalities that enable to set external RDLs and calculate RDLs based on the entered data. It is possible to compare further the organization’s local dose levels with national or international RDLs.
Most MD software enables to work with RDL for various modalities and types of procedures, including interventional diagnostics and fluoroscopy. RDLs are calculated in the MD software in recommended dose units depending on the modality [11, 12]. The advantages of some systems include the ability to calculate RDL for a certain group of patients, considering their demographic and anthropometric data, for example, pediatric RDL and RDL for obese patients (Fig. 10).

Fig. 10. Setting local reference diagnostic levels, DoseTrack, Sectra.
Compared with manual work, the use of automated MD software greatly simplifies and speeds up the process of installing the RDL, increases the accuracy and reliability of the results, and enables to implement this process on a periodic basis.
Implementation of the MD software enables to use the RDL as a tool for optimizing the radiation dose of patients in the daily work of a healthcare organization.
Reports
One of the key opportunities of MD software is the formation of reports on the loaded data. Typically, the reports include data on the radiation dose from studies performed over a certain period, data on loading of diagnostic devices, statistics on the types of studies, protocols used, scanning areas, and so forth. The reports include information on high-dose studies as well as those for which the set RDLs have been exceeded and warning alerts have been generated. Using this information, a point analysis of the studies conducted can be performed, elucidating the reasons for possible excesses.
The MD software offers users the option to set up their own reports with the necessary parameters or to use existing standard report templates, such as DoseWatch software, monthly radiation dose reports depending on the study area/study protocol. Most often, a report can be generated automatically based on existing dashboards and set up an e-mail distribution to specialists according to a set schedule. In addition, the use of sorting and filters by modality, time interval, institutions, study protocol, age of patients, CTDI and DLP values, and others are possible (Fig. 11). For example, the DoseWatch software reporting provides visualization of the 10 highest-dose studies for the period and the top 10 patients with a high cumulative dose value indicated in the DLP (Fig. 12). Equipment workload includes distribution of workload of CT scanners, the number of studies performed on CT scanners, the use of radiation dose reduction technology, and the number of studies depending on the X-ray laboratory assistant and radiologist.

Fig. 11. Number of exams distributed by DLP ranges and by model of computed tomography scanners, total number of exams per scanner, DoseWatch, GE.

Fig. 12. Example of a table with ten maximum dose studies, DoseWatch, GE.
The presence of automated reports in the MD software enables to reduce the time and labor costs for preparing regular dose reports of a medical institution, abandon paper forms, and improve the accuracy and quality of reporting data. It becomes possible to compare the parameters of diagnostic equipment, medical institutions, and personnel.
SSDE
Many commercial MD software implements the ability to calculate such a parameter as SSDE for CT. In contrast to the CTDIvol parameter, which is determined for a standard patient on phantoms with a diameter of 32 cm (body) or 16 cm (head), this parameter enables to estimate the radiation dose for the patient, taking into account his/her geometric dimensions. According to a publication by the American Association of Physicists in Medicine [13], SSDE is calculated from the patient’s effective diameter or water equivalent diameter. The necessary information for the calculation is usually taken from marking topograms or a set of axial images.
Patient centration
It is notable how important proper patient centering is during the diagnostic procedure in terms of radiation exposure. According to some studies, incorrect centering can lead to an increase in diagnostic dose up to 20% [14, 15]. A similar analysis of compliance with centering in the MD software is most often performed for CT examinations and in interventional radiology.
The MD software enables to calculate the patient’s displacement relative to the zero position and evaluate the quality of centration. The deviation is recorded along two axes (X and Y) on orthogonal images (Fig. 13). Correct centering is one of the criteria for assessing the quality of the work of X-ray laboratory assistants.

Fig. 13. Computed Tomography Patient Centering Assessment, DoseWatch, GE.
Peak dose to the skin
In case of an interventional procedure (fluoroscopy or angiography), the main dosimetric parameters are recorded in the MD software, namely, DAP, fluoroscopy time, and dose at the reference point.
In most systems, the radiation dose for the patient can be estimated using the following:
- spatial representation of the peak dose to the skin on the patient’s body surface (Fig 14);
- “timeline”, describing the characteristics of irradiation at each moment of time throughout the entire procedure (direction of irradiation; peak voltage, kVp; number of frames per second, dose characteristics);
- angular reamer of the dose map.

Fig. 14. Monitoring and optimization of peak skin dose in interventional procedures, Radimetrics, Bayer.
Radiation exposure monitoring using the aforementioned functionality enables to detect errors in the visualization technique and, in some cases, optimize the process (change the direction of irradiation, the number of frames per second, and apply the cine loop and freeze modes of images). The MD software also enables to identify patients who need to be monitored for the development of deterministic effects associated with high skin doses.
Organ doses
Given the high values of doses from CT compared with other methods of radiation diagnostics, the calculation of organ doses in most MD software is implemented for this modality.
Monte–Carlo simulation is used to calculate the patient’s organ doses, while the parameters of the CT scanner (energy spectrum, collimation, filtration, and tube current) are simulated. The radiation dose of the patient is determined taking into account the parameters of the scanning protocol, such as pitch, current, and voltage on the tube, collimation, and so forth. The assessment of organ doses is performed by selecting the appropriate patient phantom from the phantom library [16]. The phantom is automatically suggested taking into account the patient’s gender, age, and any possible pregnancy as well as its duration (Fig. 15). As part of the block for determining organ doses, manufacturers of MD software increasingly offer to calculate the dose to the fetus. The algorithm for calculating organ doses uses the coefficients given in ICRP 1039.
Some MD software implements an interactive dosimetry block that enables to simulate dose scenarios by changing manually the parameters of the scanning protocol. Although it is possible to compare doses for patients of different age, weight, and gender, the accuracy of this method remains questionable. For example, A. Iriuchijima et al. [17] compared organ doses from CT, determined by the Monte–Carlo method in the MD software, and measured in an anthropomorphic phantom using radiophotoluminescent dosimeters. The doses in the MD software had lower values, and the deviation was 13%. Thus, this assessment tool should be used, taking into account the existing limitations.
Currently, these methods are being actively improved, including the contouring of organs from images and the calculation of organ doses. An analysis of organ doses is necessary for a correct assessment of attributable radiation risks.
INTERNATIONAL EXPERIENCE IN IMPLEMENTATION OF SOFTWARE FOR PATIENT DOSE MONITORING
Different countries are currently actively using and implementing MD software. Several publications [10, 18, 19] substantiate the need to implement such software, provide the main technical requirements for MD software, as well as recommendations for implementation and use. The experience of using MD software is given, in particular, on the NICE website (briefing on innovations in the field of medical technologies)10, which analyzes 10 different studies conducted in different countries. Studies have been performed for various modalities, including CT, fluoroscopic procedures, X-ray, PET, and PET/CT. The main results include the following:
- the main reasons for incorrectly conducted studies were the high BMI of patients and incorrect centering during laying (CT);
- levels of patient doses from digital X-ray examinations have been significantly reduced after the introduction of the MD software, and a reduction in doses from CT was also achieved;
- significant discrepancies were revealed in dose levels on different devices in the same medical institution; discrepancies were also detected between healthcare organizations. After an appropriate investigation, it was revealed that the protocols were chosen incorrectly.
C. Heilmaier et al. [20] described the initial outcomes of the software implementation. The main reasons for the revealed excesses of the established dose levels were reported: high BMI (52%), incorrect centering (24%), rescanning (11%), and others. From the perspective of radiation safety of the patient, the value of data obtained using the MD software is emphasized. A British study [21] evaluated the first experience of using the MD software, and reported on the convenience and high speed of working with a large amount of data, as well as the impact of the selected dose identifier for data filtering on the quality of the results.
A lot of work on this subject was performed by the American College of Radiology and consisted of organizing a Dose Index Registry (DIR) for diagnostic procedures. The Registry was established in 2011 and is designed to collect and store dose information from studies. Information about studies, including such dose parameters as DLP, CTDIvol, and so forth, is automatically sent to the Registry with MD software from PACS or diagnostic devices, after depersonalization. More than 2,000 institutions are connected to the Registry, and information is collected on more than 50 million studies. For correct comparison of data, the names of the studies were preliminarily standardized in accordance with the RadLex dictionary. Each HO connected to DIR receives a report in the form of a schedule of dose distribution from all healthcare organizations regularly. The presence of such a dose registry enables to optimize effectively the doses of patients from X-ray diagnostic studies, identify cases of dose excesses and incorrect choice of protocol parameters, and increase the awareness of radiologists concerning the radiation dose. That is why the proposals for the implementation of MD software based on PACS, which combines data from several healthcare organizations within one X-ray diagnostics service, for example, the Moscow Department of Health, are especially interesting.
Modern MD software has a wide range of capabilities for automated collection, storage, and control of data on dose exposure of patients in radiology departments.
By using the MD software to monitor the patient’s radiation exposure, it enables to record the effective dose received during the study and the accumulated effective dose and dose indicators; to monitor the excess of dose indicators and the effective dose of the patient; to plan new studies taking into account the radiation exposure of the patient; to and apply RDL to optimize the radiation dose of the patient; to compare with the RDL and alarm on the excess; and to draw up reports of the department of radiation diagnostics on the radiation dose of the patient for submission to the regulatory authorities.
Speaking about the need to introduce MD software, it is important to consider the experience of international colleagues and the positive results of using the software presented in this article. The use of MD software enabled to identify and eliminate the main causes of exceeding dose levels during diagnostic procedures, to reduce patient radiation exposure for various modalities, and to optimize the work of personnel.
Certain limitations and difficulties associated with the implementation of MD software should also be noted. Unfortunately, outdated diagnostic equipment is unable to transmit all the necessary information about the patient and study parameters, which limits the use of MD software. Thus, for example, the absence of the RDSR format on CT, the lack of information about the dose in DICOM X-ray machines complicates the operation. Because of this, the implemented MD software should have functionality that enables to analyze the parameters of the current stock of diagnostic equipment, considering the possibility of expanding and updating it as part of the development of radiology departments for healthcare organizations. In addition, for the full-fledged operation of the MD software, it is necessary to standardize the names of research protocols and a laborious procedure of mapping (determining the correspondence of data between potentially different semantics of one object or different objects) of research. At the initial stage, the expected time and human expenditures for the installation and maintenance of the system should also be taken into account.
Within this work, the main capabilities of various MD software were studied, and the need for functionality for practical work was assessed. The full set of MD software parameters is presented in Table 1, which indicates both mandatory, according to the authors, and optional parameters.
Table 1. Main capabilities of the software for monitoring patient doses
No. | Parameter | Availability | |
1 | Available modalities | Computed tomography (CT), positron emission tomography (PET), PET/CT, single photon emission computed tomography (SPECT), SPECT/CT, mammography, radiography/fluoroscopy, angiography | Mandatory |
Ultrasound, magnetic resonance imaging, densitometry, contrast | Optional | ||
2 | Vendor-neutral compatibility | Mandatory | |
3 | Automatic patient dose tracking | Mandatory | |
4 | Reading the dose information. Available formats | RDSR, OCR | Mandatory |
MPPS, headers DICOM | Optional | ||
5 | Patient card | Mandatory | |
6 | Built-in anonymizer | Optional | |
7 | Presence of topograms in the study register | Mandatory | |
8 | Presence of analysis of topograms in terms of dose substantiation | Mandatory | |
9 | Calculation of effective dose per study | Mandatory | |
10 | Calculation of the total effective dose of the patient | Mandatory | |
11 | Availability of the effective dose statistics module | Optional | |
12 | Possibility to conFig. coefficients for effective dose calculation | Mandatory | |
13 | Calculation of SSDE for CT procedures (AAPM TG 204) | Mandatory | |
14 | Organ doses | Mandatory | |
15 | Skin dose calculation (peak skin dose) | Mandatory | |
16 | Presentation of radiation dose data in angiography as a time line | Optional | |
17 | Interactive exposure simulation module | Optional | |
18 | Fully customizable module for local reference levels and national reference levels | Mandatory | |
19 | Ability to customize dashboard | Optional | |
20 | Setting automatic e-mail notifications | Optional | |
21 | Tools for comparing studies and patient radiation dose | by equipment | Mandatory |
by healthcare organizations | Mandatory | ||
by tool groups | Optional | ||
by groups of healthcare organizations | Mandatory | ||
by localization | Optional | ||
by study field | Mandatory | ||
by study protocol | Mandatory | ||
22 | Tool for auditing the work of X-ray laboratory assistants | by number and duration of studies | Mandatory |
by quality of study | Mandatory | ||
by radiation dose of patients | Mandatory | ||
23 | Information about completed studies with the ability to filter by modality, location, and device | Mandatory | |
24 | Customizable automated reports with the required frequency | Mandatory | |
25 | Database export to Microsoft Excel (csv format) | Mandatory | |
26 | Patient radiation dose report | Mandatory | |
27 | Automated study acquisition from PACS | Mandatory | |
28 | Managing user functionality and data access rights | Mandatory | |
29 | LDAP integration into corporate user directory for user authentication | Optional | |
30 | Dose SR generation based on image header analysis (OCR) | Mandatory | |
31 | HL7 outgoing interface for exchanging dose information with other information systems | Mandatory | |
Thus, a set of key requirements for the MD software functionality has been formed:
- the ability to load studies of the modalities CT, interventional radiology, radiography and fluoroscopy, mammography, PET, PET/CT, SPECT, SPECT/CT;
- maintenance of the patient’s card;
- automatic calculation of effective doses;
- assessment of organ doses from CT procedures;
- calculation of the SSDE parameter for CT;
- installation and configuration of RDL;
- calculation of the dose to the skin during angiography;
- availability and the ability to conFig. automatic alarm notifications about exceeding the established allowable dose levels and other parameters;
- audit of work of X-ray laboratory assistants;
- analytics tools with advanced filters;
- automated scheduled reports;
- database export formats .сsv or .xlsx, .xls, or .pdf.
CONCLUSION
MD software enables to improve the quality of medical services provided, ensure patient safety, and optimize the work of a healthcare organization. The most essential factor in solving the problems set in the field of radiology and radiation safety is the ability to conFig. the MD software depending on the needs of a particular healthcare organization, medical physicist, radiologist, and X-ray laboratory assistant.
ADDITIONAL INFORMATION
Funding source. This article was not supported by any external sources of funding.
Competing interests. The authors declare that they have no competing interests.
Authors’ contribution. All authors made a substantial contribution to the conception of the work, acquisition, analysis, interpretation of data for the work, drafting and revising the work, final approval of the version to be published and agree to be accountable for all aspects of the work. M.P. Shatenok ― search for relevant publications, literature analysis, research design development, data processing, writing; S.A. Ryzhov ― determination of the main focus of the review, expert evaluation of literature review, research design development; K.V. Tolkachev ― expert evaluation of literature review, research design development; Yu.V. Druzhinina, Z.A. Lantukh ― systematization and final editing of the review.
Acknowledgments. We express our gratitude for the help in preparing the article for publication to the data researcher of the department for the coordination of scientific research, Irina A. Vinogradova, and to the translator of the scientific research work group, Andrey A. Romanov.
1 Information on exposure doses to patients during medical X-ray and radiological examinations (Form No. 3-DOZ). Access mode: http://www.consultant.ru/document/cons_doc_LAW_52009/c262c55885294afd998489c7f7ef8fe17e14da38/. Reference date: 03/15/2022.
2 The New York Times. Bogdanich W. Radiation overdoses point up dangers of CT scans [Internet], 2009 (https://www.nytimes.com/2009/10/16/us/16radiation.html); After stroke scans, patients face serious health risks [Internet], 2010 (https://www.nytimes.com/2010/08/01/health/01radiation.html); West Virginia hospital overradiated brain scan patients, records show [Internet], 2011 (https://www.nytimes.com/2011/03/06/health/06radiation.html).
3 Information on exposure doses to patients during medical X-ray and radiological examinations (Form No. 3-DOZ). Access mode: http://www.consultant.ru/document/cons_doc_LAW_52009/c262c55885294afd998489c7f7ef8fe17e14da38/. Reference date: 03/15/2022.
4 Radimetrics (Bayer) patient dose monitoring software not registered in the Russian Federation.
5 Official site of the Scientific and Practical Clinical Center for diagnostics and telemedicine technologies. Unified radiological information service. Access mode: https://tele-med.ai/proekty/edinyj-radiologicheskij-informacionnyj-servis_2020. Reference date: 03/15/2022.
6 ICRP, 1991. 1990 Recommendations of the International Commission on Radiological Protection. ICRP Publication 60. Ann. ICRP 21(1-3). Access mode: https://icrp.org/publication.asp?id=ICRP%20Publication%2060. Reference date 03/15/2022.
7 ICRP, 2007. The 2007 Recommendations of the International Commission on Radiological Protection. ICRP Publication 103. Ann. ICRP 37 (2-4). Access mode: https://icrp.org/publication.asp?id=ICRP%20Publication%20103. Reference date 03/15/2022.
8 Guidelines MU 2.6.1.3584-19 “Amendments to MU 2.6.1.2944-19 “Control of effective doses of exposure of patients during medical X-ray studies.” Access mode: https://base.g.,arant.ru/73515396/. Reference date: 03/15/2022.
9 ICRP, 2007. The 2007 Recommendations of the International Commission on Radiological Protection. ICRP Publication 103. Ann. ICRP 37 (2-4). Access mode: https://icrp.org/publication.asp?id=ICRP%20Publication%20103. Reference date: 15/03/2022.
10 NICE. Radiation dose monitoring software for medical imaging with ionising radiation. Medtech innovation briefing [published: October 31, 2017]. Access mode: www.nice.org.uk/guidance/mib127. Reference date: 15/03/2022.
Авторлар туралы
Maria Shatenok
Research and Practical Clinical Center for Diagnostics and Telemedicine Technologies
Email: maria.prusova@gmail.com
ORCID iD: 0000-0001-9217-7011
SPIN-код: 5165-7113
Ресей, Moscow
Sergey Ryzhov
Research and Practical Clinical Center for Diagnostics and Telemedicine Technologies; Dmitry Rogachev National Medical Research Center of Pediatric Hematology, Oncology and Immunology
Email: s.ryzhov@npcmr.ru
ORCID iD: 0000-0002-0640-7368
SPIN-код: 6595-4011
Ресей, Moscow; Moscow
Zoya Lantukh
Research and Practical Clinical Center for Diagnostics and Telemedicine Technologies
Email: z.lantukh@npcmr.ru
ORCID iD: 0000-0001-6623-9610
SPIN-код: 5486-6496
Ресей, Moscow
Yuliya Druzhinina
Research and Practical Clinical Center for Diagnostics and Telemedicine Technologies; Russian Medical Academy of Continuous Professional Education
Email: yu.druzhinina@npcmr.ru
ORCID iD: 0000-0002-3230-3722
SPIN-код: 1973-2848
Ресей, Moscow; Moscow
Kirill Tolkachev
Research and Practical Clinical Center for Diagnostics and Telemedicine Technologies
Хат алмасуға жауапты Автор.
Email: k.tolkachev@npcmr.ru
ORCID iD: 0000-0001-8871-8700
SPIN-код: 3196-7497
Ресей, Moscow
Әдебиет тізімі
- Parakh A, Kortesniemi M, Schindera ST. CT radiation dose management: a comprehensive optimization process for improving patient safety. Radiology. 2016;280(3):663–673. doi: 10.1148/radiol.2016151173
- Druzhinina YV, Ryzhov SA, Vodovatov AV, et al. COVID-19: changes in CT radiation burden across Moscow medical facilities. Digital Diagnostics. 2022;3(1):5–15. (In Russ). doi: 10.17816/DD87628
- Morozov SP, Soldatov IV, Lantukh ZA, et al. Characteristics of the dose load on patients in medical organizations in Moscow [Internet]. (In Russ). Available from: https://www.elibrary.ru/item.asp?id=42395967. Accessed: 15.03.2022.
- Rehani MM, Yang K, Melick ER, et al. Patients undergoing recurrent CT scans: assessing the magnitude. Eur Radiol. 2020;30(4):1828–1836. doi: 10.1007/s00330-019-06523-y
- Brenner DJ, Hall EJ. Computed tomography an increasing source of radiation exposure. N Engl J Med. 2007;357(22):2277–2284. doi: 10.1056/NEJMra072149
- Pasov VV, Korotkov VA. Surgical treatment of early radiation ulcer formed after endovascular intervention. Radiation Risk. 2020;29(4):158–163. (In Russ). doi: 10.21870/0131-3878-2020-29-4-158-163
- Ivanov VA, Belyakin SA, Permyakov SV, et al. Local radiation damage to the skin and thoracic vertebrae after endovascular angioplasty of the coronary arteries. Diagnostic Int Radiol. 2010;29(4):73–76. (In Russ).
- Ryzhov SA. Radiation accidents and errors in medicine. Terms and definitions. Med Physics. 2019;81(1):73–90. (In Russ).
- European Commission. Council Directive 2013/59/EURATOM of December 5, 2013 laying down basic safety standards for protection against the dangers arising from exposure to ionising radiation, and repealing Directives 89/618/Euratom, 90/641/Euratom, 96/29/Euratom, 97/43/Euratom and 2003/122/Euratom. OJ of the EU. 2014;13(57):1–80. Available from: http://eur-lex.europa.eu/eli/dir/2013/59/oj. Accessed: 15.03.2022.
- Loose RW, Vano E, Mildenberger P, et al. Radiation dose management systems-requirements and recommendations for users from the ESR EuroSafe Imaging initiative. Eur Radiol. 2021;31(4):2106–2114. doi: 10.1007/s00330-020-07290-x
- Lantukh ZA, Druzhinina YuV, Vodovatov AV, et al. The use of reference diagnostic levels for adult patients in radiation diagnostics. Ed. by S.P. Morozov. Vol. 86. Moscow: Research and Practical Clinical Center for Diagnostics and Telemedicine Technologies; 2020. 36 p. (Series: Best practices of radiation and Instrumental diagnostics) (In Russ).
- Vañó E, Miller DL, Martin CJ, et al. ICRP Publication 135: diagnostic reference levels in medical imaging. Ann ICRP. 201746(1):1–144. doi: 10.1177/0146645317717209
- Anonymous, Size-specific Dose Estimates (SSDE) in Pediatric and Adult Body CT examinations. In: American Association of Physicists in Medicine, TG-204. MD: AAPM; 2011.
- Habibzadeh MA, Ay MR, Asl AR, et al. Impact of miscentering on patient dose and image noise in x-ray CT imaging: phantom and clinical studies. Phys Med. 2012;28(3):191–199. doi: 10.1016/j.ejmp.2011.06.002
- Barreto I, Lamoureux R, Olguin C, et al. Impact of patient centering in CT on organ dose and the effect of using a positioning compensation system: Evidence from OSLD measurements in postmortem subjects. J Appl Clin Med Phys. 2019;20(6):141–151. doi: 10.1002/acm2.12594
- Xu XG. An exponential growth of computational phantom research in radiation protection, imaging, and radiotherapy: a review of the fifty-year history. Phys Med Biol. 2014;59(18):R233–R302. doi: 10.1088/0031-9155/59/18/R233
- Iriuchijima A, Fukushima Y, Ogura A. Comparison of organ dose calculation using monte carlo simulation and in-phantom dosimetry in CT examination. Nihon Hoshasen Gijutsu Gakkai Zasshi. 2018;74(2):166–171. doi: 10.6009/jjrt.2018_JSRT_74.2.166
- Fitousi N. Patient dose monitoring systems: a new way of managing patient dose and quality in the radiology department. Phys Med. 2017;44:212–221. doi: 10.1016/j.ejmp.2017.06.013
- Tsalafoutas IA, Hassan Kharita M, Al-Naemi H, Kalra MK. Radiation dose monitoring in computed tomography: status, options and limitations. Phys Med. 2020;79:1–15. doi: 10.1016/j.ejmp.2020.08.020
- Heilmaier C, Zuber N, Bruijns B, et al. Implementation of dose monitoring software in the clinical routine: first experiences. Rofo. 2016;188(1):82–88. doi: 10.1055/s-0041-106071
- Nicol RM, Wayte SC, Bridges AJ, Koller CJ. Experiences of using a commercial dose management system (GE DoseWatch) for CT examinations. Br J Radiol. 2016;89(1057):20150617. doi: 10.1259/bjr.20150617
Қосымша файлдар

