

")


多普勒观测闪烁神器:射频超声信号数据库
- 作者: Leonov D.V.1,2, Reshetnikov R.V.1,3, Kulberg N.S.1,4, Nasibullina A.A.2, Gromov A.I.5
-
隶属关系:
- Moscow Center for Diagnostics and Telemedicine
- National Research University Moscow Power Engineering Institute
- The First Sechenov Moscow State Medical University (Sechenov University)
- Federal Research Center Computer Science and Control of the Russian Academy of Sciences
- A.I. Yevdokimov Moscow State University of Medicine and Dentistry
- 期: 卷 2, 编号 3 (2021)
- 页面: 261-276
- 栏目: 原创性科研成果
- ##submission.dateSubmitted##: 24.07.2021
- ##submission.dateAccepted##: 24.08.2021
- ##submission.datePublished##: 15.10.2021
- URL: https://jdigitaldiagnostics.com/DD/article/view/76511
- DOI: https://doi.org/10.17816/DD76511
- ID: 76511

如何引用文章

详细
论证。通过仪器筛网上涂漆像素的快速混乱变化,表现出多普勒模式中的闪烁伪影。 不能足够地研究可用作有用的诊断特征的现象。 关于工件的原因的大多数假设是基于来自超声波装置屏幕的图像而没有深入研究接收信号的性质的深度研究。
材料与方法射频超声信号记录在幽灵的研究中。 这些物体导致器件屏幕上的闪烁伪像以及血管和软组织的模仿。 从2016年7月到3月2021年进行数据收集使用Sonad-500研究超声仪器获得数据,具有7,5 L38和3,4 C60传感器。
内容数据库 提供了一个包含射频信号的数据库,彩色多普勒成像模式下超声医学诊断仪接收通路波束形成器输出的结果和B-式。数据库中呈现的信号包含闪烁的伪影的符号。 基础包括研究五种不同幽灵的研究,总体积为10.5 GB。 射频数据以二进制形式存储。 分析射频数据所需的扫描设置包含在文本文件中。 每项研究伴随着以图形格式的特征超声图的示例。 数据库可在以下网址查阅:Https://mosmed.ai/datasets/ultrasound_doppler_twinkling_artifact.
代码可用性。为了查看和分析数据库,请将我们开发的TwinklingDataSetDisplay软件添加到存档中。程序源代码可用:https://github.com/Center-of-Diagnostics-and-Telemedicine/TwinklingDatasetDisplay.git.
使用条款。数据库可用于开发和测试用于处理超声信号的算法。 访问数据库和用于查看它的代码为每个人都打开。
关键词
全文:
论证
彩色多普勒成像模式下的闪烁伪影表现为超声医疗设备屏幕上彩色像素的快速混沌变化。最初用于研究血液流动的模式下观察,而排除血液运动的区域被染色。该问题的临床意义在于,闪烁伪影可以作为一种额外的诊断特征,用于寻找肾结石、输尿管和膀胱结石、胆囊和胆管结石。它还可用于检测乳腺肿瘤中发现的微钙化[1–8]。这些疾病的普遍性和社会意义,通过传统的超声波成像识别它们可能存在的困难需要寻找额外的诊断选项,其中之一可以是熟练地使用闪烁的工件。应注意,闪烁伪影的可检测性和强度高度可变,并取决于设备和扫描设置。
为了解释闪烁伪影的原因,提出了几个相互竞争、弱相关的假设[9–16]。为了证明他们的假设,大多数作者引用了超声波设备屏幕上的图像。事实上,对于这些假设的作者来说,超声波设备是一个“黑匣子”。 在无法研究信号处理的所有步骤的情况下,对闪烁伪影的原因做出了假设。 因此,大多数假设无法得到证实。
闪烁伪影的研究人员缺乏对射频数据的分析,射频数据比设备屏幕上的超声波图携带更多的信息。获取此类数据需要难以找到的研究仪器,这些仪器可提供原始射频信号的访问权限。 重要的是,仍然没有包含具有闪烁伪影迹象的多普勒超声信号的公开可用数据集。
本文介绍了从研究超声波设备预处理路径的波束形成器输出接收到的射频信号的开放基础,以及用于查看和分析的工具。
研究方法
遵从准则
该数据库包括对包含闪烁伪影迹象的人造物体(幻影)的观察的数字记录。 为了将物体包含在底座中,对两种不同的超声波设备进行了研究,在两者上都实现了稳定的闪烁模式。 该数据库还包括多普勒体模通道中流体流动的记录,模拟血管中的正常血流。
数据收集的持续时间
2016 年 7 月至 2021 年 7 月期间进行了研究
超声波设备
数据是使用线性 (7.5 L38) 和凸面 (3.4 C60) 换能器从 Sonomed-500 超声设备(Spectromed,莫斯科)的彩色多普勒映射和 B 可视化通道中获得的。

图 1.数据捕获方案。
形成数据库的射频信号如下获得(图1)。 64 个定相传感器元件用于在每个扫描方向上形成光束。 所有选定的元件都会发射一个具有延迟的脉冲,提供发射器的固定焦点。 对于 B 模式,发射持续时间为 ~ 1 μs 的脉冲,对于多普勒模式 - ~ 4 μs。 每个阵列元素分别接收回波。 模拟接收模块中,它们被放大,然后以 50 MHz 的频率进行数字化。各个通道的数字信号在波束形成器中与动态聚焦延迟相加。 形成的单波束信号被分光处理:数字化频率降低到10MHz。扫描方向是通过传感器的活性元件的重新组合来选择的。
为了验证观测结果,使用了辅助仪器Medison SA-8000 EX(韩国),该仪器不允许访问原始数据。它会显示测试对象的多普勒图像,并将闪烁的工件作为主设备,使用了L5-9EC线性传感器和C3-7ED对流传感器。检查机器的使用确保了文物是由研究对象中发生的客观物理过程引起的。这减少了闪烁不是由物体的特性引起的,而是由其中一种仪器的任何特性引起的情况的可能性。
彩色多普勒绘图模式下的数据获取原理
彩超 (CFM) 区域的大小由检查者交互确定。 选定区域内的每个方向(射线)都被照射 N 次。 照射同一组织部位时获得的一组N个信号称为多普勒脉冲串。 脉冲串内一个位置的时间称为“慢”时间,与“快”时间相反,“快”时间是在接收到一个波束时测量的,并且与信号的到达深度成正比。 血流和其他效应通过一次爆发中慢时间信号的变化来跟踪。 如果被调查对象没有变化,则这些信号与噪声相同。

图 2.彩色多普勒映射模式下扫描方案的说明。 垂直条带中的颜色对应于光线组中的光束号 (sweep)。 试验容器中显示红色。
如果依次照射同一个方向以获得突发脉冲,则可以获得大约5kHz的脉冲重复率,这对于大多数医疗应用来说是不适用的。 为了降低脉冲重复率,将研究区域划分为S个扫描分区(sweeps),每个分区由M个光束组成(图2)。 接收包时,从第1个到第M个依次照射一个子区域的光束。 因此,对于一个子区域的M个波束并行形成多普勒脉冲串。 然后对其余子域重复该过程。 这种情况下,脉冲重复率降低了 M 倍。
兴趣区域的总大小决定了光线的数量(S×M)。一个光束由P个复读数组成。有时会改变波束密度 Q 以提高帧速率。因此,如果 Q = 2,则CFM窗口的更新速度是原来的两倍,但会丢失有关每秒光线的信息。
以上所有动作重复F次, 从而形成由F帧组成的电影循环。 接收到的信号写入二进制文件,扫描参数放入同名文本文件(表)。
表格.基本扫描设置显示在.par文件中
变数 | 描述 | 符号 |
Number of frames | 图象数 | F |
Raw frame size | B+ CFM 中以双工模式构建一个帧所需的射频数据占用的内存量 | - |
Header size | 每个波束之前保留的字节内存容量 | - |
Number of B-beams | 接收瑟罗什卡尼图像时使用的光线数量 | B |
Size of B-beam in samples | 获得接收瑟罗什卡尼图像的参考数量并取决于扫描深度 | G |
Number of CF shots | 多普勒贴片中的脉冲次数 | N |
Number of sweeps | CFM 模式下的光线数量。一组射线被称为sweep, 框架 CFM 由几组光线组成 | S |
Beams in sweep | 每组中的光线数量 | M |
Size of CFM beam in samples | CFM模式中的引用次数 | P |
First scan CFM beam | CFM窗口的位置图像宽度 | - |
CFM density | CDC模式中的光束的密度由公式(b-a)/c确定,其中a和b是确定CFM窗口的左右边界的数字呈射线,c - CFM的数量光线 | Q |
Number of CFM beams | CFM模式下的光线数量 | S×M |
Number of first CFM sample | CFM窗口的位置深度相对于B图像深度 | - |
注意:CFM-彩超

调查和观察条件下的对象
大多数数据库包含从在多普勒模式下观察到闪烁伪影的对象反射的信号,包括在控制设备上。 这些是人造物体:由低碳热处理钢制成的粗糙和光滑的电线,由塑料 (ABS)、铝和木材制成的棒。 物体被放置在一个专门设计的幻影体内的固定位置。 身体充满琼脂、水、乙醇。 肾结石 in vitro的观察结果不包括在数据库中。 这样做的目的是使实验可以在独立条件下重现。 Gammex 1430 LE Mini-Doppler Flow System (美国)多普勒体模用于记录来自移动流体的信号。
多普勒单元由 5 个组成; 9 或 17 个脉冲。 使用线性换能器在7.5MHz 的载波频率下进行研究,B- 模式的功率为74%; 对于CFM模式,载波频率为6.3 MHz,功率为 97%,脉冲重复率为750Hz。 3.3MHz的载波频率、95%的B模式功率和3.3MHz的载波频率、98%的功率和1 kHz的脉冲重复率下进行了凸换能器的研究。所有情况下采样率都是 10 MHz。 其他设置,如帧间平均 (wall filter) 设置 其他的则不影响数据,因为数据是从预处理路径接收的。
内容数据库
数据库内容摘要
收集并放置在公共领域(https://mosmed.ai/datasets/ultrasound_doppler_twinkling_artifact)包含闪烁伪影迹象的数字射频信号记录。该数据库还包含从 Gammex 体模中的血管区域获得的信号、我们自己设计的专用体模以及来自组织模拟材料的反射。 该数据库将对研究 B 模式信号处理算法和CFM的研究人员有用。

图 3数据库组成
该数据库包括 5 组研究,研究对象不同 (图 3).每个研究都是一对具有相同名称和扩展名的文件 .dat 和 .par.原始数据记录附有说明闪烁伪影发生的图像和视频剪辑。数据库目录的名称中标明了调查对象和环境。目录名称中,“linear”一词表示使用7.5 L38线性探头,“convex”一词表示使用3.4 C60凸面探头。
数据库文件格式
RF 信号以二进制形式写入扩展名为 .dat 的文件中(图4)。 它包含用于在 B 模式(B-frame)和CFM (CFM-frame) 帧中构建帧的复杂数据。记录每个样本的实部和虚部以 «32 bit little-endian (LE) signed integer»。记录的方式是首先记录一个 20 位的标题,在图14 中用符号 H 表示。然后B图像的第一条光线的样本,指定为 В-sample B 样本,然后B图像的第二条和后续光线的标题和样本。

图4.* .dat文件中的“原始”射频数据的存储方案。
接下来,记录用于构建CFM的样本,指定为СFI-sample,首先写入标头 H,然后为突发中的第一个脉冲和来自第一组(sweep)的第一条射线获得的所有深度读数为书面。 这就是我们从CDI获取第一行数据的方式;每个后续行也由标题分隔。
此外,以相同的方式记录第二帧和后续帧。每个 .dat 文件对应一个扩展名为 .par 的同名文本文件,其中包含有关扫描参数的信息(表)。 它包含数量的特定值 F; G; B; F; S; N; M; P; Q.
数据库查看器
为了查看和分析建议的数据库,开发了 TwinklingDatasetDisplay 程序。 它仅用于查看RF信号不包括用于CFM [17–30] 的任何信号处理算法。 所有软件模块均使用 XRAD 库以 C++ 编写 [31]。 程序在公共领域 (https://github.com/Center-of-Diagnostics-and-Telemedicine/TwinklingDatasetDisplay.git).Windows 可执行文件也包含在数据库中。
TwinklingDatasetDisplay 允许:
• 使用随附的 .par 文件中的信息打开 .dat 文件;
• 从数据生成传统的灰度 B 模式图像;
• 根据CFM模式的“快”和“慢”时间,以图形的形式显示复杂信号;
• 将光谱分析的元素应用于它们。

图5使用TwinklingDataSetDisplay程序的射频信号可视化的示例:
a ― Gammex中的流体流动; b - 没有运动的软组织区域; c - 粗糙物体上闪烁的伪影的信号; d - 光滑对象上的闪烁伪影信号。 左栏中,复杂信号表示为极性坐标中的参数线(实际部分沿横坐标的轴线显示,沿纵轴沿着纵轴)。 右栏显示了对包内的“慢速”时间的依赖性。
确定多普勒模式的“慢”时间信号的示例如图 5 所示。 此处显示的是来自不同区域的典型信号图:
• 模拟血液沿多普勒体模 Gammex 1430 LE Mini-Doppler Flow System(可以看出信号的实部和虚部呈正交变化,这是移动物体的典型特征;图5,a);
• 没有运动的软组织区域(过滤信号后,组织中只剩下噪声;图5,b);
• 钢丝上闪烁伪影的观察区域 (观察到一个随机信号,它与图 5b 中的噪声有更大的差异; 图5、c);
• 平滑物体上闪烁伪影的观察区域(信号显示由被观察物体的微振荡引起的周期性;图 5,d)。
数据库组成
1. Gammex 1430 LE Mini-Doppler Flow System多普勒体模研究套件。
在图6介绍了幻影的外观和方案; 在图.给出了声波图的例子。 横向扫描中,线性传感器与容器成60°角安装,流速为30厘米 /秒,数据在5处获得; 9 和 17 个探测脉冲依次进行,脉冲重复率为 2.5 kHz。 这种情况下,观察到了典型的超声图,在检查颈动脉时可以看到。

图 6.外观和 Gammex 1430 LE Mini-Doppler.幻影方案
使用线性传感器进行纵向扫描期间,流速设置为50厘米/秒,研究在 17 个探测脉冲和 1 kHz 的频率下进行。 多普勒显示的投影速度接近于零。这样的研究对于调试映射算法是有用的。
还使用凸面换能器进行纵向扫描,同时以2 kHz的脉冲重复率在不同流速(30 厘米/秒;65 厘米/秒;100 厘米/秒)下进行3项研究。这些研究中,使用了凸探头。这种情况下,沿水平容器的流速投影的估计值从穿过零的负值变为正值;用血流CDI模式的整个调色板对血管进行染色。

图 7.Gammex 超声图幻影:a - 在流量为60º的线性传感器的研究中; b - 平行流; c - 研究凸传感器时
图.中所有后续的超声图像被并排放置,作为叠加多普勒的B图像和不带多普勒的B图像。随后的研究是使用线性换能器进行的,因为它的应用在浅层深度研究中被普遍接受。 优先考虑脉冲重复率的小值,因为它们可以记录闪烁伪影的两种类型的信号 [32]。
2. 为研究闪烁伪影而对特殊模型进行的一组研究(图8;模型的详细描述见[32])。

图 8.专业幻像的摄影和图纸指示毫米和测量位置的尺寸
检查模型时,在固定编号的位置应用线性传感器。我们研究了直径为1.75毫米的圆柱体,圆柱体由金属(位置1;4;8)、塑料(位置2;5;7)、木棒(位置3;6)各种介质(水、酒精、琼脂)中制成。该套件包含使用具有9个探测脉冲和1kHz脉冲重复率的线性传感器进行的研究。特征声波图在图9提出。可以看出当幻影充满乙醇时,闪烁伪影出现的频率远低于使用其他介质时。在水中木棒上冒出的气泡也可以看到这件工艺品。您还可以注意到,铝杆上的闪烁强度明显大于塑料杆和木制杆上的闪烁强度。
3. @蓝色假体@乳房弹性成像假体研究工具包包含线性传感器在5时采集的数据;9和17个连续探测脉冲,重复频率为150 Hz,以及17个探测脉冲和重复频率为300 Hz;500赫兹;750赫兹;1千赫。

图 9.专业幻像的声图的示例,其指示位置和填充环境:a - 位置2(4杆,塑料与传感器平面平行); b - 位置3(木材4杆,位于传感器端的端部); c 是位置4(4个铝棒,位于传感器端的端部); d - 位置10(由木材,铝和塑料制成的杆,位于传感器)。
幻影、摄影和图表在图10 (a, b)提出,就包含模拟微钙化的夹杂物; 在图 10(c) 中,它们由计算机断层扫描图像截面上的箭头表示。 CFM模式下的这些夹杂物上(图10,d),在低脉冲重复率下观察到闪烁的伪影。 随着频率的增加伪影的强度降低,直到在1 kHz 以上的频率下完全消失。

图 10.Blue Phantom幻影乳房:a - 外观; b - 包含方案; c - 计算机断层图像部分(箭头表示测试区域); d - 超声图。
4. 一组尺寸约为 200 μm 的微钙化研究,人工生长在琼脂果冻中。
使用线性传感器以500 Hz的重复频率对两个样品进行检查,每次脉冲为9个脉冲。特征声波图在图11提出。

图 11.用微晶在琼脂果冻中生长的微晶的声音图: a 显微镜下的A样品切片; b - 生长过程中的微晶; c - 琼脂 - 琼脂用微晶插入微晶。
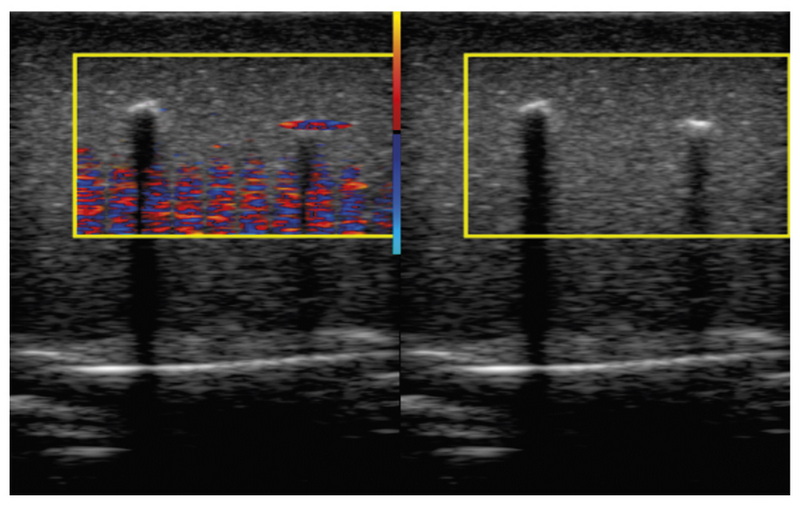
5. 琼脂中粗钢丝和木棒的研究。
该研究是使用具有 9 个探测脉冲的线性换能器进行的。 与图9所示的实验相反,木材经历了长时间的初步润湿和脱气。 从图12中可以看出,两个物体都会产生声影,并且在 B 图像中具有相同的回声性。 然而,闪烁的神器出现在金属上,而不是木头上。 观察结果的差异使得其中一种类型的闪烁与木材结构中的空气微泡有关。

图 12.用木杆(左)和钢丝(右)的幻影的声音图。
数据库使用说明
大多数致力于闪烁伪影的作品 [1–8, 10–13] 中,研究是在公开可用的超声波诊断设备的基础上进行的,这些设备无法访问信号处理路径。此类研究中的超声设备可被视为“黑匣子”,仅对设备屏幕上的超声图进行的分析提供的信息不足,并且会产生可重复性问题,因为不同制造商的设备的处理算法是独一无二的。
原始数据的获取对于开发新的超声成像仪器至关重要。 然而,由于商用仪器的封闭架构,RF 信号通常无法从处理路径获得。工作 [33] 展示了这个问题的可能解决方案,需要对设备进行手工修改。该数据库提供有关信号的所有信息,而无需对商业设备进行自我修改,从而不可避免地失去保修和其他不良后果。
我们相信所提供的数据库具有重要的实际意义,因为 在它的帮助下,就可以创建新工具 [17] 来识别肾结石和其他与闪烁伪影相关的物体。
使用该数据库,我们进行了多项研究,其中:
1) 揭示了闪烁伪影信号与血流信号之间的差异; 调查了闪烁伪影的两个物理原因。 设备屏幕上的图像看起来是一样的,但背后确实有不同的物理过程,在信号层面上是清晰可见的[32];
2) 开发了一种特殊模式,允许您不将闪烁显示为多普勒错误,这意外证明是有用的,而是作为特殊的诊断选项 [17, 34]。 使用此模式,您可以“拉出”常规设备不会显示的闪烁。 它可以显示闪烁和血流单独或一起使用不同的色标;
3) 对过滤容器壁振动的算法进行了比较分析 (wall filters)[35, 36]。新的过滤算法[37–40]出现在文献中,多亏了公布的数据库,那些希望比较它们的人有机会进行比较。
作为数据库的一项开发,有兴趣使用 in vivo信号和在设备的其他操作模式(频谱多普勒模式、矢量流等)下获得的信号对其进行补充。所提供的用于打开数据库的程序具有最少的功能集。 但它的开源 C++ 允许您进行自己的增强。
文章中给出的数据库描述提供了足够的信息,可以在任何其他编程环境中打开它。
数据库的缺点
所提供的数据库有许多缺点,其中最重要的是信息不完整:
• 关于所研究的对象(例如,在琼脂冻中生长的钙化的大小是大致已知的;粗线表面的几何参数等尚未研究);
• 关于实验条件(在部分研究中,没有记录传感器的确切位置、焦距、辐射功率,并不总是有关于脉冲重复率的信息等)。
代码可用性
可以查看数据库的程序源码: https://github.com/Center-of-Diagnostics-and-Telemedicine/TwinklingDatasetDisplay.git.
使用条款
本文介绍了一个数据库,其中包含来自 Sonomed-500 超声波设备预处理路径的“原始”射频信号的数字记录。 总容量为 10.5 GB 的数据库主要包含在血流的CFM模式下观察到闪烁伪影的对象的研究。 OBD应用最明显的领域是开发和测试用于处理超声诊断设备信号的算法。该数据库可在互联网上公开获取 (https://mosmed.ai/datasets/ultrasound_doppler_twinkling_artifact)。
该基地在许可下可用 Creative Commons Attribution – Noncommercial – Share Alike (CC BY-NC-SA).发布使用数据库获得的结果的情况下,请参阅本文。 创意产品的情况下,有必要在相同的许可下分配它们。 允许使用数据库获取财务福利的任何尝试。
附加信息
资金来源。该文章根据莫斯科市“科学提供大都会健康”的卫生部的计划,作为研发的一部分(EMIS№:AAAA-A20-1200710900554-9),据莫斯科市“大都会卫生”的卫生部门为2020-2022。
利益冲突。作者声明没有明显的和潜在的利益冲突相关的发表这篇文章。
作者的贡献。 D.V. Leonov,N.S. Kulberg - 材料的概念和设计,材料的概念和设计,编写手稿的文本的说明书; R.V. Reshetnikov和A.A. Nasibullina - 参与形成研究计划,讨论稿件的每个分区,检查数据库,编写插图; A.I. Gromov - 概念和研究设计,手稿编辑。 所有作者都确认其作者符合国际ICMJE标准(所有作者为文章的概念,研究和准备工作做出了重大贡献,并在发表前阅读并批准了最终版本)。
作者简介
Denis V. Leonov
Moscow Center for Diagnostics and Telemedicine; National Research University Moscow Power Engineering Institute
Email: strat89@mail.ru
ORCID iD: 0000-0003-0916-6552
SPIN 代码: 5510-4075
Scopus 作者 ID: 56781375200
Researcher ID: P-5266-2017
Cand. Sci. (Tech)
俄罗斯联邦, 24 bld.1, Petrovka street,127051 Moscow; 28-1, Srednyaya Kalitnikovskaya street, Moscow, 109029Roman V. Reshetnikov
Moscow Center for Diagnostics and Telemedicine; The First Sechenov Moscow State Medical University (Sechenov University)
Email: reshetnikov@fbb.msu.ru
ORCID iD: 0000-0002-9661-0254
SPIN 代码: 8592-0558
Cand. Sci. (Phys.-Math.)
俄罗斯联邦, 24 bld.1, Petrovka street,127051 Moscow; 127051 Moscow, Russia; 8 bld.2Nikolay S. Kulberg
Moscow Center for Diagnostics and Telemedicine; Federal Research Center Computer Science and Control of the Russian Academy of Sciences
Email: kulberg@npcmr.ru
ORCID iD: 0000-0001-7046-7157
SPIN 代码: 2135-9543
Cand. Sci. (Phys.-Math.)
俄罗斯联邦, 24 bld.1, Petrovka street,127051 Moscow; 44, buil. 2, st. Vavilova, Moscow 119333Anastasia A. Nasibullina
National Research University Moscow Power Engineering Institute
Email: nastya.nasibullina@yandex.ru
ORCID iD: 0000-0003-1695-7731
SPIN 代码: 2482-3372
Student
俄罗斯联邦, 28-1, Srednyaya Kalitnikovskaya street, Moscow, 109029Alexandr I. Gromov
A.I. Yevdokimov Moscow State University of Medicine and Dentistry
编辑信件的主要联系方式.
Email: gromov.ai@medsigroup.ru
ORCID iD: 0000-0002-9014-9022
SPIN 代码: 6842-8684
MD, Dr. Sci. (Med.), Professor
俄罗斯联邦, Delegatskaya st., 20, p. 1, 127473, Moscow参考
- Masch WR, Cohan RH, Ellis JH, et al. Clinical effectiveness of prospectively reported sonographic twinkling artifact for the diagnosis of renal calculus in patients without known urolithiasis. Am J Roentgenol. 2016;206:326–331. doi: 10.2214/ajr.15.14998
- Fujimoto Y, Shimono C, Shimoyama N, Osaki M. Twinkling artifact of microcalcifications in breast ultrasound. Ultrasound Med Biol. 2017;43(Suppl. 1):S21. doi: 10.1016/j.ultrasmedbio.2017.08.1010
- Bennett J.M., Estrada J.C., Shoemaker M.B., Pretorius M. Twinkling Artifact Associated with Guidewire Placement. Anesth Analg. 2015;121(1):69–71. doi: 10.1213/ane.0000000000000683
- Sen V, Imamoglu C, Kucukturkmen I, et al. Can Doppler ultrasonography Twinkling artifact be used as an alternative imaging modality to non-contrast-enhanced computed tomography in patients with ureteral stones? A prospective clinical study. Urolithiasis. 2017;45(2):215–219. doi: 10.1007/s00240-016-0891-8
- Winkel RR, Kalhauge A, Fredfeldt KE. The usefulness of ultrasound colour-Doppler twinkling artefact for detecting urolithiasis compared with low dose nonenhanced computerized tomography. Ultrasound Med Biol. 2012;38(7):1180–1187. doi: 10.1016/j.ultrasmedbio.2012.03.003
- Yavuz A, Ceken K, Alimoglu E, Kabaalioglu A. The reliability of color Doppler "twinkling" artifact for diagnosing millimetrical nephrolithiasis: comparison with B-Mode US and CT scanning results. J Med Ultrasonics. 2015;42(2):215–222. doi: 10.1007/s10396-014-0599-8
- Tian J, Xu L. Color Doppler Twinkling artifact in diagnosis of tuberculous pleuritis: A comparison with gray-scale ultrasonography and computed tomography. Ultrasound Med Biol. 2018;44(6): 1291–1295. doi: 10.1016/j.ultrasmedbio.2018.01.003
- Relea A, Alonso JA, González M, et al. Usefulness of the twinkling artifact on Doppler ultrasound for the detection of breast microcalcifications. Radiología. 2018;60(5):413–423. doi: 10.1016/j.rx.2018.04.004
- Lu W, Sapozhnikov OA, Bailey MR, et al. Evidence for trapped surface bubbles as the cause for the twinkling artifact in ultrasound imaging. Ultrasound Med. 2013;39(6):1026–1038. doi: 10.1016/j.ultrasmedbio.2013.01.011
- Aytac SK, Ozcan H. Effect of color Doppler system on the «twinkling» sign associated with urinary tract calculi. J Clin Ultrasound. 1999;27(8):433–439. doi: 10.1002/(sici)1097-0096(199910)27:8<433::aid-jcu4>3.0.co;2-1
- Rahmouni A, Bargoin R, Herment A, et al. Color Doppler Twinkling artifactin hyperechoic regions. Radiology. 1996;199(1):269–271. doi: 10.1148/radiology.199.1.8633158
- Kamaya A, Tuthill T, Rubin JM. Twinkling artifact on color Doppler sonography: dependence on machine parameters and underlying cause. Am J Roentgenol. 2003;180(1):215–222. doi: 10.2214/ajr.180.1.1800215
- Weinstein SP, Seghal C, Conant EF, Patton JA. Microcalcifications in breast tissue phantoms visualized with acoustic resonance coupled with power doppler US: initial observations. Radiology. 2002:224(1):265–269. doi: 10.1148/radiol.2241010511
- Seghal C. Apparatus for imaging an element within a tissue and method therefor. United States Patent. 1999;477(5):997.
- Li T, Khokhlova TD, Sapozhnikov OA, et al. A new active cavitation mapping technique for pulsed HIFU applications–bubble Doppler. IEEE Trans Ultrason Ferroelectr Freq Control. 2014;61(10): 1698–1708. doi: 10.1109/TUFFC.2014.006502
- Simon JC, Sapozhnikov OA, Kreider W, et al. The role of trapped bubbles in kidney stone detection with the color Doppler ultrasound twinkling artifact. Phys Med Biol. 2018;63(2):025011. doi: 10.1088/1361-6560/aa9a2f
- Leonov DV, Kulberg NS, Gromov AI, et al. Diagnostic mode detecting solid mineral inclusions in medical ultrasound imaging. Acoust Phys. 2018;64(5):624–636. doi: 10.1134/S1063771018050068
- Yu AC, Johnston KW, Cobbold RS. Frequency-based signal processing for ultrasound color flow imaging. Canadian Acoustics. 2007;35(2):11–23.
- Yu AC, Løvstakken L. Eigen-based clutter filter design for ultrasound color flow imaging: a review. IEEE Trans Ultrason Ferroelectr Freq Control. 2010;57(5):1096–1111. doi: 10.1109/TUFFC.2010.1521
- Yu AC, Cobbold RS. Single-ensemble-based eigen-processing methods for color flow imaging ― Part I. The Hankel-SVD filter. IEEE Trans Ultrason Ferroelectr Freq Control. 2008;55(3):559–572. doi: 10.1109/TUFFC.2008.682
- Shen Z, Feng N, Shen Y, Lee CH. An improved parametric relaxation approach to blood flow signal estimation with single-ensemble in color flow imaging. J Med Biomed Engineering. 2013;33(3):309–318. doi: 10.5405/jmbe.1368
- Yoo YM, Managuli R, Kim Y. Adaptive clutter filtering for ultrasound color flow imaging. Ultrasound Med Biol. 2003;29(9): 1311–1320. doi: 10.1016/S0301-5629(03)01014-7
- Torp H. Clutter rejection filters in color flow imaging: a theoretical approach. IEEE Trans Ultrason Ferroelectr Freq Control. 1997;44(2):417–424. doi: 10.1109/58.585126
- Wang PD, Shen Y, Feng NZ. A novel clutter rejection scheme in color flow imaging. Ultrasonics. 2006;44( Suppl 1):e303–305. doi: 10.1016/j.ultras.2006.06.017
- Bjærum S, Torp H. Statistical evaluation of clutter filters in color flow imaging. Ultrasonics. 2000;38(1-8):376–380. doi: 10.1016/s0041-624x(99)00153-5
- Kargel C, Hoebenreich G, Plevnik G, et al. Velocity estimation and adaptive clutter filtering for color flow imaging. WSEAS. 2002. Р. 1711–1716.
- Kargel C, Höbenreich G, Trummer B, Insana MF. Adaptive clutter rejection filtering in ultrasonic strain-flow imaging. IEEE Trans Ultrason Ferroelectr Freq Control. 2003;50(7):824–835. doi: 10.1109/tuffc.2003.1214502
- Lo MT, Hu K, Peng CK, Novak V. Multimodal pressure flow analysis: application of hilbert huang transform in carabral blood flow regulation. EURASIP J Adv Signal Process. 2008;2008:785243. doi: 10.1155/2008/785243
- Gerbands JJ. On the relationships between SVD, KLT and PCA. Pattern Recognition. 1981;14:375–381. doi: 10.1016/0031-3203(81)90082-0
- Løvstakken L. Signal processing in diagnostic ultrasound: algorithms for real-time estimation and visualization of blood flow velocity. Doctoral thesis, norwegian university of science and technology. Trondheim; 2007. Available from: https://pdfslide.net/ documents/signal-processing-in-diagnostic-ultrasound-algorithms-for-real-time-.html. Accessed: 14.08.2021.
- XRAD C++ software library. Available from: https://github.com/ Center-of-Diagnostics-and-Telemedicine/xrad.git. Accessed: 14.08.2021.
- Leonov DV, Kulberg NS, Gromov AI., et al. Causes of ultrasound doppler twinkling artifact. Acoust Phys. 2018;64(1):105–114. doi: 10.1134/S1063771018010128
- Mari JM, Cachard C. Acquire real-time RF digital ultrasound data from a commercial scanner. Electronic J Technical Acoustics. 2007;3:28–43.
- Leonov DV, Kulberg NS, Gromov AI, Morozov SP. Detection of microcalcifications using the ultrasound Doppler twinkling artifact. Biomedical Engineering. 2020;54(3):174–178. doi: 10.1007/s10527-020-09998-y
- Leonov DV, Kulberg NS, Fin VA, et al. Clutter filtering for diagnostic ultrasound color flow imaging. Biomedical Engineering. 2019;53(3):217–221. doi: 10.1007/s10527-019-09912-1
- Leonov DV, Kulberg NS, Fin VA, et al. Comparison of filtering techniques in ultrasound color flow imaging. Biomedical Engineering. 2019;53(2):97–101. doi: 10.1007/s10527-019-09885-1
- Song P, Manduca A, Trzasko JD, Chen S. Ultrasound small vessel imaging with block-wise adaptive local clutter filtering. IEEE Trans Med Imaging. 2017;36(1):251–262. doi: 10.1109/TMI.2016.2605819
- Li YL, Hyun D, Abou-Elkacem L, et al. Visualization of small-diameter vessels by reduction of incoherent reverberation with coherent flow power doppler. IEEE Trans Ultrason Ferroelectr Freq Control. 2016;63(11):1878–1889. doi: 10.1109/TUFFC.2016.2616112
- Chee AJ, Alfred CH. Receiver operating characteristic analysis of eigen-based clutter filters for ultrasound color flow imaging. IEEE Trans Ultrason Ferroelectr Freq Control. 2017;65(3):390–399. doi: 10.1109/TUFFC.2017.2784183
- Chee AJ, Yiu BY, Alfred CH. A GPU-Parallelized eigen-based clutter filter framework for ultrasound color flow imaging. IEEE Trans Ultrason Ferroelectr Freq Control. 2017;64(1):150–163. doi: 10.1109/TUFFC.2016.2606598
补充文件

