

")


Substantiation of a new approach to the criteria for assessing the radiation dose of patients during computed tomography
- Authors: Matkevich E.I.1,2, Sinitsyn V.Е.2,3, Ivanov I.V.4,5
-
Affiliations:
- State Research Center - Burnasyan Federal Medical Biophysical Center of Federal Medical Biological Agency
- I.V. Davydovsky City Clinical Hospital
- Lomonosov Moscow State University
- Sechenov First Moscow State Medical University (Sechenov University)
- State Scientific-Research Test Institute of Military Medicine
- Issue: Vol 3, No 4 (2022)
- Pages: 344-361
- Section: Original Study Articles
- Submitted: 09.09.2022
- Accepted: 28.11.2022
- Published: 30.12.2022
- URL: https://jdigitaldiagnostics.com/DD/article/view/110857
- DOI: https://doi.org/10.17816/DD110857
- ID: 110857

Cite item

Abstract
BACKGROUND: In accordance with the requirements of the IAEA basic safety standards and the International Commission on Radiation Protection, comparing the radiation dose for patients undergoing computed tomography (CT) in diagnostic and treatment clinics with national or international DRLs is important for controlling medical radiation doses. The search for ways to improve DRLs calculations determines the relevance of such studies.
AIM: To analyze the dependence of effective doses (EDs) in CT of different body parts on patient’s weight and to calculate the standard ED for the patient (70 and 80 kg).
MATERIALS AND METHODS: CT acquisition protocols in 209 patients were single phase (SP) CT, while 114 patients underwent multi-phase (MP) CT. ED was calculated according to the normalized coefficients for each body area. The values of standard ED was calculated by data approximation using linear function of ED relatively body weight for each type CT scanner and body area scanned.
RESULTS: The increase in ED following a CT examination was proportional to the body weight of patients. For SP and MP CT scans, the standard EDs were calculated according to all body areas. The mean ED, median ED, and DRLs (mSv) in these groups was slightly higher than standard ED (mSv) if the criterion was 70 kg and were close to standard ED if the criterion was 80 kg. These values give a basis for improving the guidelines concerning the recommended limits of radiation doses for CT in individual patients according to indications and body parts studied.
CONCLUSIONS: In the study, a methodology for assessing and comparing the dose of CT-radiation at two hospitals in the two CT scanners, considering weight of a standard patient, is described. Our results show that the calculation and analysis of the standard ED of CT-examining areas of the body instead of mean ED and median ED help to compare the radiation exposure in different medical facilities more properly. Given the recent sharp increase in the number of CT studies, not exceeding the standard ED for patients with CT will reduce the long-term consequences in the form of oncological pathology among the population.
Full Text
ABBREVIATIONS
CT: computed tomography
CTDIvol: volume computed tomography dose index (mGy)
DLP: dose–length product calculated as a product of dose (mGy) and the length of the body area scanned (cm)
DRLs: diagnostic reference levels
ED: effective dose (mSv)
ICRP: International Commission on Radiological Protection
SSDE: size-specific dose estimate (mGy)
BACKGROUND
Recently, the application of computed tomography (CT) has increased in Russia and elsewhere. In 2020, the average annual medical effective dose per capita in Russia dramatically increased by 30% (0.6 mSv in 2019, 0.81 mSv in 2020) [1], but the CT contribution to the collective medical exposure dose increased from 22.1% in 2010 to 73.5% in 2020 and currently ranks first among all types of X-ray and radiological examinations. In the long term, an increase in the total patient radiation doses should be expected during screening CT scans to diagnose the consequences of COVID-19 and lung and breast cancer as well as repeated CT scans to establish changes in the pathological process, including CT using radiopaque agents.
According to the basic safety standards of the International Atomic Energy Agency [2] and the International Commission on Radiological Protection ICRP) [3–7], to control medical radiation doses, CT radiation doses in diagnostic and medical clinics must be compared with national or international diagnostic reference levels (DRLs). The importance of such studies is driven by the need to find ways to improve DRL calculations.
The purpose of this study was to analyze the relationship between an effective dose (ED) and patient weights in the CT scans of various body areas as well as to calculate standard EDs for patients weighing 70 kg and 80 kg.
MATERIALS AND METHODS
Study Design
A retrospective study was performed using the electronic databases of the single-phase CT (SP-CT) and multiphase CT (MP-CT) of the head, chest, abdomen, and pelvis.
Eligibility Criteria
Inclusion Criteria: patients aged 17 to 95 who were referred to a diagnostic CT scan by their attending healthcare professional.
Exclusion Criteria: patients with missing body weight data.
Study Conditions
This study included the patients of two multi-disciplinary healthcare institutions: the Treatment and Rehabilitation Center of the Ministry of Health of Russia (Site 1) and the I.V. Davydov City Clinical Hospital of the Department of Health of Moscow (Site 2) using standard CT protocols for these body areas.
Study Duration
Electronic data on patient CT radiation exposure for 2015–2018 were analyzed.
Description of Medical Intervention
CT scans were performed using two CT scanners (at Site 1: GE Discovery CT750 HD, 64-slice, GE Healthcare, USA; at Site 2, Toshiba Aquilion Prime, 80-slice, Toshiba, Japan) following the standard scanning protocol [8]: The tube voltage was 100 kV or 120 kV with automatic current modulation, and the slice thickness was 0.5, 0.625, 1.25, and 1.5 mm. The key parameters of CT protocols are presented in Table 1. In this study, all CT scans used the same type of noise reduction algorithms for the corresponding body area.
Table 1. General characteristics of patients and protocol parameters for SP-CT and MP-CT
Parameters | Region of interest | One-phase CT | Multiphase CT | ||
Site 1 | Site 2 | Site 1 | Site 2 | ||
General characteristics of patients | |||||
Number of patients, n | Head | 18 | 32 | 14 | 8 |
Chest | 25 | 38 | 11 | 27 | |
Abdomen + pelvis | 75 | 21 | 30 | 24 | |
Total | 118 | 91 | 55 | 59 | |
Male/female | Head | 8/10 | 9/23 | 6/8 | 5/3 |
Chest | 9/16 | 17/21 | 6/5 | 15/12 | |
Abdomen + pelvis | 33/42 | 10/11 | 12/18 | 7/17 | |
Total | 50/68 | 36/55 | 24/31 | 27/32 | |
Age, М ± m, years | Head | 52.1±3.2 | 66.3±2.5 | 52.5±3.0 | 56.8±7.2 |
Chest | 57.6±2.7 | 51.9±3.0 | 58.6±4.7 | 62.7±3.2 | |
Abdomen + pelvis | 57.5±5.3 | 65.3±4.8 | 57.6±2.5 | 55.5±3.5 | |
Weight, М ± m, kg | Head | 79.8±3.2 | 77.0±2.0 | 81.2±3.8 | 86.6±3.5 |
Chest | 76.1±4.0 | 76.3±2.3 | 75.5±5.0 | 91.6±3.2 | |
Abdomen + pelvis | 75.5±2.0 | 83.1±3.5 | 79.7±2.9 | 80.7±2.7 | |
Key parameters of CT protocols | |||||
Collimation (mm) | Head, chest, abdomen, pelvis | 64×0,6 | 80×0,5 | 64×0,6 | 80×0,5 |
Tube current modulation | Head, chest, abdomen, pelvis | Automatic | Automatic | Automatic | Automatic |
Tube voltage (kV) | Head | 120 | 120 | 120 | 120 |
Chest | 120 | 120 | 100; 120 | 120 | |
Abdomen + pelvis | 120 | 120 | 100; 120 | 120 | |
Pitch | Head | 0.531 | 0.625 | 0.531 | 0.625 |
Chest | 1.375 | 1.388 | 0.984; 1.375 | 1.388 | |
Abdomen + pelvis | 1.375 | 0.813 | 0.984; 1.375 | 0.813 | |
Rotation time (sec) | Head | 0.8 | 0.5; 0.75 | 0.8 | 0.5; 0.75 |
Chest | 0.6; 0.7 | 0.5 | 0.6; 0.7 | 0.5 | |
Abdomen + pelvis | 0.7 | 0.5 | 0.7 | 0.5 | |
Slice thickness (mm) | Head | 1.25 | 0.5 | 1.25 | 0.5 |
Chest | 1.25 | 0.5 | 0.625; 1.25 | 0.5 | |
Abdomen + pelvis | 1.25 | 0.5 | 0.625; 1.25 | 0.5 | |
Note. * In the studies conducted, low-dose protocols and special noise reduction algorithms were not used. Filtered BackProjection technology was used. CT: computed tomography.
Based on the CT reports of each patient, the following radiation exposure parameters were entered into the database: CTDIvol (volume-weighted computed tomography dose index, mGy) and DLP (absorbed dose for the entire CT scan, mGy × cm). Individual patient EDs were calculated using the formula [5]:
ED (mSv) = KED DLP × DLP, (1)
where ED is the effective dose; K is a coefficient; and DLP (dose–length product) is the product of the dose absorbed (mGy) and the length of the body area scanned (cm).
For the calculations, we used the KEd DLP conversion coefficients (mSv × mGy−1 × cm−1) [4]: head, 0.0023; chest, 0.017; abdomen, 0.015; and, pelvis 0.019.
Primary Study Outcome
This study is aimed at evaluating the relationship between the ED in patients undergoing CT scans of various body areas and the patient’s body weight as well as at calculating a standard ED for typical patients weighing 70 kg and 80 kg. As a reference, we used the mean ED, median ED, and the 75th quantile of the ED in the same group of patients.
Additional Study Outcomes
The body weight distribution was assessed by group, and mean weight changes were analyzed in our study population.
Subgroup Analysis
Two study groups were formed and compared: the group of Site 1 (GE Discovery CT750 HD, 64-slice) and the group of Site 2 (Toshiba Aquilion Prime, 80-slice). Each group was divided into three subgroups according to CT areas (head, chest, and abdomen and pelvis). In each subgroup, patient radiation doses were calculated for SP-CT and MP-CT.
Ethical Review
For retrospective studies using anonymized datasets, an ethics committee opinion is not required.
Statistical Analysis
The size of the groups was determined by the number of patients who were followed up during the study period and who had data on the radiation dose + weight during CT scans. The analysis included CT scans with good image quality following the European guidelines on Quality Criteria for Computed Tomography [4]. In this context, good image quality was considered as “visually clear reproduction of the structure of organs, tissues, etc., the boundaries between them, as well as lesions and foci.”
We specifically measured the body weight of each patient with an accuracy of ±3 kg and calculated mean body weights (M ± m, kg) for all groups. Inter-site differences in means reported for each CT area were calculated using the t-test (p ≤ 0.05). To establish the radiation dose–weight relationship, a regression correlation analysis was performed using STATISTICA software (v. 10.0).
We determined individual patient EDs (in mSv) for Site 1 and Site 2 using formula (1), then calculated the mean ED (mSv) as the arithmetic mean (M) with standard deviations (± m), median, 25th and 75th quantiles of the ED (mSv) (Me [25th, 75th]), and DRLs (mSv; ED75th) for each scan area using the Microsoft Excel 2013 software package.
We calculated the standard ED assuming [4, 7, 9, 10] that this is the mean ED for adult males and females weighing 70 ± 3 kg. For the selected diagnostic radiologic procedure (following the standard protocol with a typical operation mode of the system used), the standard ED70 kg (mSv) and the standard ED80 kg (mSv) were calculated by approximating the data for each of the three scan areas (head, chest, and abdomen + pelvis) using linear ED–weight functions by the following regression equation:
ED (mSv) = a + b × W (rg), (2)
where ED is the effective dose (mSv) received by the patient; a and b are regression coefficients; and W is the patient’s body weight (kg).
The values of coefficients a and b were calculated using STATISTICA for each scan area (head, chest, and abdomen + pelvis) in Site 1 and Site 2 for SP-CT and MP-CT. Then, the standard ED70 kg (for a typical patient weighing 70 kg) and the standard ED80 kg (for a typical patient weighing 80 kg) were calculated using equation (2) for W = 70 kg and W = 80 kg, respectively.
RESULTS
Study Subjects
Statistical analysis included finding 323 CT scans (137 men and 186 women aged 17–93). CT was performed according to standard protocols. A total of 209 SP-CT scans and 114 MP-CT scans were analyzed.
As shown in Table 1, the groups were generally well-balanced by age, sex, and body weight, which varied from 42 to 129 kg.
Primary Study Outcomes
In the first stage of the study, mean radiation exposure parameters (CTDIvol, DLPs, and the ED per CT scan) were determined for the SP-CT and MP-CT of the head, chest, and abdomen and pelvis, respectively (Table 2). The mean patient ED per one SP-CT scan and one MP-CT scan was 1.8–2.0 mSv and 2.4–4.6 mSv for the head, 2.4–5.3 mSv and 7.9–8.4 mSv for the chest, and 7.5–8.2 mSv and 27.4–33.0 mSv for the abdomen + pelvis, respectively.
Table 2. Radiation doses for SP-CT and MP-CT of the head, chest, and abdomen and pelvis at Site 1 and Site 2
Parameters | Region of interest | One-phase CT | Multiphase CT | ||
Site 1 | Site 2 | Site 1 | Site 2 | ||
ED per CT, M ± m, mSv | Head | 1.8±0.1 | 2.0±0.03 | 2.4±0.3 | 4.6±0.3* |
Chest | 5.3±0.5 | 2.4±0.2* | 7.9±1.7 | 8.4±0.7 | |
Abdomen + pelvis | 7.5±1.1 | 8.2±0.7 | 33.0±1.8 | 27.4±2.4 | |
DLP, М ± m, mGy × cm | Head | 771.9±38.8 | 899.2±10.8 | 1033.3±109.8 | 1988.7±131.1* |
Chest | 309.1±30.6 | 141.9±10.6* | 466.9±97.6 | 494.3±48.4 | |
Abdomen + pelvis | 449.0±67.3 | 491.1±51.9 | 1964.1±108.2 | 1623.7±144.4 | |
CTDIvol, М ± m, mGy | Head | 40.1±1.4 | 51.5±1.0* | - | - |
Chest | 8.3±0.9 | 3.8±0.3* | - | - | |
Abdomen + pelvis | 9.4±1.5 | 13.7±1.1* | - | - | |
Number of phases per CT, M ± m | Head | 1 | 1 | 2.1±0.1 | 2.5±0.2 |
Chest | 1 | 1 | 1.4±0.2 | 2.0±0 | |
Abdomen + pelvis | 1 | 1 | 3.8±0.1 | 3.8±0.1 | |
Note. * Differences in means for this CT region between Site 1 and Site 2 (p ≤ 0.05). CT: computed tomography; ED: effective dose.
As shown in Table 1, the mean weight of Site 1 and Site 2 groups differed insignificantly, except for the SP-CT of the abdomen + pelvis (75.5 ± 2.0 kg and 83.1 ± 3.5 kg, respectively) and the MP-CT of the chest (75.5 ± 5.0 kg and 91.6 ± 3.2 kg, respectively).
In the second stage of the study, a correlation analysis was performed to establish the ED–weight relationship. The correlation coefficients were 0.66–0.70 and 0.59–0.68 for SP-CT and MP-CT, respectively. For abdomen + pelvis, the correlation coefficients were 0.37 and 0.59 for SP-CT and MP-CT, respectively. For the head, the correlation coefficients were extremely low: 0.05–0.09 and 0.11–0.18 for SP-CT and MP-CT, respectively.
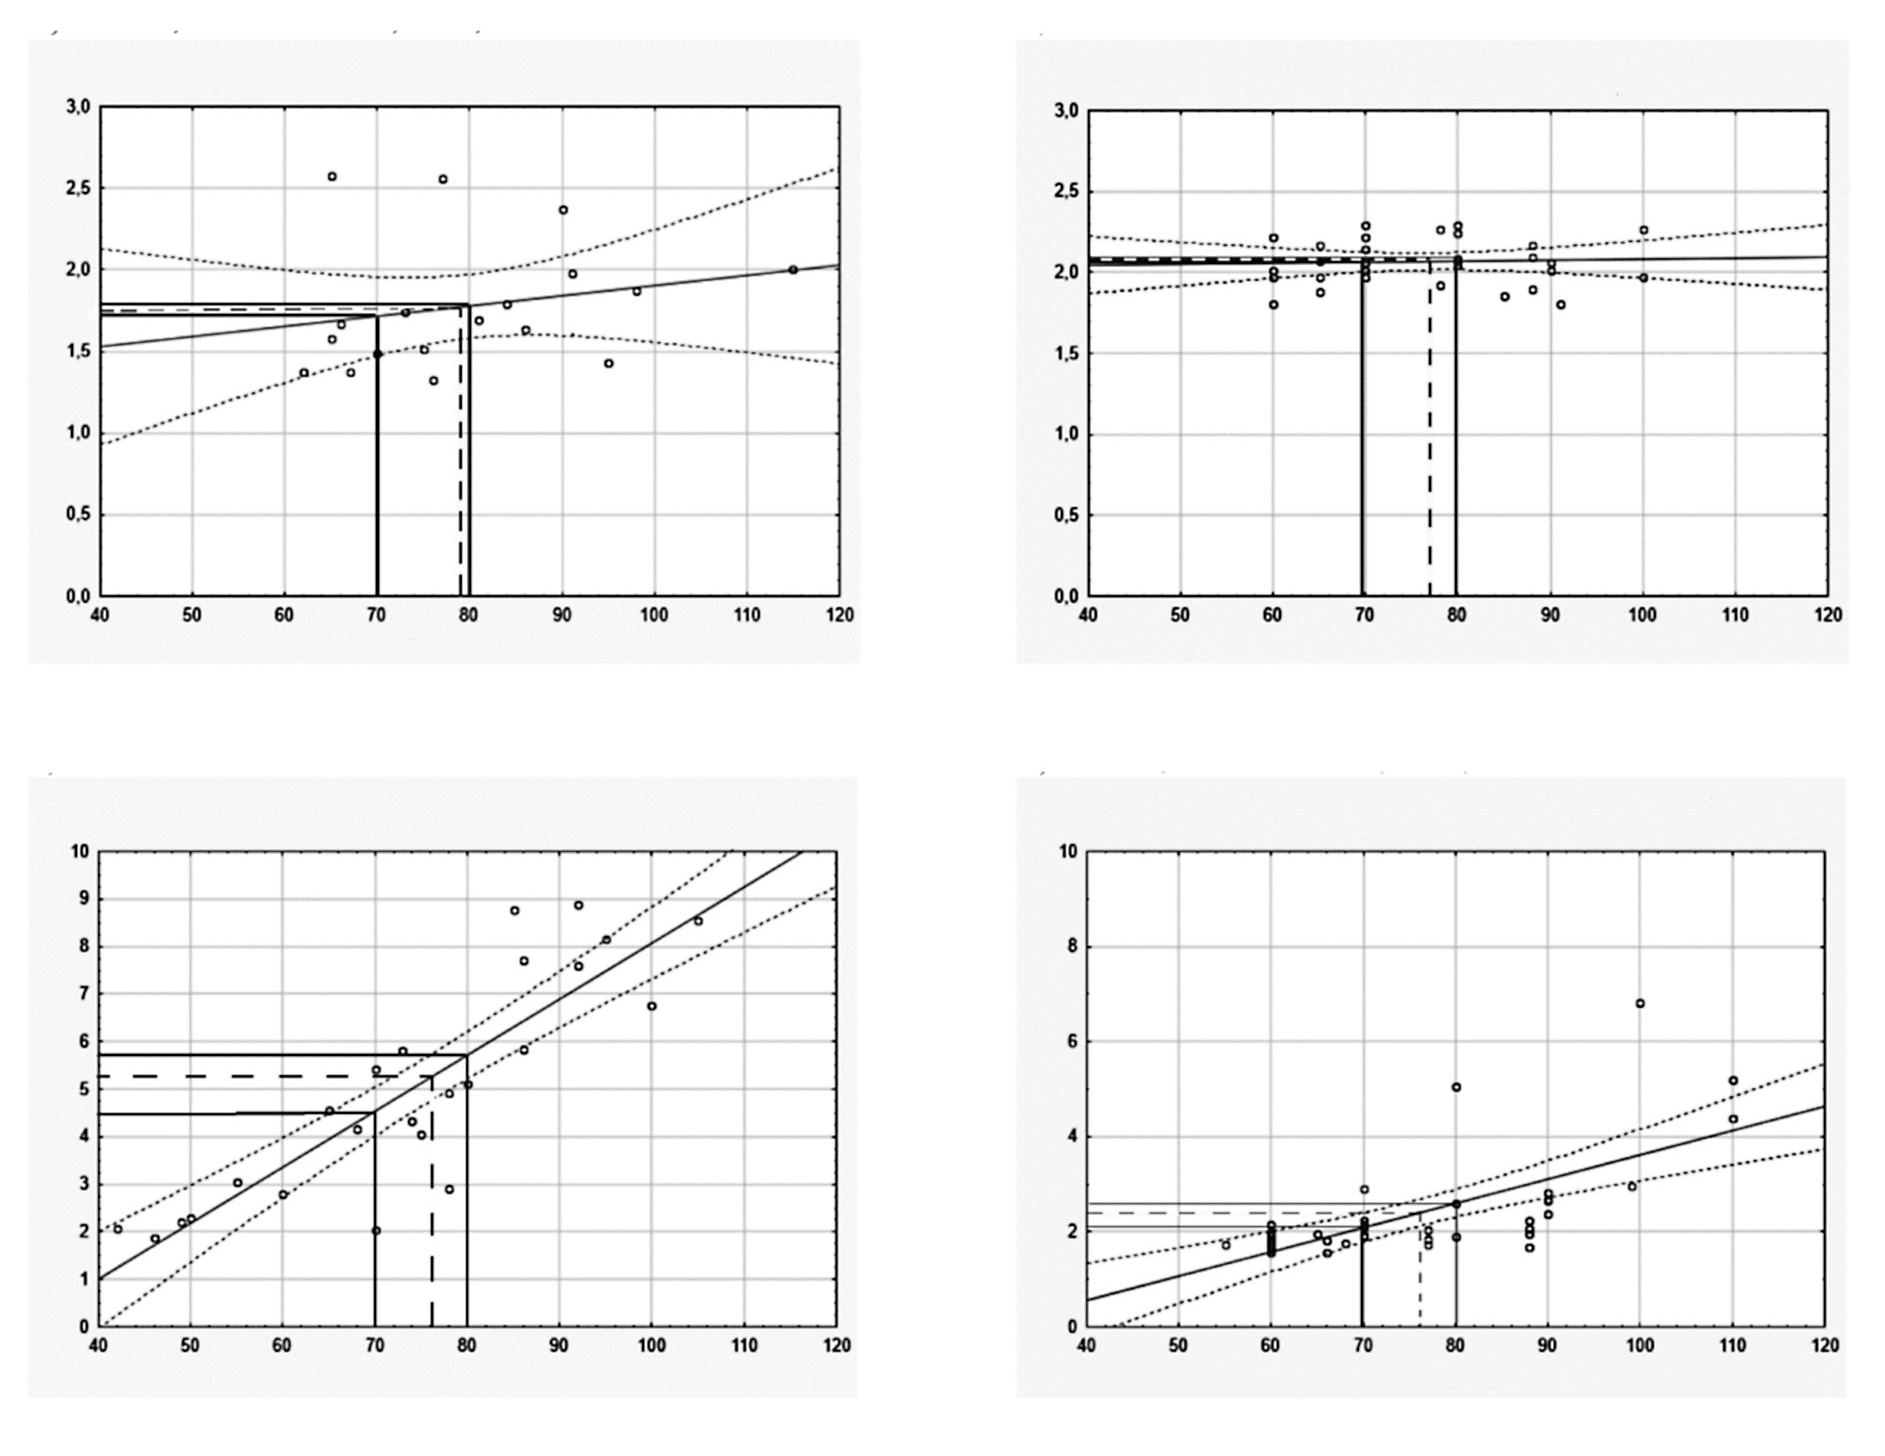
In the third stage of the study, the median ED (Me [25th, 75th]) and DRLs (ED75th) were calculated (see Table 3). For each scan area, the standard EDs were calculated using a dose–weight regression function for patients weighing 70 kg and 80 kg during SP-CT and MP-CT scans (Figures 1 and 2).

Figure 1. Regression analysis of the ED–weight relationship in SP-CT of the head, chest, and abdomen + pelvis. Y axis: effective dose (mSv); X axis: patient weight (kg).
Legend: A solid line is a regression line with dotted confidence intervals; p = 0.95, solid perpendicular lines for standard ED70 kg and standard ED80 kg (mSv), calculated for a patient weighing 70/80 kg; dashed lines for the mean ED (mSv) corresponding to the mean body weight in the group.
CT: computed tomography; ED: effective dose.

Figure 2. Regression analysis of the ED–weight relationship in MP-CT of the head, chest, and abdomen + pelvis (dotted lines are confidence intervals; p = 0.95). Y axis: effective dose (mSv); X axis: patient weight (kg).
Legend: A solid line is a regression line with dotted confidence intervals; p = 0.95, solid perpendicular lines for standard ED70 kg and standard ED80 kg (mSv), calculated for a patient weighing 70/80 kg; dashed lines for the mean ED (mSv) corresponding to the mean body weight in the group.
CT: computed tomography; ED: effective dose.
We compared the mean ED, the median ED, and DRLs (ED75th) with standard EDs for these groups (see Table 3). There are no significant differences in the mean ED, median ED, and DRLs (ED75th) compared to the standard ED for the head CT. No correlation with weight was revealed, and these parameters were 1.7–1.9 mSv for Site 1 and 2.1–2.2 mSv for Site 2.
Table 3. Effective doses (mSv) for SP-CT and MP-CT of the head. chest. and abdomen and pelvis
Region of interest | Mean ED | Median ED (Me [25th. 75th]) | DRLs (ED75 th) | Standard ED70 kg* | Standard ED80 kg** | |||||
Site 1 | Site 2 | Site 1 | Site 2 | Site 1 | Site 2 | Site 1 | Site 2 | Site 1 | Site 2 | |
SP-CT | ||||||||||
Head | 1.8±0.1 | 2.1±0.03 | 1.7 [1.5; 1.9] | 2.1 [2.0; 2.2] | 1.9 | 2.2 | 1.72 | 2.06 | 1.78 | 2.07 |
Chest | 5.3±0.4 | 2.4±0.2 | 4.9 [2.9; 7.6] | 1.9 [1.8; 2.4] | 7.6 | 2.4 | 4.53 | 2.09 | 5.71 | 2.60 |
Abdomen + pelvis | 7.5±1.1 | 8.2±0.7 | 6.5 [5.8; 8.4] | 10.3 [4.4; 10.8] | 8.4 | 10.8 | 7.19 | 5.89 | 7.83 | 7.63 |
MP-CT | ||||||||||
Head | 2.4±0.3 | 4.6±0.3 | 2.2 [2.0; 2.3] | 4.6 [4.0; 5.4] | 2.3 | 5.4 | 1.94 | 3.61 | 2.33 | 3.77 |
Chest | 7.9±1.7 | 8.4±0.7 | 6.2 [4.4; 10.0] | 8.9 [5.5; 11.0] | 10.0 | 11.0 | 6.55 | 5.28 | 9.09 | 6.74 |
Abdomen + pelvis | 33.0±1.8 | 27.4±2.4 | 31.4 [27.1; 35.7] | 26.6 [17.9; 40.1] | 35.7 | 40.1 | 29.99 | 21.63 | 33.11 | 26.91 |
Note. * Standard ED70 kg (ED for a typical patient of 70 kg) is calculated using the regression equation: ED70 kg (mSv) = a + b × W (kg) for W = 70 kg; "a" and "b" are from the equations in Fig. 3. a–f (SP-CT) and Fig. 4. a–f (MP-CT). ** Standard ED80 kg (ED for a typical patient of 80 kg) is calculated using the regression equation: ED80 kg (mSv) = a + b × W (kg) for W = 80 kg; "a" and "b" are from the equations in Fig. 3. a–f (SP-CT) and Fig. 4. a–f (MP-CT). Differences in mean ED. median ED. and DRLs between Site 1 and Site 2 are highlighted in bold and are oppositely directed with differences in Standard ED70 kg between these sites. CT: computed tomography; ED: effective dose.
For other scan areas, the weight of patients is important for assessing EDs. If mean weights are similar (e.g., 76.1 ± 4.0 kg and 76.3 ± 2.3 kg for SP-CT scans of the chest at Site 1 and Site 2, respectively), differences in the mean ED, the median ED, DRLs (ED75th), and standard EDs are unidirectional: all ED values at Site 1 were 2.2–3.2-fold higher than those at Site 2.
For the SP-CT scans of abdomen + pelvis, the mean patient weight (83.1 kg) at Site 2 exceeded that at Site 1 (75.5 kg), so the mean ED was slightly higher for Site 2 (8.2 ± 0.7 mSv) than for Site 1 (7.5 ± 1.1 mSv), and DRLs (ED75th) where higher for Site 2 (10.8 mSv) than for Site 1 (8.4 mSv). At the same time, the calculated standard ED70 kg was lower for Site 2 (5.89 mSv) than for Site 1 (7.19 mSv).
For the MP-CT scans of the chest, the mean patient weight was heavier for Site 2 (91.6 kg) than for Site 1 (75.5 kg), so the mean ED was slightly higher for Site 2 (8.4 ± 0.7 mSv) than for Site 1 (7.9 ± 1.7 mSv). The DRL (ED75th) was slightly higher for Site 2 (11.0 mSv) than for Site 1 (10.0 mSv). At the same time, the calculated standard ED70 kg was lower for Site 2 (5.28 mSv) than for Site 1 (6.55 mSv).
The DRL (ED75th) depends not only on the weight but also on the abnormal values of the radiation dose of each patient. Therefore, in the group of MP-CT of abdomen + pelvis, the mean patient weights at Site 1 and Site 2 were similar (79.7 ± 2.9 kg and 80.7 ± 2.7 kg, respectively), but in 5 patients at Site 1, the ED values were abnormal and exceeded 45 mSv (see Fig. 2,e), so the 75th quantiles of the ED or DRLs (ED75th) were higher at Site 2 (40.1 mSv) than at Site 1 (35.7 mSv). At the same time, the standard ED70 kg values were 29.99 mSv and 21.63 mSv for Site 1 and Site 2, respectively.
Additional Findings
These data allowed us to determine that the mean weight in both groups approached 80 kg (see Table 1), which is related to the many patients weighing approximately 80 kg in almost all groups. Therefore, the mean ED and DRLs (ED75th) in these groups always exceeded the standard ED70 kg and were closer to the standard ED80 kg (see Table 3). We believe that for our population, a reasonable approach is to consider the standard ED80 kg instead of the standard ED70 kg as a criterion for assessing the ED since the standard ED80 kg better reflects the body weight distribution in our population due to recent anthropological changes. At the same time, if the mean weight in both groups approaches the standard weight of 80 kg, the corresponding mean EDs can be used to compare the EDs of different computed tomographs.
DISCUSSION
Summary of the Primary Study Outcome
The primary goal of our study was to substantiate the importance of calculating the standard EDs in CT scans for a more accurate calculation of the patient exposure levels in different medical and diagnostic organizations since the compared groups can differ significantly in body weight. The correlation analysis shows that a higher mean weight is associated with a higher mean radiation dose. DRLs reflect the 75th quantile of radiation doses and are proportional to the mean patient weights of the groups, which prevents using DRLs for a correct comparison of patient exposure doses in these organizations in the case of a significant difference in mean weights between groups.
Our correlation analysis showed that the radiation dose tended to increase proportionally with patient weight during SP-CT and MP-CT scans of the chest (see Figure 1, c, d; Figure 2, c, d) and abdomen + pelvis (see Figure 1, e, f; Figure 2, e, f). The highest CT dose correlation with patient weight was established for the chest (0.59–0.70) and abdomen + pelvis (0.37–0.59), and the lowest correlation was established for head CT (0.05–0.18) (see Figure 1, а, b; Figure 2, а, b). The calculated correlation coefficients were consistent with the relative weight of human body segments [11–14]. The upper body weight, middle body weight, lower body weight, and head weight were 15.9%, 16.3%, 11.2%, and 6.9%, respectively.
The ED–weight relationship is associated with the design features of the sensors and automatic current regulation in the CT scanner tube. This association means that comparing the mean EDs and median EDs obtained in different medical organizations is inappropriate if mean weights significantly differ in the compared patient groups. Therefore, our study shows that for such comparisons, a more appropriate approach is to calculate and compare the standard ED70 kg or standard ED80 kg values of the groups.
Discussion of the Primary Study Outcome
Many studies evaluate the problem of assessing the CT radiation dose. As a criterion for optimized patient protection during diagnostic and interventional procedures, a DRL has been established [7]. Since its introduction by the ICRP in 1996, the concept of DRLs has been constantly evolving [2, 6, 7]. The ICRP currently recommends estimating the median radiation dose per treatment for each subject included in a study [7]. National DRLs should be set as the 75th percentile of the median DLP or ED values obtained in a sample of representative centers. However, this guideline neglects possible differences in doses due to the different body weights of patients in the groups compared.
DRLs for the same CT area are known to be subject to great variability, which makes it difficult to compare them correctly. Therefore, in a review study [15], a 2–3-fold difference was reported for DRLs obtained for the same procedure in different studies. However, these differences are related to study design, scanning technology, and the use of different exposure parameters and different dose indices. No consensus has been reached on this issue. One study [16] assessed patient, equipment, and organization factors affecting the CT radiation dose. Patient size (in terms of T-shirt size), site-specific protocols, and multiphase scanning were found to be the most important predictors of dose (R2 8–32%), followed by the equipment manufacturer and iterative reconstruction (R2 0.2–15.0%). Another study [17] showed that CT radiation doses vary widely across countries, but the authors supposed that this variation was related primarily to the local choice of technical CT parameters and was unrelated to the characteristics of the patient, organization, or equipment.
The issue of calculating the standard ED is becoming increasingly important because of the constantly evolving criteria for assessing the radiation dose in various medical organizations. Therefore, international documents [4, 7] indicate that DRLs should be standardized, i.e. they should be given, as much as possible, for a “typical-size patient” for each type of CT scan considering that the “standard dose is the mean dose for adult patients of both sexes weighing 70 ± 3 kg during the selected radiological procedure using a typical mode of operation of the system used with a typical protocol” [4, 8, 10]. The selected mean weight should be near the mean weight in the population considered, and for some countries, an average patient weight of 70 ± 10 kg may be acceptable [7]. However, in practice, medical organizations calculate DRLs using the mean or median values of the radiation dose of the general population, without considering the size and weight of patients.
Only a few authors considered “patient size” for these analyses: For example, A.J. van der Molen et al. [18] provided doses for a “typical-size patient” (height 1.74 m, weight 77 kg, BMI 25.4 kg/m2 ± 15%) or a patient weighing 70 ± 15 kg [19]. A smaller scatter of data can be assumed, and the comparison of DRLs would be more correct if standard radiation doses for a “typical patient” weighing 70 kg or 80 kg were compared instead of mean or median doses. This calculation method should be used by all medical organizations.
The analysis (Table 4) showed that in different countries, SP-CT ED (mSv) for the studied areas could differ several times, and in different studies, it was 1.5–2.3 mSv for head CT, 4.0–7 .9 mSv for chest CT, 2.4–10.0 mSv for abdomen CT, and 4.1–11.7 mSv for abdomen + pelvis CT. For MP-CT of the studied areas, the ED largely depended on the number of stages of the study and differed to a greater extent: 5.1–9.5 mSv for head CT, 3.6–23.1 mSv for abdomen CT, and 6.3–24.5 for abdomen + pelvis CT. In our study, for a patient of standard weight (70 kg), the calculated standard EDs for SP-CT and MP-CT at Site 1 and Site 2 were comparable to the mean or median EDs for head and chest CT in other studies and slightly exceeded EDs for MP-CT of abdomen + pelvis (see Table 4).
Table 4. Effective doses for CT of the head, chest, and abdomen and pelvis
ED parameters | ED (mSv) for CT regionsa, b | Country | |||
Head | Chest | Abdomen | Abdomen + pelvis | ||
Median | 1.5/- | 4.0/5.1 | 2.4/3.6 | 4.4/6.3–13.3 | Australia [20] |
Mean | 2.0 (n=50) [21]; 1.99 [22] | 4.99 (n=43) [23]; 9.84 [22] | 10.44 (n=43) [23] | 11.7 [22] | Canada [21–23] |
Mean | - | 7.9–9.5 (n=81) [24] | - | 6.15 (n=85) [25] | |
Mean | 2.1–4.2 | 2.9–5.2 | 3.3–7.3 | 4.1–9.2 | Germany [26] |
Mean | 1.2 | 5.9 | 8.2 | - | Greece [27] |
Mean | - | 6.04 (n=50) | 6.89 (n=51) | - | India [23] |
Median | 2.3 (n=26 965) | 4.6 (n=6542) | - | 9.7 (n=1692) | Italy [28] |
Mean | - | - | 7.7/23.1 (n=44) [29] | 8.0 (n=447) [30] | |
Median, only typical patients (1.74 m, 77 kg, BMI 25,4 kg/m2±15%) | 1.5 | 4.6 | 8/13.2–19.4 | - | The Netherlands [18] |
Mean | 1.21 (n=52) | 7.60 (n=38) | 8.25 (n=54) | - | Poland [23] |
Median, patient weighing 70±15 kg | - | 5.4 (chest. n=39) | –/8.1 (appendicitis. n=100) | –/24.5 (Abdomen CT for liver and abdominal metastases in colorectal cancer. n=40) | Qatar [19] |
Standard ED70kg | 1.7/1.9 (n=18/n=14) | 4.5/6.6 (n=25/n=11) | - | 7.2/30.0 (n=75/n=30) | Russia, this study, Site 1c |
Standard ED70kg | 2.1/3.6 (n=32/n=8) | 2.1/5.3 (n=38/n=27) | - | 5.9/21.6 (n=21/n=24) | Russia, this study, Site 2d |
Mean | 0.89 (n=36) | 4.20 (n=32) | 6.03 (n=66) | - | Thailand [23] |
Mean (n=340) | 1.36/1.79 | 4.34 | - | 11.6/13.26 | UAE [31] |
Mean | 1.66 (n=10) [23] | 3.45 (n=30) [23] | 2.4–6.04/ 8.4–15.33 [32] | 6.69 (n=25) [23] | |
Mean | 2 | 7 | 7.3-8.0/15 | 10 | |
Mean | 2.7 | 5.8 | 22.3 | - | Ethiopia [35] |
Median | 2.1 | 4.4 | 6.8 | - | Turkey [36] |
Note. n: number of findings. BMI: body mass index; CT: computed tomography; ED: effective dose.
a KDLP ED (mSv × mGy−1 × cm−1) [4]: head 0.0023, chest 0.017, abdomen 0.015, pelvis 0.019; b SP-CT/MP-CT; c Site 1, GE Discovery CT750 HD, 64-slice; d Site 2, Toshiba Aquilion Prime, 80-slice.
Our data were confirmed by the results of other studies. Therefore, data stratification by two subgroups (non-overweight and overweight) allowed a better optimization of CT doses and the ability to set DRLs based on the BMI category [37].
Other authors [38] compared the volumetric CT dose index (CTDIvol), dose–length product (DLP), and size-specific dose estimate (SSDE) for adult chest CT with the 2017 Chinese DRLs. Patients were divided into four groups depending on the water equivalent diameter of the chest (Dw). CTDIvol, DLP, and SSDE were found to increase in proportion to Dw.
The effect of patient size on the CT radiation dose has also been studied [39]. On the basis of the effective diameter estimated from adult body CT scans, each CT scan was classified by T-shirt size as XXS, XS, S, M, L, XL, and XXL. The radiation dose rates were compared for each size and type of CT scan, and the CTDIvol values were established for XXS (~60%), XS (~65%), S (~75%), M (100%), L (~130%), XL (~165%), and XXL (~210%). Thus, younger patients (XXS) received 60% of the dose compared to M patients, and XXL patients required doubling the dose (~210%). The authors considered this new approach, expressing body measurements in terms of T-shirt sizes, to be simple enough as a tool to demonstrate differences in doses between patients of different body types. However, in our opinion, this approach only applies to chest CT. Moreover, the body weight more accurately reflects the individual characteristics of the patient’s body than the T-shirt size.
Study Limitations
One study limitation was the possibility of also using an SSDE concept to consider the patient size when monitoring radiation doses during CT scans. However, the SSDE uses only corrections based on the geometric dimensions of the patient, including linear dimensions determined by measuring the patient or using their images [7]. The SSDE concept is designed to adjust the standard parameters of the CT protocol depending on the CT area size (effective diameter of the scan area) to minimize the absorbed radiation dose (mGy) [40], but it neglects the patient’s weight, and it is not intended to assess the ED (mSv) and the risks of long-term radiation consequences.
Therefore, the SSDE is currently not considered a suitable criterion for use as DRLs [7]. This viewpoint is supported by a systematic review [15] of 54 scientific articles, which showed a low prevalence of the SSDE. CTDIvol and/or DLP were the most commonly used criteria for assessing radiation doses (87% of studies), while DLP+SSDE was used only in 1% of studies [15]. Usually, SSDE was used to model the dose during chest CT and document the results of dose reduction strategies for a particular (particularly pediatric) patient [41–43].
Another study limitation was using different approaches to calculate standard EDs. In our study, we used a linear approximation method (formula 2) to assess the relationship between the dose and the body weight of patients (linear regression equations). The regression analysis allowed regression coefficients to be established for the dose–weight relationship of each CT area of Site 1 and Site 2. These coefficients were used to calculate the standard ED70 kg and the standard ED80 kg for a typical patient weighing 70 kg and 80 kg, respectively (see Table 3).
A nonlinear model (power function) can also be used to describe the relationship between the CT radiation dose and patient size or weight for specific body areas. For example, in a report [23] on abdominal CT, a linear function was used to calculate the relationship between the normalized noise and the body mass index, and a power function was used to calculate the relationship between the normalized noise and the patient’s anteroposterior diameter.
However, we believe the linear approximation method to be a more acceptable option for practical radiologists. If each hospital uses its own model for the nonlinear approximation of the ED–weight relationship, the result is different mathematical relationships and an additional nonsystematic error when comparing such standard EDs. Therefore, we consider using the linear regression acceptable for the routine practice of radiologists as a uniform method for this approximation.
Our conclusion is consistent with [23]: “...the best correlation between normalized noise and patient size was obtained using effective patient diameters and a power function.” However, in practice, determining anteroposterior and lateral diameters (which are necessary to calculate the effective diameter) can be more logistically complex than weighing the patient. Because of this complexity, the weight of the patient was used [23] because of the simplicity of measuring this parameter compared to measuring the above diameters as well as to use the available acceptable linear correlation, rather than the power function that is more difficult to calculate.
Therefore, the national DRLs are currently set as the 75th percentile of the median patient doses established in a sample of representative centers [7]. If the DRL in a medical organization exceeds the regional level, this is a reason to analyze the CT technique parameters (tube voltage, scan area length, and other parameters of the CT protocol) to find ways to reduce it. However, this excess may be related to not only the technical CT parameters but also the larger mean weight of patients in a medical organization. For a correct comparison of the dose load in groups of patients with significant differences in mean weights, we recommend using the standard ED70 kg or standard ED80 kg calculated for the groups compared. Even with significant differences in the mean weights of patients, if the standard ED is higher at Site 1 than at Site 2, it can be safely assumed that this excess is related not to patient weight but to the characteristics of CT scanners and scanning protocols. Thus, to reduce the dose, these parameters should be modified.
Therefore, methods for calculating DRLs are constantly being improved [44–48], and the results obtained are important for establishing the correct DRLs of patient radiation exposure. In the future, the standard ED can be used to calculate DRLs for CT scanners in different regions of the country, but this action would require reporting the patient’s body weight in each CT protocol.
Because of the dramatic increase in the number of CT scans, using DRLs not exceeding levels set by standard EDs will reduce the long-term CT consequences, including cancer [49–51]. In public healthcare, measures must be taken to control the radiation dose [44, 45, 52, 53] and meet the goals of cooperation with EUROSAFE international projects.
In practice, the method described can be used to assess the standard ED of each body area and compare the CT EDs using two sites and two CT scanners with the typical patient weight considered. Standard EDs must be calculated an analyzed for each body area (not just the mean ED, the median ED, and the 75th quantile of the ED) to help in more correctly comparing radiation exposure in different medical organizations and more accurately establishing factors for exceeding regional or national DRLs.
CONCLUSION
Effective radiation CT doses are proportional to the body weight of patients.
In groups of patients with a significant difference in mean weights, a comparison between mean and median radiation doses is inappropriate.
The method is designed for comparing patient exposure doses based on the calculated standard effective doses of two CT areas (the chest and abdomen + pelvis).
ADDITIONAL INFORMATION
Funding source. This study was not supported by any external sources of funding.
Competing interests. The authors declare that they have no competing interests.
Authors’ contribution. All authors made a substantial contribution to the conception of the work, acquisition, analysis, interpretation of data for the work, drafting and revising the work, final approval of the version to be published and agree to be accountable for all aspects of the work. E.I. Matkevich — concept of the study, collection and processing of materials, analysis of the obtained data, design of tables, writing of the text; V.E. Sinitsyn — supervision, analysis of materials and their editing; I.V. Ivanov — study design, preparation of illustrations.
About the authors
Elena I. Matkevich
State Research Center - Burnasyan Federal Medical Biophysical Center of Federal Medical Biological Agency; I.V. Davydovsky City Clinical Hospital
Email: pencil_red@mail.ru
ORCID iD: 0000-0001-5917-7706
SPIN-code: 5546-4830
MD, Cand. Sci. (Med.)
Russian Federation, Moscow; MoscowValentin Е. Sinitsyn
I.V. Davydovsky City Clinical Hospital; Lomonosov Moscow State University
Email: vsini@mail.ru
ORCID iD: 0000-0002-5649-2193
SPIN-code: 8449-6590
MD, Dr. Sci. (Med.), Professor
Russian Federation, Moscow; MoscowIvan V. Ivanov
Sechenov First Moscow State Medical University (Sechenov University); State Scientific-Research Test Institute of Military Medicine
Author for correspondence.
Email: ivanov-iv@yandex.ru
ORCID iD: 0000-0001-7729-2724
SPIN-code: 9888-2780
MD, Dr. Sci. (Med.), Professor
Russian Federation, Moscow; Saint PetersburgReferences
- On the state of sanitary and epidemiological welfare of the population in the Russian Federation in 2021. State report. Available from: https://www.rospotrebnadzor.ru/documents/details.php?ELEMENT_ID=21796. Accessed: 25.10.2022.
- IAEA [Internet]. Radiation Protection and Safety of Radiation Sources: International Basic Safety Standards, IAEA Safety Standards Series No. GSR Part 3. IAEA, Vienna, 2014. Available from: https://www.iaea.org/publications/8930/radiation-protection-and-safety-of-radiation-sources-international-basic-safety-standards. Accessed: 25.10.2022.
- Recommendations of the International Commission on Radiological Protection. Ann ICRP. 1991;21(1-3):1–201.
- EUR16262 [Internet]. European guidelines on quality criteria in Computed Tomography. Brussels, Belgium: European Commission, Report EUR 16262. 1999. Available from: https://op.europa.eu/da/publication-detail/-/publication/d229c9e1-a967-49de-b169-59ee68605f1a. Accessed: 25.10.2022.
- The 2007 Recommendations of the International Commission on Radiological Protection. ICRP publication 103. Ann ICRP. 2007;37(2-4):1–332. doi: 10.1016/j.icrp.2007.10.003
- Radiation protection in medicine. ICRP Publication 105. Ann ICRP. 2007;37(6):1–63. doi: 10.1016/j.icrp.2008.08.001.
- Diagnostic reference levels in medical imaging. ICRP Publication 135. Ann ICRP. 2017;46(1):1–144. doi: 10.1177/0146645317717209
- Prokop M, Galanski M. Spiral and multislice computed tomography of the body. Vol. 2. Germany: Stuttgard, Verlag KG, cop. 2002.
- Monitoring of the effective doses of patient due to medical x-ray examinations. Changes in Methodical guidelines MU 2.6.1.2944-11. 2.6.1. Ionizing radiation, radiation safety. Available from: https://www.rospotrebnadzor.ru/upload/iblock/71e/mu-2.6.1.3584_19-izmeneniya-v-mu-2.6.1.2944_11.pdf. Accessed: 25.10.2022.
- The application of reference diagnostic levels for optimization of patient’s radiation protection during X-ray examinations of general purpose. Methodological recommendations MR 2.6.1.0066-12. Available from: https://rospotrebnadzor.ru/documents/details.php?ELEMENT_ID=4656. Accessed: 25.10.2022.
- Hinrichs RN. Adjustments to the segment center of mass proportions of Clauser et al. (1969). J Biomech. 1990;23(9):949–951. doi: 10.1016/0021-9290(90)90361-6
- Dubrovsky VI, Fedorova VN. Biomechanics: Textbook. For secondary and higher educational institutions. Moscow: VLADOS-PRESS; 2003. 550 p.
- Ozlib.com [Internet]. Common center of mass, common center of gravity, geometry of masses, anthropometry. In: Biomechanics. Knowledge of body-motor exercises. 2013. Available from: https://ozlib.com/801945/sport/obschiy_tsentr_mass_obschiy_tsentr_tyazhesti_geometriya_mass_antropometriya. Accessed: 25.10.2022.
- Helpiks.org [Internet]. Distribution of mass in the human body. Available from: https://helpiks.org/6-6110.html. Accessed: 25.10.2022.
- Garba I, Zarb F, McEntee MF, Fabri SG. Computed tomography diagnostic reference levels for adult brain, chest and abdominal examinations: a systematic review. Radiography (Lond). 2021;27(2):673–681. doi: 10.1016/j.radi.2020.08.011
- Smith-Bindman R, Wang Y, Yellen-Nelson TR, et al. Predictors of CT radiation dose and their effect on patient care: a comprehensive analysis using automated data. Radiology. 2017;282(1):182–193. doi: 10.1148/radiol.2016151391
- Smith-Bindman R, Wang Y, Chu P, et al. International variation in radiation dose for computed tomography examinations: prospective cohort study. BMJ. 2019;(364):k4931. doi: 10.1136/bmj.k4931
- Van der Molen AJ, Schilham A, Stoop P, et al. A national survey on radiation dose in CT in The Netherlands. Insights Imaging. 2013;4(3):383–390. doi: 10.1007/s13244-013-0253-9
- Al Naemi H, Tsapaki V, Omar AJ, et al. Towards establishment of diagnostic reference levels based on clinical indication in the state of Qatar. Eur J Radiol Open. 2020;7:100282. doi: 10.1016/j.ejro.2020.100282
- Heggie JC. Patient doses in multi-slice CT and the importance of optimisation. Australas Phys Eng Sci Med. 2005;28(2):86–96. doi: 10.1007/BF03178698
- Rivers-Bowerman MD, Shiva Shankar JJ. Iterative reconstruction for head CT: Effects on radiation dose and image quality. Can J Neurol Sci. 2014;41(5):620–625. doi: 10.1017/cjn.2014.11
- MacGregor K, Li I, Dowdell T, Gray BG. Identifying institutional diagnostic reference levels for CT with radiation dose index monitoring software. Radiology. 2015;276(2):507–517. doi: 10.1148/radiol.2015141520
- IAEA-TECDOC-1621 [Internet]. Dose Reduction in CT while Maintaining Diagnostic Confidence: A Feasibility/Demonstration Study. IAEA, Vienna; 2009. Available from: https://www-pub.iaea.org/MTCD/Publications/PDF/te_1621_web.pdf. Accessed: 25.10.2022.
- Qi LP, Li Y, Tang L, Li YL, et al. Evaluation of dose reduction and image quality in chest CT using adaptive statistical iterative reconstruction with the same group of patients. Br J Radiol. 2012;85(1018):e906–e911. doi: 10.1259/bjr/66327067
- Yasaka K, Katsura M, Akahane M, et al. Model-based iterative reconstruction for reduction of radiation dose in abdominopelvic CT: Comparison to adaptive statistical iterative reconstruction. Springerplus. 2013;2(1):209. doi: 10.1186/2193-1801-2-209
- Hofer M. CT teaching manual: a systematic approach to CT reading. Thieme; 2005. 208 p.
- Tsapaki V, Aldrich JE, Sharma R, et al. Dose reduction in CT while maintaining diagnostic confidence: Diagnostic reference levels at routine head, chest, and abdominal CT-IAEA-coordinated research project. Radiology. 2006;240(3):828–834. doi: 10.1148/radiol.2403050993
- Calderoni F, Campanaro F, Colombo PE, et al. Analysis of a multicentre cloud-based CT dosimetric database: Preliminary results. Eur Radiol Exp. 2019;3(1):27. doi: 10.1186/s41747-019-0105-6
- Shin HJ, Chung YE, Lee YH, et al. Radiation dose reduction via sinogram affirmed iterative reconstruction and automatic tube voltage modulation (CARE kV) in abdominal CT. Korean J Radiol. 2013;14(6):886–893. doi: 10.3348/kjr.2013.14.6.886
- Kim K, Kim YH, Kim SY, et al. Low-dose abdominal CT for evaluating suspected appendicitis. N Engl J Med. 2012;366(17):1596–1605. doi: 10.1056/NEJMoa1110734
- Abuzaid MM, Elshami W, Tekin HO et al. Computed tomography radiation doses for common computed tomography examinations: a nationwide dose survey in United Arab Emirates. Insights Imaging 11, 88 (2020). https://doi.org/10.1186/s13244-020-00891-6
- Shrimpton PC, Hillier MC, Lewis MA, Dunn M. National survey of doses from CT in the UK: 2003. Br J Radiol. 2006;79(948):968–980. doi: 10.1259/bjr/93277434
- Mettler F, Huda W, Yoshizumi T, Mahesh M. Effective doses in radiology and diagnostic nuclear medicine: A catalog. Radiology. 2008;248(1):254–263. doi: 10.1148/radiol.2481071451
- Pickhardt PJ, Lubner MG, Kim DH, et al. Abdominal CT with model-based iterative reconstruction (MBIR): Initial results of a prospective trial comparing ultralow-dose with standard-dose imaging. Am J Roentgenol. 2012;199(6):1266–1274. doi: 10.2214/AJR.12.9382
- Zewdu M, Kadir E, Tesfaye M, Berhane M. Establishing local diagnostic reference levels for routine computed tomography examinations in JIMMA university medical center south West Ethiopia. Radiat Prot Dosimetry. 2021;193(3-4):200–206. doi: 10.1093/rpd/ncab028
- Atlı E, Uyanık SA, Öğüşlü U, et al. Radiation doses from head, neck, chest and abdominal CT examinations: An institutional dose report. Diagn Interv Radiol. 2021;27(1):147–151. doi: 10.5152/dir.2020.19560
- Brat H, Zanca F, Montandon S, et al. Local clinical diagnostic reference levels for chest and abdomen CT examinations in adults as a function of body mass index and clinical indication: A prospective multicenter study. Eur Radiol. 2019;29(12):6794–6804. doi: 10.1007/s00330-019-06257-x
- Hu X, Gou J, Lin W, et al. Size-specific dose estimates of adult, chest computed tomography examinations: Comparison of Chinese and updated 2017 American College of Radiology diagnostic reference levels based on the water-equivalent diameter. PLoS One. 2021;16(9):e0257294. doi: 10.1371/journal.pone.0257294
- Li X, Steigerwalt D, Rehani M. T-shirt size as a classification for body habitus in computed tomography (CT) and development of size-based dose reference levels for different indications. Eur J Radiol. 2022;151(3):110289. doi: 10.1016/j.ejrad.2022.110289
- Westra SJ, Li X, Gulat K, et al. Entrance skin dosimetry and size-specific dose estimatefrom pediatric chest CTA. J Cardiovasc Comput Tomogr. 2014;8(2):97–107. doi: 10.1016/j.jcct.2013.08.002
- Strauss KJ. CT: Size Specific Dose Estimate (SSDE): Why We Need Another CT Dose Index. Clinical Imaging Physicist Cincinnati Children’s Hospital University of Cincinnati College of Medicine. In: Boone J, McCollough C, McNitt-Grey M, et al. Acknowledgements. Available from: https://docplayer.net/20784880-Ct-size-specific-dose-estimate-ssde-why-we-need-another-ct-dose-index-acknowledgements.html. Accessed: 25.10.2022.
- Özsoykal İ, Yurt A, Akgüngör K. Size-specific dose estimates in chest, abdomen, and pelvis CT examinations of pediatric patients. Diagn Interv Radiol. 2018;24(4):243–248. doi: 10.5152/dir.2018.17450
- Lyra M, Rouchota M, Michalitsi M, Boultadaki A. Effective dose and size-specific dose estimate (SSDE) of the torso: In low dose MDCT protocol in multiple myeloma. Radiol Diagn Imaging. 2019. doi: 10.15761/RDI.1000146
- Matkevich EI, Sinitsyn VE, Ivanov IV. Health prediction indices obtained with low-dose computer tomography scans. Aviakosm Ekolog Med. 2015;49(6):61–67. (In Russ).
- The use of reference diagnostic levels for adult patients in radiation diagnostics. Methodological recommendations. Moscow; 2020. 38 р. (In Russ).
- Damilakis J, Vassileva J. The growing potential of diagnostic reference levels as a dynamic tool for dose optimization. Physica Medica. 2021;84:285–287. doi: 10.1016/j.ejmp.2021.03.018
- Moghadam N, Lecomte R, Mercure S, et al. Simplified size adjusted dose reference levels for adult CT examinations: A regional study. Eur J Radiol. 2021;142:109861. doi: 10.1016/j.ejrad.2021.109861
- Almén A, Guðjónsdóttir J, Heimland N, et al. Establishing paediatric diagnostic reference levels using reference curves: A feasibility study including conventional and CT examinations. Phys Med. 2021;87:65–72. doi: 10.1016/j.ejmp.2021.05.035
- Smith-Bindman R, Lipson J, Marcus R, et al. Radiation dose associated with common computed tomography examinations and the associated lifetime attributable risk of cancer. Arch Intern Med. 2009;169(22):2078–2086. doi: 10.1001/archinternmed.2009.427
- Smith-Bindman R. Environmental causes of breast cancer and radiation from medical imaging: Findings from the institute of medicine report. Arch Intern Med. 2012;172(13):1023–1027. doi: 10.1001/archinternmed.2012.2329
- Linet MS, Slovis TL, Miller DL, et al. Cancer risks associated with external radiation from diagnostic imaging procedures. CA Cancer J Clin. 2012;62(2):75–100. doi: 10.3322/caac.21132
- Golikov VY, Vodovatov AV, Chipiga LA, Shatsky IG. Assessment of radiation risk in patients during medical research in the Russian Federation. Radiation hygiene. 2021;14(3):56–68. (In Russ). doi: 10.21514/1998-426X-2021-14-3-56-68
- Druzhinin YV, Ryzhov SA, Vodovatov AV, et al. The influence of COVID-19 on the dynamics of changes in the dose load on patients during computed tomography in medical organizations in Moscow. Digital Diagnostics. 2022;3(1):5–15. doi: 10.17816/DD87628
Supplementary files

