

")


Possibilities of Dixon sequences in magnetic resonance imaging for fat fraction quantification: a phantom study
- Authors: Panina O.Y.1,2, Gromov A.I.3,4, Ahkmad E.S.1, Semenov D.S.1, Kivasev S.A.5, Petraikin A.V.1, Nechaev V.A.2
-
Affiliations:
- Research and Practical Clinical Center for Diagnostics and Telemedicine Technologies
- Moscow City Hospital named after S.S. Yudin
- Russian University of Medicine
- National Medical Research Radiological Center
- Central Clinical Hospital “RZD-Medicine”
- Issue: Vol 6, No 2 (2025)
- Pages: 191-202
- Section: Original Study Articles
- Submitted: 26.06.2024
- Accepted: 06.12.2024
- Published: 08.07.2025
- URL: https://jdigitaldiagnostics.com/DD/article/view/633802
- DOI: https://doi.org/10.17816/DD633802
- EDN: https://elibrary.ru/WDZWBY
- ID: 633802

Cite item
Full Text

Abstract
BACKGROUND: The accuracy of quantitative parameters obtained using magnetic resonance imaging is of scientific and practical interest. Monitoring of scan parameters and standardization of commonly used approaches to assess fat fraction remain challenging in radiology.
AIM: This study aimed to evaluate the possibility of fat fraction quantification using standard Dixon pulse sequences through phantom modeling.
METHODS: This multicenter, cross-sectional, nonblinded experimental study used direct oil-in-water emulsions to model substances with varying fat concentrations. Test tubes containing these emulsions were placed in a cylindrical phantom. The emulsions were prepared with mixtures of vegetable oils, with fat fraction values of 10%–60%. Several tests were conducted using scanners from different manufacturers and with varying magnetic field strengths: Optima MR450w, 1.5 T; MAGNETOM Skyra, 3 T; Ingenia, 1.5 T; and Ingenia Achieva dStream, 3.0 T at different medical centers. Fat fraction was obtained using standard formulas based on signal intensity measurements. A regression analysis was conducted to assess the linear relationship between the measured and predefined fat fraction concentrations and an F-test to evaluate variability.
RESULTS: Phantom modeling was employed to determine the performance of Dixon pulse sequences across different magnetic resonance imaging scanners for quantitative fat fraction estimation using relevant formulas. In assessing the accuracy of fat fraction quantification, a weak linear correlation was found between the obtained values and predefined fat fraction concentrations. Additionally, significant deviations >5% were observed for certain scanners. Reproducibility analysis demonstrated variability in fat fraction concentration across different scanner models and within the same model.
CONCLUSION: Obtained results confirm that fat fraction quantification using Dixon pulse sequences and relevant formulas should be performed only after preliminary phantom scanning. The use of a phantom ensures adequate quality control and calibration of the magnetic resonance imaging scanner, making accurate quantitative fat measurement more reliable and widely accessible.
Full Text
ОБОСНОВАНИЕ
Отмечают растущий интерес к количественной оценке жировой фракции (Fat Fraction, FF) с помощью магнитно-резонансной томографии (МРТ), компьютерной томографии и ультразвукового исследования, в первую очередь в контексте диагностики стеатоза печени. Количественная оценка FF при МРТ, как правило, реализуется с использованием диксоновских (DIXON) последовательностей, которые входят в стандартный функционал большинства современных томографов. Их преимуществом является не только возможность точного разграничения сигналов от воды и жира, но и одновременное получение четырёх изображений за одно кратковременное сканирование: только от жира (Fat Only, Fat), только от воды (Water Only, Water), в фазе (In-Phase, In) и противофазе (Out-of-Phase, Out) [1, 2]. Такая особенность импульсной последовательности позволяет точно и демонстративно выявлять жир в паренхиме органов или патологических образованиях.
Существуют двухточечные DIXON последовательности, в частности LAVA® [General Electric Healthcare, Соединённые Штаты Америки (США)], mDixon® (Philips Healthcare, Нидерланды) и многоточечные последовательности (например, VIBE® Siemens Healthcare, Германия). Они основаны на DIXON последовательностях, которые используют различные значения времени эха (Time Echo, TE) в зависимости от производителя и модели томографа. Также разработаны специализированные программные решения автоматического расчёта, такие как IDEAL IQ®, (General Electric Healthcare, США), Liver Lab® (Siemens Healthcare, Германия) и QUANT® (Philips Healthcare, Нидерланды). Указанные программные решения позволяют автоматически рассчитывать количественный показатель FF в процентах по протонной плотности (Proton Density Fat Fraction, PDFF). Однако данные модули доступны не на всех томографах, поскольку зачастую являются дополнительной опцией, приобретаемой отдельно [3]. В подобных случаях у врача-рентгенолога сохраняется возможность самостоятельного расчёта FF в процентах с учётом данных стандартных DIXON последовательностей с использованием формул, основанных на сигнальных характеристиках, — интенсивности сигнала (Signal Intensity, SI). Расчёт осуществляют по изображениям в фазе и противофазе, а также изображениям, взвешенным по воде и жиру [1, 4].
Однако количественные значения, полученные при таком подходе, могут существенно варьировать в зависимости от порядка сбора данных, производителя и модели томографа, индукции магнитного поля, а также других технических параметров. В литературе представлены отдельные сообщения о значительных погрешностях при определении FF в некоторых случаях [2, 5].
Очевидна необходимость обеспечения точности и достоверности количественных показателей FF при проведении МРТ с целью надёжного выявления патологических изменений [6]. Одним из эффективных подходов к решению данной задачи является валидация DIXON последовательностей с использованием фантомного моделирования на конкретном магнитно-резонансном томографе [7, 8].
ЦЕЛЬ
Оценить возможность количественного измерения жировой фракции с помощью стандартных диксоновских импульсных последовательностей посредством фантомного моделирования.
МЕТОДЫ
Дизайн исследования
Проведено экспериментальное многоцентровое одномоментное неослеплённое исследование возможностей последовательностей DIXON с использованием фантома.
Описание фантома
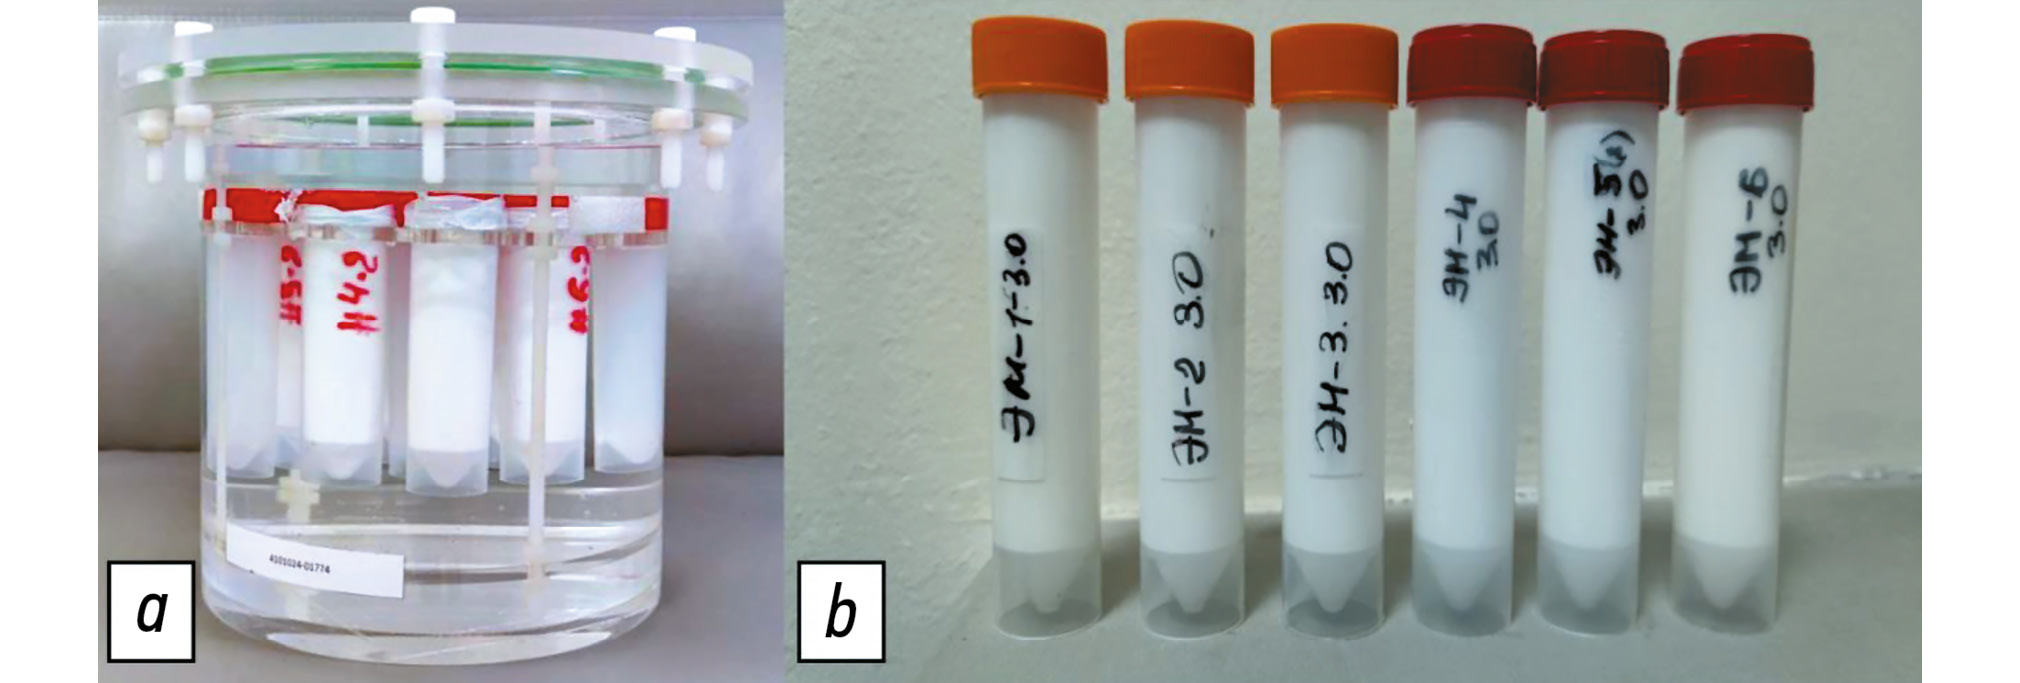
Для проведения эксперимента использовали фантом, разработанный в Научно-практическом клиническом центре диагностики и телемедицинских технологий Департамента здравоохранения г. Москвы (рис. 1, а). Фантом — это герметичный цилиндр из оргстекла с установленными в нём пробирками, содержащими эмульсии с различной концентрацией жировой фазы: 10, 20, 30, 40, 50 и 60% (см. рис. 1, b).

Рис. 1. Фантом: a — внешний вид фантома; b — внешний вид набора пробирок с готовыми эмульсиями.
Для моделирования данных концентраций жира приготовлены прямые эмульсии типа «масло в воде» на основе растительных масел (подсолнечного и соевого) с однородным распределением фаз [9–11]. С целью обеспечения длительной стабильности и гомогенности образцов использовали эмульгатор BTMS (Behentrimonium Methosulfate, Бегентримониум метосульфат). Диспергирование (эмульгирование) проводили путём его нагрева с последующим смешиванием с растительным маслом. Далее эмульгирование выполняли с помощью ультразвукового диспергатора IKA Ultra-Turrax T 25® (IKA-Werke GmbH & Co. KG, Германия).
На этапе контроля разработанный фантом протестировали с помощью магнитно-резонансной спектроскопии, а также методом программного расчёта на томографе Philips Ingenia Achieva 3.0 T® (Philips Healthcare, Нидерланды). Для каждой пробирки с эмульсией получены 1H магнитно-резонансные спектры [Stimulated Echo Acquisition Mode (STEAM); TE — 12, 24, 36, 48, 60 мс; Repetition Time (TR) — 6000 мс]. Они обработаны с использованием собственного кода в программе MATLAB® (MathWorks, США). Интенсивность сигналов воды и жира корректировали при релаксации T2, что приводило к количественному определению значений PDFF. Подтверждена точность задания жировой фракции, при которой максимальное отклонение измеренных значений составило 5% для образца с концентрацией жира 20%. Таким образом, продемонстрирована достоверность заданных концентраций жировой фракции в фантоме.
Описание экспериментов
В период с февраля 2022 по февраль 2024 г. выполнена серия фантомных тестов. Фантом отсканировали на магнитно-резонансных томографах трёх производителей, работающих с разной индукцией магнитного поля (1,5 и 3,0 Тл) (рис. 2):
- Optima® MR450w 1,5 Tл (General Electric Healthcare, США) с использованием последовательностей IDEAL IQ (IDEAL) и LAVA Flex (LAVA) на двух разных томографах;
- MAGNETOM® Skyra 3 Tл (Siemens Healthcare, Германия) с использованием последовательности T1 vibe (VIBE) на томографах из двух разных клиник;
- Ingenia® 3 Тл и Ingenia® Achieva 3,0 Tл (Philips Healthcare, Нидерланды) с использованием последовательностей mDIXON и DIХON QUANT (QUANT) на томографах из двух клиник.

Рис. 2. Установка фантома и проведение эксперимента.
Применяли стандартный протокол сканирования, установленный на конкретном томографе.
Оценку жировой фракции осуществляли по данным магнитно-резонансных томограмм фантома путём выделения области интереса (Region of Interest, ROI) на соответствующих изображениях (рис. 3, а). Значение интенсивности сигнала внутри области интереса фиксировали на пяти разных срезах (см. рис. 3, b) для серий In, Out, Fat и Water с последующим вычислением средних арифметических значений и внесением их в итоговый протокол результатов теста.

Рис. 3. Магнитно-резонансные изображения фантома: а — аксиальный скан фантома в режиме Fat с демонстрацией установки круглой области интереса; b — корональный скан фантома с уровнями, на которых производили измерения интенсивности сигнала. ROI — область интереса; D — диаметр; S — площадь.
Оценка концентрации жира
С целью оценки концентрации FF для каждого образца выполнили расчёт его процентного содержания с учётом итоговых значений SI с использованием двух известных формул [12].
- Стандартная формула с выполнением расчёта по изображениям In и Out:
, (1)
где FF1 — содержание жира, рассчитанное по изображениям в фазе и противофазе, %; SI(In) — интенсивность сигнала в фазе; SI(Out) — интенсивность сигнала в противофазе.
- Формула, включающая данные изображений с сигналом от воды и жира:
, (2)
где FF2 — содержание жира, рассчитанное по изображениям, взвешенным по воде и жиру, %; SI(Fat) — интенсивность сигнала жировых молекул; SI(water) — интенсивность сигнала молекул воды.
Далее проводили сравнение расчётных (измеренных) данных, полученных с использованием двух формул при заданных концентрациях жира в фантоме, посредством построения и анализа линейной зависимости.
Этическая экспертиза
В данном исследовании не принимали участие люди и лабораторные животные. В связи с этим этическую экспертизу протокола исследования не проводили.
Статистический анализ
Анализ линейной зависимости измеренных значений концентрации FF провели с использованием построения линейных графиков. Методом регрессионного анализа оценили коэффициенты линейной регрессии и их значимость для полученных значений концентрации FF с использованием двух формул (1) и (2).
Для оценки воспроизводимости измерений FF1 и FF2, полученных при использовании DIXON последовательностей, рассчитаны среднее значение, среднеквадратическое отклонение и коэффициент вариации.
Оценку выполнили для следующих вариантов.
- Общий коэффициент вариации:
, (3)
где M и sd — среднее значение и среднеквадратическое отклонение соответственно при рассмотрении всех сканирований фантома; i — номер сканирования.
- Коэффициент вариации для одной модели и DIXON последовательности (intra scanner):
, (4)
где M и sd — среднее значение и среднеквадратическое отклонение соответственно при рассмотрении сканирований фантома для одной модели томографа и DIXON последовательности; i — номер сканирования; j — номер сканера и DIXON последовательности.
Для сравнения дисперсии измерений, полученных на разных моделях томографов, применён F-тест после предварительной проверки нормальности распределения данных с использованием теста Шапиро–Уилка. Анализ проводили с помощью программных пакетов SciPy (версия 1.10.1) на языке Python, а также в Microsoft Excel®, версия 16 (Microsoft, США). Уровень статистической значимости для всех анализов соответствовал p <0,05. Выполнение пятикратного измерения FF определяли стандартными методами измерений, а магнитно-резонансные томографы подобрали с условием наличия как минимум двух сканеров с поддержкой DIXON последовательности.
РЕЗУЛЬТАТЫ
Сравнение полученных значений FF1 и FF2 с использованием соответствующих формул (1) и (2), рассчитанных для разных образцов в фантоме, выявило следующую зависимость (рис. 4).

Рис. 4. Результаты определения концентрации жира на различных магнитно-резонансных томографах с использованием диксоновских последовательностей и расчёта по формулам: a — расчёт осуществляют по изображениям в фазе и противофазе (1); b — расчёт выполняли по изображениям, взвешенным по воде и жиру (2). GE Optima — Optima® MR450w 1,5 Tл (General Electric Healthcare, Соединённые Штаты Америки); Philips Achieva — Ingenia® Achieva 3,0 Tл (Philips Healthcare, Нидерланды); Philips Ingenia — Ingenia® 3 Тл (Philips Healthcare, Нидерланды); Siemens Skyra — MAGNETOM® Skyra 3 Tл (Siemens Healthcare, Германия).
Анализ графиков, построенных для разных томографов и DIXON последовательностей, показал, что при использовании формулы (1) (см. рис. 4, а) все графики измеренных концентраций FF демонстрировали нелинейную зависимость от заданных значений. Для данных, рассчитанных по формуле (2) (см. рис. 4, b), выявлена выраженная линейная зависимость в большинстве случаев измерений, при этом для некоторых показателей наблюдали их смещение вдоль оси y.
Результаты анализа линейной регрессии для расчётов FF1 и FF2 с использованием соответствующих форму (1) и (2) продемонстрированы в табл. 1 для каждого томографа и DIXON последовательности.
Таблица 1. Анализ коэффициентов линейной регрессии для рассчитанных значений концентрации жира относительно заданных
Модель томографа (диксоновская последовательность) | FF1 | FF2 | ||
b (95% ДИ) | a (95% ДИ) | b (95% ДИ) | a (95% ДИ) | |
Optima® MR450w 1,5 Tл (General Electric Healthcare, Соединённые Штаты Америки) | ||||
Optima (IDEAL) | 27,691 (−8,88…64,26) | 0,071 (−0,87…1,01) | 2,201 (−3,79…8,19) | 1,34 (1,19–1,50) |
Optima (LAVA) | 48,31 (38,68–57,95) | −0,7 (−0,95…−0,45) | 30,29 (17,50–43,07) | 1,07 (0,74–1,40) |
Optima 2,0 (IDEAL)2 | 10,681 (−7,09…28,44) | 0,63 (0,17–1,09) | 3,92 (2,00–5,84) | 0,96 (0,91–1,01) |
Optima 2,0 (LAVA)2 | 37,67 (24,03–51,31) | −0,31 (−0,66…0,04) | 23,88 (6,25–41,50) | 1,09 (0,64–1,54) |
Ingenia® 3 Тл и Ingenia® Achieva 3,0 Tл (Philips Healthcare, Нидерланды) | ||||
Achieva (QUANT) | 11,611 (−3,79…27,02) | 0,56 (0,16–0,95) | 4,17 (1,76–6,58) | 0,94 (0,87–1,00) |
Ingenia (mDixon) | 51,57 (27,16–75,98) | −0,591 (−1,21…0,04) | 24,9 (15,73–34,08) | 1,08 (0,84–1,31) |
Ingenia 2,0 (mDixon)2 | 1,66 (−8,10…11,42) | 0,831 (0,58–1,08) | −2,991 (−12,73…6,74) | 1,02 (0,77–1,27) |
Ingenia 2,0 (QUANT)2 | 2,081 (−7,54…11,69) | 0,82 (0,57–1,07) | −3,061 (−12,76…6,64) | 1,01 (0,77–1,26) |
MAGNETOM® Skyra 3 Tл (Siemens Healthcare, Германия) | ||||
Skyra (VIBE) | 40,59 (33,12–48,07) | −0,61 (−0,80…−0,41) | 33,11 (4,22–61,99) | 1,19 (0,44–1,93) |
Skyra 2,0 (VIBE)2 | 33,58 (9,16–58,00) | 0,091 (−0,54…0,72) | 10,581 (−0,21…21,37) | 1,13 (0,85–1,40) |
Примечание. 1 — значения коэффициента, для которых не продемонстрирована статистическая значимость по данным регрессионного анализа (p >0,05); 2 — второй аппарат аналогичного производителя в другом медицинском учреждении; a — коэффициент наклона прямой; b — коэффициент смещения; FF1 — концентрация фракции жира, рассчитанная по формуле, основанной на параметрах, извлечённых из изображений, полученных в фазе и противофазе; FF2 — концентрация фракции жира, рассчитанная по формуле, основанной на параметрах, извлечённых из изображений, взвешенных по воде и жиру; ДИ — доверительный интервал. | ||||
Формат уравнения линейной регрессии представлен в виде:
y=a×x+b, (5)
где b — коэффициент смещения; а — коэффициент наклона прямой.
Анализ данных, представленных в табл. 1, позволяет сделать вывод о статистически значимом смещении измеренных значений FF1 и FF2, превышающем 5%. Такое смещение отмечено, например, для:
- двух сканеров Optima® MR450w 1,5 Tл (General Electric Healthcare, США) при использовании последовательности LAVA;
- сканера Ingenia® 3 Тл (Philips Healthcare, Нидерланды) при использовании последовательности mDixon;
- двух сканеров MAGNETOM® Skyra 3 Tл (Siemens Healthcare, Германия) при использовании последовательности VIBE.
Коэффициент наклона линейной регрессии для показателя FF1 получен в широком интервале от −0,70 до 0,83, тогда как для FF2 значения коэффициента были около единицы в интервале от 0,94 до 1,34 (см. табл. 1).
С целью анализа воспроизводимости результатов для одной модели магнитно-резонансного томографа и DIXON последовательности выполнен расчёт статистических показателей измерений, представленных в табл. 2.
Таблица 2. Результаты сканирования шести образцов фантома (10–60٪) с использованием двух способов оценки жировой фракции
Параметр | Модель томографа (диксоновская последовательность) | FF1 | FF2 | ||||||||||
10% | 20% | 30% | 40% | 50% | 60% | 10% | 20% | 30% | 40% | 50% | 60% | ||
Общая оценка (все томографы и диксоновские последовательности) | |||||||||||||
Среднее значение Среднеквадратичное отклонение Общий коэффициент вариации, % | Все томографы (диксоновские последовательности) | 20,84 10,58 50,77 | 30,10 9,95 33,07 | 34,11 8,78 25,75 | 34,16 10,08 29,49 | 34,16 10,08 29,49 | 31,45 10,08 32,04 | 19,89 10,52 52,91 | 34,71 16,12 46,45 | 46,84 17,26 36,85 | 57,62 16,55 28,73 | 57,62 16,55 28,73 | 67,99 16,55 24,35 |
Optima® MR450w 1,5 Tл (General Electric Healthcare, Соединённые Штаты Америки) | |||||||||||||
Среднее значение | Optima (IDEAL) Optima (LAVA) Optima 2,0 (IDEAL)1 Optima 2,0 (LAVA)1 | 14,72 37,27 12,86 27,43 | 27,97 40,29 22,01 36,31 | 45,34 27,42 31,77 33,52 | 44,91 18,85 42,42 26,79 | 28,36 12,23 48,14 21,49 | 19,44 6,81 39,14 16,27 | 14,72 35,16 13,01 30,56 | 27,96 53,15 23,06 41,46 | 45,34 67,41 32,59 65,73 | 55,13 76,65 43,06 73,07 | 71,77 83,85 52,24 78,48 | 80,58 89,60 60,33 83,33 |
Коэффициент вариации, % | Optima (IDEAL) Optima (LAVA) Optima 2,0 (IDEAL)1 Optima 2,0 (LAVA)1 | 2,89 2,66 21,19 4,65 | 2,85 1,52 11,92 1,67 | 1,14 3,19 4,85 2,05 | 0,52 5,94 2,27 2,42 | 4,06 7,97 1,11 4,74 | 3,98 18,22 1,89 6,69 | 2,80 4,03 3,20 4,40 | 2,82 1,16 2,95 11,47 | 1,16 1,21 1,45 0,80 | 0,38 1,48 1,30 1,10 | 1,65 1,27 1,06 1,25 | 0,96 1,06 0,95 0,64 |
Ingenia® 3 Тл и Ingenia® Achieva 3,0 Tл (Philips Healthcare, Нидерланды) | |||||||||||||
Среднее значение | Ingenia (mDixon) Achieva (QUANT) Ingenia 2,0 (mDixon)1 Ingenia 2,0 (QUANT)1 | 33,66 12,40 8,27 8,67 | 46,39 23,04 16,94 17,21 | 45,84 30,50 27,17 27,34 | 29,18 40,45 38,80 38,78 | 18,73 43,19 46,27 46,35 | 12,58 37,44 46,27 46,30 | 33,34 12,77 7,40 7,38 | 50,41 24,07 15,86 15,83 | 53,56 31,43 26,69 26,53 | 70,59 42,39 38,23 37,97 | 80,71 51,14 53,63 53,56 | 87,23 59,89 53,53 53,50 |
Коэффициент вариации, % | Ingenia (mDixon) Achieva (QUANT) Ingenia 2,0 (mDixon)1 Ingenia 2,0 (QUANT)1 | 2,00 7,95 8,96 15,58 | 0,40 2,68 3,84 5,94 | 1,45 6,09 1,21 2,09 | 2,02 1,53 0,11 0,16 | 2,52 0,22 0,50 0,69 | 3,22 1,47 0,07 0,18 | 2,27 2,02 2,55 2,62 | 14,06 1,14 1,48 1,53 | 0,27 4,74 0,88 1,95 | 0,73 2,68 1,03 2,25 | 1,02 1,62 0,67 0,77 | 0,62 1,22 0,24 0,31 |
MAGNETOM® Skyra 3 Tл (Siemens Healthcare, Германия) | |||||||||||||
Среднее значение | Skyra (VIBE) Skyra 2,0 (VIBE)1 | 32,09 23,27 | 33,10 38,34 | 21,86 47,91 | 14,46 43,05 | 9,33 35,98 | 5,38 32,02 | 29,87 16,70 | 66,24 35,40 | 77,85 47,46 | 85,98 58,79 | 91,69 67,57 | 95,96 73,91 |
Коэффициент вариации, % | Skyra (VIBE) Skyra 2,0 (VIBE)1 | 2,75 0,84 | 4,51 0,37 | 8,79 0,42 | 14,59 0,57 | 24,46 0,32 | 42,44 7,40 | 9,06 0,88 | 2,67 0,36 | 1,66 0,53 | 1,12 0,36 | 0,51 0,19 | 0,29 0,17 |
Примечание. 1 — второй аппарат аналогичного производителя в другом медицинском учреждении; FF1 — концентрация фракции жира, рассчитанная по формуле, основанной на параметрах, извлечённых из изображений, полученных в фазе и противофазе; FF2 — концентрация фракции жира, рассчитанная по формуле, основанной на параметрах, извлечённых из изображений, взвешенных по воде и жиру. | |||||||||||||
Для оценки дисперсии измерений в зависимости от модели томографа и DIXON последовательности проведён F-тест. Анализ выполнили попарно для каждого из шести образцов фантома (10–60%) с учётом измеренных значений FF1 и FF2. Так, для FF1 (образец с содержанием жира 10%) получены статистически значимые различия показателей вариации при использовании одной модели томографов Optima® MR450w 1,5 Tл (General Electric Healthcare, США), последовательность IDEAL (p=0,002), и MAGNETOM® Skyra 3 Tл (Siemens Healthcare, Германия), последовательность VIBE (p=0,007). В то же время для Ingenia® 3 Тл (Philips Healthcare, Нидерланды), последовательность mDixon, статистически значимых различий не выявлено. Для FF2 (образец с содержанием жира 10%) получены статистически значимые различия показателей вариации при использовании томографов Ingenia® 3 Тл (Philips Healthcare, Нидерланды), последовательность mDixon (p=0,010), и MAGNETOM® Skyra 3 Tл (Siemens Healthcare, Германия), последовательность VIBE (p <0,001). Кроме того, при использовании одинаковых DIXON последовательностей (IDEAL и LAVA) на томографах Optima® MR450w 1,5 Tл (General Electric Healthcare, США) отмечены равные значения коэффициента вариации FF2. Однако при их сравнении между собой выявлены статистически значимые различия коэффициента вариации FF2 (р=0,020).
Обсуждение
Проведённое многоцентровое фантомное исследование выявило как возможности, так и ограничения импульсных DIXON последовательностей при количественном определении FF с использованием магнитно-резонансных томографов разных моделей и производителей. Для корректного непрограммного количественного определения FF предпочтительнее проводить расчёты с использованием формулы (2), то есть проводить измерения по данным изображений, взвешенных по воде и жиру. Расчёты по формуле (1) демонстрируют неоднозначные результаты, которые затруднительно интерпретировать. Полученные данные подчёркивают необходимость выполнения калибровки с использованием фантома, которая позволит определить воспроизводимость измеренных значений, а также даст возможность рассчитать поправочные коэффициенты для их приближения к заданным. Однако расчёты с использованием формулы (2) также требуют калибровки.
Научные исследования направлены на выявление достоверных неинвазивных биомаркёров — количественных показателей, определяемых не визуально, а с использованием объективных цифровых данных. Процентный расчёт FF при проведении МРТ позволяет получать дополнительную информацию в области интереса. Это возможно благодаря различным вариантам импульсных DIXON последовательностей, которые доступны на томографах любых производителей [12]. Количественный показатель FF и PDFF (в случае использования программ автоматического расчёта) при использовании импульсных DIXON последовательностей широко применяют в клинической практике для дифференциальной диагностики образований надпочечников, печени, а также выявления хилёзных новообразований брюшной полости [13]. Кроме того, метод используют для оценки патологических изменений костно-суставной системы при доброкачественных и злокачественных новообразованиях, скелетно-мышечной дистрофии, остеопорозе, гематологических заболеваниях, а также при выявлении стеатоза печени и его степени [14–18].
Фантом является сложным тест-объектом, где смоделирован именно внутриклеточный жир. Содержимое в пробирках является тканеимитирующим материалом, то есть жировая эмульсия моделирует точное содержание внутриклеточного жира в нормальных и патологически изменённых тканях с разной концентрацией (например, в аденоме надпочечника или при жировом гепатозе). В литературе известен фантом с включением железосодержащих эмульсий [19]. Фантомная модель в эксперименте, которую мы описали, не учитывает наличие дополнительных включений, в частности железа. С одной стороны, данный аспект можно рассматривать как недостаток, с другой — целесообразность включения в рутинные тесты пробирок с железом остаётся до конца не изученной, поскольку используемые формулы не учитывают его влияние на магнитно-резонансный сигнал.
Мы провели оценку результатов работы стандартных импульсных DIXON последовательностей в сравнении с заданными достоверными значениями FF в фантоме. Полученные результаты свидетельствуют о возможности её надёжного расчёта с использованием формулы (2), учитывающей сигналы от воды и жира. В случае применения для всех моделей томографов и DIXON последовательностей продемонстрирована линейная зависимость между значениями FF2 и заданными. Наиболее близкими к истинной прямой получены значения для Ingenia® 2,0 — последовательности QUANT и mDixon и Ingenia® Achieva 3,0 Tл (Philips Healthcare, Нидерланды) — последовательность QUANT, а также для Optima® MR450w 1,5 Tл (General Electric Healthcare, США) — последовательность IDEAL. Для формулы (1) установлена линейная зависимость графиков с положительным значением коэффициента наклона при FF от 0 до 30%, тогда как при визуальной оценке — от 30 до 60% коэффициент наклона отрицателен либо близок к 0.
Результаты оценки дисперсии по данным пятикратных измерений для каждой модели томографа и DIXON последовательности продемонстрировали различия в результатах, полученных на одинаковом оборудовании в разных медицинских центрах. Это подчёркивают необходимость кросс-валидации между учреждениями даже в случае использования одной модели томографа и последовательности.
Ограничения исследования
Ограничением в нашей работе было отсутствие образцов с FF больше 60%. Это связано с тем, что при изготовлении высококонцентрированных жировых эмульсий по данной методике отмечено их расслоение на жировую и водную часть. В свою очередь, для достоверной оценки сигнальных характеристик необходимы однородные и стабильные эмульсии. Однако, согласно клиническим наблюдениям, значения FF больше 60% в тканях встречают редко, поэтому полученные результаты возможно экстраполировать и на более высокие концентрации.
Дополнительным ограничением является отсутствии данных о стабильности магнитно-резонансных показателей фантома после эксперимента.
Заключение
С помощью фантома, который мы описали, можно контролировать воспроизводимость измерений на разных томографах, валидировать полученные результаты независимо от производителя и модели, обеспечивая надлежащий контроль качества при проведении МРТ. В случае невозможности использования программ автоматического расчёта FF предварительные фантомные тестирования позволяют вычислять поправочные коэффициенты и при необходимости корректировать значения на томографе. Полученные результаты способствуют повышению качества диагностики по данным МРТ, обеспечивая врачам-рентгенологам более высокую точность постановки диагноза.
Проведённое фантомное исследование с использованием различных магнитно-резонансных томографов продемонстрировало, что DIXON последовательности возможно эффективно применять для количественного анализа FF при условии предварительного фантомного тестирования. В соответствии с полученными результатами, фантомное тестирование рекомендуется специалистам для повышения точности и воспроизводимости количественных показателей на конкретных моделях томографов. Для корректного количественного определения FF предпочтительнее проводить расчёты по данным карт воды и жира, с использованием формулы (2).
ДОПОЛНИТЕЛЬНАЯ ИНФОРМАЦИЯ
Вклад авторов. О.Ю. Панина — концепция исследования, разработка и проведение экспериментов, написание текста рукописи; А.И. Громов — научное руководство работой, интерпретация результатов, редактирование текста рукописи; Э.С. Ахмад — интерпретация результатов, анализ данных, написание текста рукописи; Д.С. Семёнов — разработка и изготовление фантома, проведение экспериментов; А.В. Петряйкин — научное руководство работой, интерпретация результатов, редактирование текста рукописи; С.А. Кивасёв — проведение экспериментов; В.А. Нечаев — редактирование текста рукописи, утверждение окончательных результатов работы. Все авторы одобрили рукопись (версию для публикации), а также согласились нести ответственность за все аспекты работы, гарантируя надлежащее рассмотрение и решение вопросов, связанных с точностью и добросовестностью любой её части.
Благодарности. Авторы выражают благодарность к.т.н. К.А. Сергуновой за первичную идею исследования.
Этическая экспертиза. В данном исследовании не принимали участие люди и лабораторные животные. В связи с этим этическая экспертиза протокола исследования не проводилась.
Источник финансирования. Данная статья подготовлена авторским коллективом в рамках научно-исследовательской работы «Научное обеспечение стандартизации, безопасности и качества магнитно-резонансной томографии», (ЕГИСУ: № 123031500007-6) в соответствии с Приказом от 21.12.2022 № 1196 «Об утверждении государственных заданий, финансовое обеспечение которых осуществляется за счёт средств бюджета г. Москвы государственным бюджетным (автономным) учреждениям подведомственным Департаменту здравоохранения г. Москвы, на 2023 год и плановый период 2024 и 2025 годов» Департамента здравоохранения г. Москвы.
Раскрытие интересов. Авторы заявляют об отсутствии отношений, деятельности и интересов за последние три года, связанных с третьими лицами (коммерческими и некоммерческими), интересы которых могут быть затронуты содержанием статьи.
Оригинальность. При создании настоящей работы авторы не использовали ранее опубликованные сведения (текст, иллюстрации, данные).
Доступ к данным. Редакционная политика в отношении совместного использования данных к настоящей работе не применима.
Генеративный искусственный интеллект. При создании настоящей статьи технологии генеративного искусственного интеллекта не использовали.
Рассмотрение и рецензирование. Настоящая работа подана в журнал в инициативном порядке и рассмотрена по обычной процедуре. В рецензировании участвовали два члена редакционной коллегии и научный редактор издания.
ADDITIONAL INFORMATION
Author contributions: O.Yu. Panina: conceptualization, investigation, writing—original draft; A.I. Gromov: supervision, data interpretation, writing—review & editing; E.S. Akhmad: data interpretation, formal analysis, writing—original draft; D.S. Semenov: phantom development and manufacturing, investigation; A.V. Petraikin: supervision, data interpretation, writing—review & editing; S.A. Kivasev: investigation; V.A. Nechaev: writingformal analysis— review & editing, final approval of the results. All the authors approved the version of the manuscript to be published and agreed to be accountable for all aspects of the work, ensuring that questions related to the accuracy or integrity of any part of the work are appropriately investigated and resolved.
Acknowledgments: The authors express their gratitude to K.A. Sergunova, Cand. Sci. (Engineering) for the initial idea that inspired this study.
Ethics approval: This study did not involve human participants or laboratory animals; therefore, ethics approval was not required.
Funding sources: This article was prepared by the author team as part of the research project Scientific Support of the Standardization, Safety, and Quality of Magnetic Resonance Imaging (Unified State Information Accounting System No. 123031500007-6), in accordance with Order No. 1196 dated December 21, 2022, On Approval of State Assignments Funded by the Budget of the City of Moscow for State Budgetary (Autonomous) Institutions Under the Jurisdiction of the Moscow City Health Department for 2023 and the Planned Period of 2024–2025, issued by the Moscow City Health Department.
Disclosure of interests: The authors have no relationships, activities, or interests for the last three years related to for-profit or not-for-profit third parties whose interests may be affected by the content of the article.
Statement of originality: No previously published material (text, images, or data) was used in this work.
Data availability statement: The editorial policy regarding data sharing does not apply to this work.
Generative AI: No generative artificial intelligence technologies were used to prepare this article.
Provenance and peer review: This paper was submitted unsolicited and reviewed following the standard procedure. The peer review process involved two members of the editorial board and the in-house science editor.
About the authors
Olga Yu. Panina
Research and Practical Clinical Center for Diagnostics and Telemedicine Technologies; Moscow City Hospital named after S.S. Yudin
Author for correspondence.
Email: olgayurpanina@gmail.com
ORCID iD: 0000-0002-8684-775X
SPIN-code: 5504-8136
MD
Russian Federation, 24 Petrovka st, bldg 1, Moscow, 127051; MoscowAlexander I. Gromov
Russian University of Medicine; National Medical Research Radiological Center
Email: gai8@mail.ru
ORCID iD: 0000-0002-9014-9022
SPIN-code: 6842-8684
MD, Dr. Sci. (Medicine), Professor
Russian Federation, Moscow; MoscowEkaterina S. Ahkmad
Research and Practical Clinical Center for Diagnostics and Telemedicine Technologies
Email: akhmades@zdrav.mos.ru
ORCID iD: 0000-0002-8235-9361
SPIN-code: 5891-4384
Russian Federation, 24 Petrovka st, bldg 1, Moscow, 127051
Dmitry S. Semenov
Research and Practical Clinical Center for Diagnostics and Telemedicine Technologies
Email: semenovds4@zdrav.mos.ru
ORCID iD: 0000-0002-4293-2514
SPIN-code: 2278-7290
Cand. Sci. (Engineering)
Russian Federation, 24 Petrovka st, bldg 1, Moscow, 127051Stanislav A. Kivasev
Central Clinical Hospital “RZD-Medicine”
Email: Kivasev@yahoo.com
ORCID iD: 0000-0003-1160-5905
SPIN-code: 9883-3406
MD
Russian Federation, MoscowAlexey V. Petraikin
Research and Practical Clinical Center for Diagnostics and Telemedicine Technologies
Email: PetryajkinAV@zdrav.mos.ru
ORCID iD: 0000-0003-1694-4682
SPIN-code: 6193-1656
MD, Dr. Sci. (Medicine)
Russian Federation, 24 Petrovka st, bldg 1, Moscow, 127051Valentin A. Nechaev
Moscow City Hospital named after S.S. Yudin
Email: NechaevVA1@zdrav.mos.ru
ORCID iD: 0000-0002-6716-5593
SPIN-code: 2527-0130
MD, Cand. Sci. (Medicine)
Russian Federation, MoscowReferences
- Outwater EK, Blasbalg R, Siegelman ES, Vala M. Detection of lipid in abdominal tissues with opposed-phase gradient-echo images at 1.5 T: techniques and diagnostic importance. RadioGraphics. 1998;18(6):1465–1480. doi: 10.1148/radiographics.18.6.9821195
- Panina OYu, Gromov AI, Akhmad ES, et al. Accuracy of fat fraction estimation using DIXON: experimental phantom study. Medical Visualization. 2022;26(4):147–158. doi: 10.24835/1607-0763-1160 EDN: JDIWXI
- Bray TJP, Chouhan MD, Punwani S, et al. Fat fraction mapping using magnetic resonance imaging: insight into pathophysiology. The British Journal of Radiology. 2017;91(1089):20170344. doi: 10.1259/bjr.20170344
- Bhat V, Velandai S, Belliappa V, et al. Quantification of liver fat with mDIXON magnetic resonance imaging, comparison with the computed tomography and the biopsy. Journal of Clinical and Diagnostic Research. 2017;11(7):TC06–TC10. doi: 10.7860/JCDR/2017/26317.10234
- Bainbridge A, Bray TJP, Sengupta R, Hall-Craggs MA. Practical approaches to bone marrow fat fraction quantification across magnetic resonance imaging platforms. Journal of Magnetic Resonance Imaging. 2020;52(1):298–306. doi: 10.1002/jmri.27039 EDN: WCMNIG
- Gulani V, Seiberlich N. Quantitative MRI: rationale and challenges. Advances in Magnetic Resonance Technology and Applications. 2020;1:xxxvii–li. doi: 10.1016/B978-0-12-817057-1.00001-9
- Vasilev YuA, Semenov DS, Akhmad ES, et al. A method for assessing the effect of metal artifact reduction algorithms on quantitative characteristics of CT images. Biomedical Engineering. 2020;54(4):285–288. doi: 10.1007/s10527-020-10023-5 EDN: YEHJTT
- Morozov S, Sergunova K, Petraikin A, et al. Diffusion processes modeling in magnetic resonance imaging. Insights into Imaging. 2020;11(1):60. doi: 10.1186/s13244-020-00863-w EDN: QEFDVK
- Sergunova KA. Using siloxane-based inverse emulsions to control the measured diffusion coefficient in magnetic resonance imaging. Biomedical Engineering. 2019;(5):22–25. (In Russ.) EDN: HUPRTQ
- Petraikin AV, Ivanova DV, Akhmad ES, et al. Phantom modeling for selection of optimum reconstruction filters in the quantitative computer tomography. Meditsinskaya fizika. 2020;(2):34–44. EDN: TLLBVQ
- Vasilev YuA, Cherkasskaya MV, Akhmad ES, et al. Phantom modelling in magnetic resonance imaging: an overview of materials for simulating tissue relaxation time (review). Polymer materials and technologies. 2023;9(4):6–20. doi: 10.32864/polymmattech-2023-9-4-6-20 EDN: TCSKRR
- van Vucht N, Santiago R, Lottmann B, et al. The Dixon technique for MRI of the bone marrow. Skeletal Radiology. 2019;48(12):1861–1874. doi: 10.1007/s00256-019-03271-4
- Gromov AI, Gorinov AV, Galljamov EA. Mesenteric chillous lymphangioma. Visualization features on opposed-phase MR images. Medical Visualization. 2019;23(4):86–92. doi: 10.24835/1607-0763-2019-4-86-92 EDN: UCRGCC
- Zhao Y, Huang M, Ding J, et al. Prediction of abnormal bone density and osteoporosis from lumbar spine MR using modified dixon quant in 257 subjects with quantitative computed tomography as reference. Journal of Magnetic Resonance Imaging. 2018;49(2):390–399. doi: 10.1002/jmri.26233
- Maeder Y, Dunet V, Richard R, et al. Bone marrow metastases: T2-weighted Dixon Spin-Echo Fat Images Can Replace T1-weighted Spin-Echo Images. Radiology. 2018;286(3):948–959. doi: 10.1148/radiol.2017170325
- Chow LTC, Ng AWH, Wong SKC. Focal nodular and diffuse haematopoietic marrow hyperplasia in patients with underlying malignancies: a radiological mimic of malignancy in need of recognition. Clinical Radiology. 2017;72(3):265.e7–265.e23. doi: 10.1016/j.crad.2016.10.015
- Omoumi P. Update on Advances in Musculoskeletal Magnetic Resonance Imaging. Seminars in Musculoskeletal Radiology. 2015;19(04):319–320. doi: 10.1055/s-0035-1565876
- Pezeshk P, Alian A, Chhabra A. Role of chemical shift and Dixon based techniques in musculoskeletal MR imaging. European Journal of Radiology. 2017;94:93–100. doi: 10.1016/j.ejrad.2017.06.011
- Fukuzawa K, Hayashi T, Takahashi J, et al. Evaluation of six-point modified dixon and magnetic resonance spectroscopy for fat quantification: a fat–water–iron phantom study. Radiological Physics and Technology. 2017;10(3):349–358. doi: 10.1007/s12194-017-0410-9
Supplementary files

