


Optimization of left ventricular lead implantation based on combined myocardial perfusion scintigraphy and computed tomography data
- Authors: Mishkina A.I.1, Atabekov T.A.1, Sazonova S.I.1, Batalov R.E.1, Popov S.V.1, Zavadovsky K.V.1
-
Affiliations:
- Tomsk National Research Medical Centre, Russian Academy of Sciences
- Issue: Vol 6, No 2 (2025)
- Pages: 229-238
- Section: Original Study Articles
- Submitted: 22.08.2024
- Accepted: 25.09.2024
- Published: 08.07.2025
- URL: https://jdigitaldiagnostics.com/DD/article/view/635333
- DOI: https://doi.org/10.17816/DD635333
- EDN: https://elibrary.ru/JPGZLU
- ID: 635333

Cite item
Full Text

Abstract
BACKGROUND: Successful cardiac resynchronization therapy in patients with chronic heart failure critically depends on the selection of the optimal implantation site for the left ventricular lead. A hybrid imaging approach combining cardiac venous computed tomography and myocardial perfusion scintigraphy may assist in identifying the target vein and improve procedural efficacy.
AIM: The work aimed to evaluate the feasibility of a multimodal imaging approach for optimizing left ventricular lead implantation in cardiac resynchronization therapy.
METHODS: It was a prospective, observational, single-center, non-randomized controlled study. Patients with chronic heart failure and indications for cardiac resynchronization therapy in accordance with current guidelines were enrolled. Prior to the procedure, the patients underwent computed tomography of the cardiac veins to visualize venous anatomy and myocardial perfusion scintigraphy to assess the extent of left ventricular perfusion impairment. The optimal site for left ventricular lead placement was identified using a three-dimensional reconstruction of the coronary sinus fused with myocardial perfusion scintigraphy data. To assess the effectiveness of the hybrid approach, a reference group was formed, in which cardiac resynchronization implantation was performed using the standard method, without preprocedural evaluation of coronary venous anatomy or myocardial scarring. Six months after cardiac resynchronization therapy, all patients underwent echocardiography to evaluate treatment effectiveness. Echocardiographic response was defined as a reduction in left ventricular end-systolic volume by ≥15% and/or an increase in ejection fraction by ≥5%.
RESULTS: The imaging group consisted of 40 patients with chronic heart failure, whereas the reference group included 30 patients with the same diagnosis. Six months after cardiac resynchronization therapy, a positive treatment response was observed in 33 patients (82%) in the imaging group, significantly higher than in the reference group (17 patients, 57%), p = 0.031. In the imaging group, the reduction in left ventricular end-systolic volume was statistically significant compared with the reference group and amounted to −52 [−71; −22.5] mL versus −21 [−64; −1] mL, respectively (p = 0.039). The increase in left ventricular ejection fraction was 7.5 [4.5; 15]% in the imaging group and 4.5 [0; 13]% in the reference group, with no statistically significant difference (p = 0.082).
CONCLUSION: The use of cardiovascular imaging methods, including cardiac venous computed tomography and myocardial perfusion scintigraphy, was associated with an increased proportion of responders to cardiac resynchronization therapy.
Full Text
ОБОСНОВАНИЕ
Хроническая сердечная недостаточность (ХСН) — одна из основных проблем современной кардиологии. Несмотря на достижения в лечении, прогноз пациентов с ХСН II–III функционального класса (ФК) по классификации Нью-Йоркской кардиологической ассоциации (NYHA) остаётся неблагоприятным [1, 2]. Медикаментозная терапия не всегда обеспечивает адекватный контроль симптомов и улучшение прогноза у данной группы пациентов. В связи с этим всё больше внимания уделяют применению интервенционных методов, включая имплантацию кардиологических устройств [3].
Сердечная ресинхронизирующая терапия (СРТ) является эффективным методом лечения пациентов с ХСН со сниженной фракцией выброса (ФВ) левого желудочка (ЛЖ) и нарушениями желудочковой проводимости. Данный метод лечения направлен на синхронизацию электрической активности желудочков сердца, что приводит к восстановлению их сократительной способности и снижению ФК ХСН. При этом уменьшается частота госпитализаций по поводу её декомпенсации и увеличивается выживаемость пациентов [4]. В то же время в 40% случаев не отмечают положительного эффекта от СРТ [5, 6]. Одним из основных способов повышения её эффективности является оптимизация отбора пациентов на имплантацию устройства [7, 8].
Для решения этой задачи активно используют методы сердечно-сосудистой визуализации [9–11], обладающие высокой точностью в определении потенциальных респондеров1 на СРТ [12]. Современные исследования демонстрируют, что эффективность СРТ у пациентов с ишемической кардиомиопатией ниже, чем при некоронарогенных формах заболевания [13]. При этом наличие выраженных рубцовых изменений миокарда в зоне установки левожелудочкового электрода ассоциировано с отсутствием положительного ответа на СРТ [14]. В связи с этим на этапе планирования интервенционного вмешательства важно определить локализацию рубцовых изменений миокарда для последующего выбора области оптимальной для его имплантации [14]. Одним из методов, позволяющих решать эту задачу, является перфузионная сцинтиграфия миокарда (ПСМ), обеспечивающая одновременную оценку миокардиальной перфузии и сократительной функции ЛЖ. Однако из-за вариабельности анатомии коронарных вен во время операции не всегда удаётся определить «целевую вену» для имплантации электрода, соответствующую зоне миокарда с сохранённым кровоснабжением. Это обусловливает необходимость предварительной неинвазивной визуализации коронарных вен с помощью компьютерной томографии (КТ-венография) [15]. Мы предположили, что применение гибридного визуализирующего подхода, в частности, совмещение данных КТ-венографии и ПСМ позволит оптимизировать выбор целевой вены для имплантации левожелудочкового электрода при проведении СРТ, что, в свою очередь, повысит эффективность интервенционного вмешательства.
ЦЕЛЬ
Оценить возможности применения мультимодального лучевого подхода для оптимизации имплантации левожелудочкового электрода при проведении СРТ.
МЕТОДЫ
Дизайн исследования
Проведено наблюдательное одноцентровое проспективное нерандомизированное контролируемое исследование.
Критерии соответствия
Критерии включения:
- пациенты с ХСН II и III ФК по классификации NYHA ишемической и неишемической этиологии с показаниями для проведения СРТ согласно современным рекомендациям [4];
- снижение ФВ ЛЖ ≤35% по данным эхокардиографии (ЭхоКГ);
- ширина комплекса QRS >130 мс;
- полная блокада левой ножки пучка Гиса.
Критерии исключения:
- острый инфаркт миокарда;
- аортокоронарное шунтирование или стентирование коронарных артерий в течение последних 3 мес.;
- нестабильная стенокардия;
- острый миокардит;
- тяжёлый первичный стеноз или недостаточность митрального, трёхстворчатого и аортального клапана;
- психическая или физическая неспособность участвовать в исследовании;
- хроническое заболевание почек тяжёлой степени (расчётная скорость клубочковой фильтрации — <30 мл/мин/1,73 м2).
Условия проведения
В исследование включены пациенты, госпитализированные для интервенционного вмешательства в отделение хирургического лечения сложных нарушений ритма сердца и электрокардиостимуляции Научно-исследовательского института (НИИ) кардиологии Томского национального исследовательского медицинского центра (НИМЦ). Сцинтиграфические исследования выполняли на базе Центра коллективного пользования научно-исследовательского оборудования «Медицинская геномика» Томского НИМЦ.
Продолжительность исследования
Исследование проведено в период с мая 2020 по февраль 2024 г. Всех пациентов, включённых в исследование, через 6 мес. после интервенционного вмешательства повторно госпитализировали для оценки эффективности лечения.
Описание медицинского вмешательства
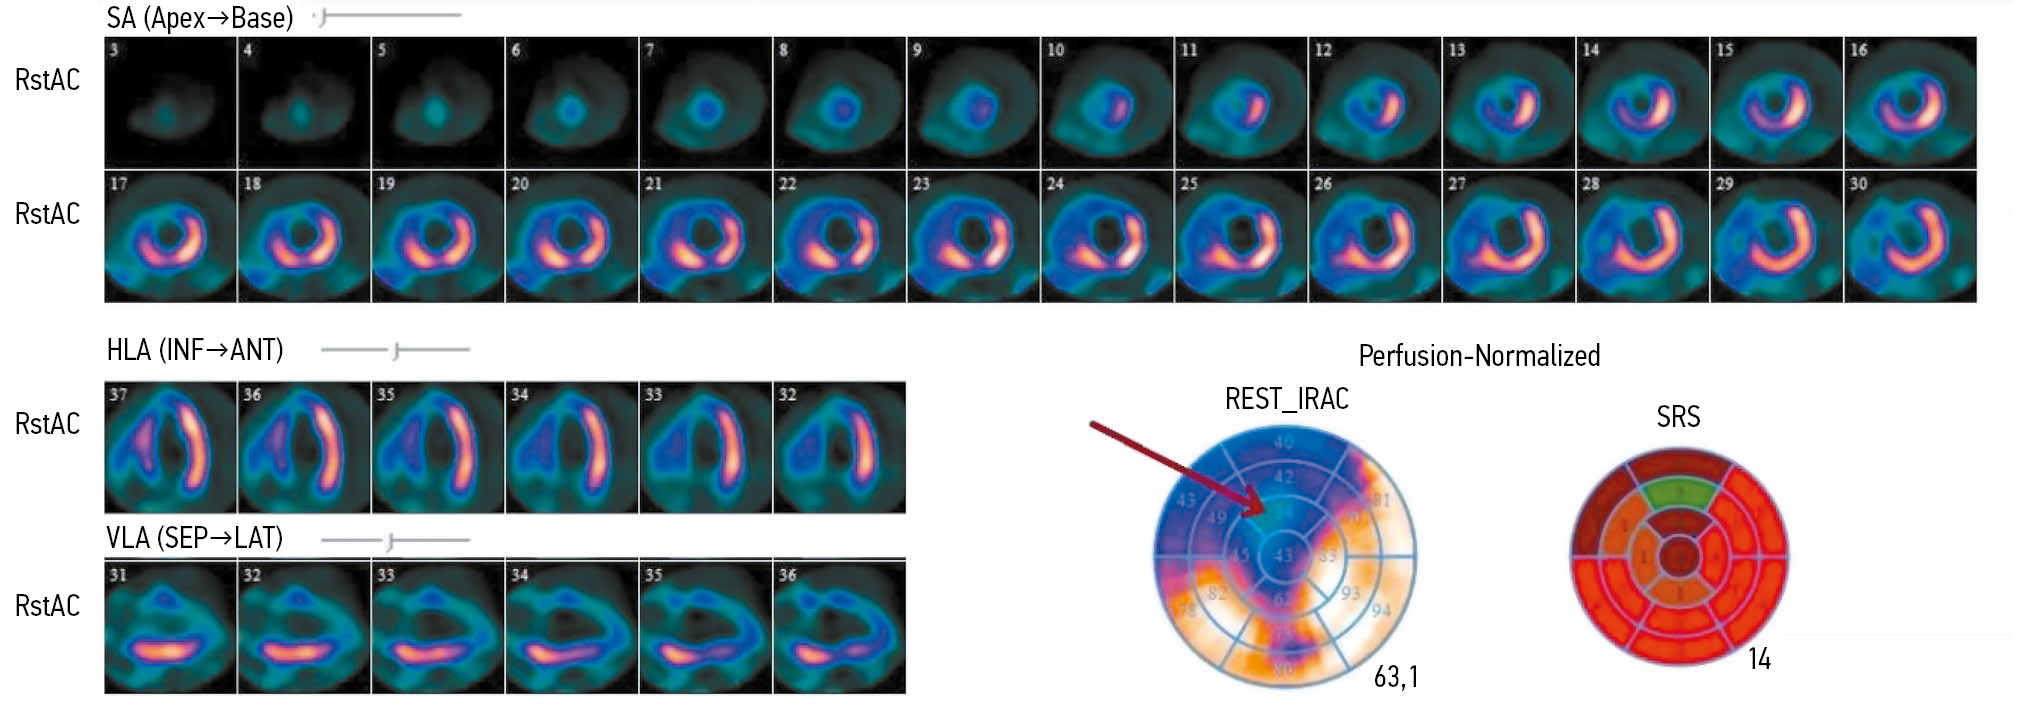
ПСМ проводили в состоянии функционального покоя с внутривенным введением радиофармпрепарата (РФП) 99mTc-метокси-изобутил-изотнитрил (99mТс-МИБИ) в дозе 370–450 МБк. Сцинтиграфические изображения записывали в режиме синхронизации с электрокардиограммой (ЭКГ-синхронизация) (16 кадров на сердечный цикл) через 90 мин после инъекции РФП. Продолжительность записи составила 10 мин. Полученные изображения обрабатывали с использованием специализированного программного обеспечения с построением нормализованной 17-сегментарной полярной карты ЛЖ, отражающей перфузию миокарда (рис. 1).

Рис. 1. Результаты перфузионной сцинтиграфии миокарда левого желудочка пациента с хронической сердечной недостаточностью: срезы по короткой и длинной осям, а также 17-сегментарная полярная карта левого желудочка (стрелкой обозначен дефект перфузии, охватывающий верхушку, переднюю и передне-перегородочную области). SA (Short Axis) — короткая ось; HLA (Horizontal Long Axis) — горизонтальная длинная ось; VLA (Vertical Long Axis) — вертикальная длинная ось; Apex — верхушка; Base — основание; INF — нижняя стенка; ANT — передняя стенка; SEP — перегородочная стенка; LAT — боковая стенка; REST_IRAC (Rest Integrated Regional Activity Counts) — интегральная активность в каждом сегменте миокарда в покое; SRS (Summed Rest Score) — суммарный балл в покое.
КТ-венографию сердца проводили с использованием мультиспирального компьютерного томографа и с внутривенным введением 90–110 мл неионного рентгенконтрастного препарата йопромид (370 мг) через кубитальный катетер. При необходимости вводили β-адреноблокатор для поддержания частоты сердечных сокращений менее 70 в мин. Запись изображений проводили с ЭКГ-синхронизацией в ретроспективном режиме. Момент начала сканирования выбирали с учётом времени достижения плотного контрастирования нисходящего отдела аорты на уровне коронарного синуса при введении контрастного вещества с технической задержкой 6 с. Из полученных срезов КТ-венографии реконструировали 3D-модель сердца и коронарных вен (рис. 2, a), используя специализированную рабочую станцию Adwantage Workstation VolumeShare® (GE Healthcare, Соединённые Штаты Америки). На основе полученной модели проводили оценку анатомии вен сердца. После этого выполняли совмещение результатов 3D-реконструкции коронарных вен с изображениями ПСМ (см. рис. 2, b). На основании полученных данных определяли вену коронарного синуса для установки левожелудочкового электрода. Вену считали целевой при её соответствии зоне без наличия гипоперфузии (накопление РФП в сегменте >50%). Сегменты ЛЖ со снижением накопления РФП <50% (Summed Rest Score, SRS — более 2 баллов) исключали при выборе места установки электрода.

Рис. 2. 3D-реконструкция сердца и коронарного синуса: a — модель по данным компьютерной томографии; b — совмещение данных компьютерной томографии коронарных вен с результатами перфузионной сцинтиграфии миокарда левого желудочка.
Общая эффективная лучевая нагрузка двух исследований составила ~8,33 мЗв.
Пациентам обеих групп имплантировали кардиоресинхронизирующее устройство с функцией дефибрилляции по стандартной методике для бивентрикулярной электрокардиостимуляции. Программирование осуществляли в соответствии с международными стандартами [16].
Основной исход исследования
Первичная конечная точка исследования — ответ на СРТ через 6 мес. после вмешательства, оценённый по данным ЭхоКГ. Среди критериев положительного ответа выделяли: снижение КСО ЛЖ и/или увеличение его ФВ на 15 и 5% и более соответственно.
Дополнительные исходы исследования
Вторичная конечная точка исследования — наступление неблагоприятного сердечно-сосудистого события: развитие больших сердечно-сосудистых событий (MACE); смерть по причине сердечно-сосудистой патологии; госпитализация в связи с декомпенсацией ХСН.
Анализ в группах
Проспективно набрана первая группа — группа визуализации. Всем пациентам этой группы перед проведением СРТ выполняли комплекс лучевых методов исследования, включающий КТ-венографию сердца с контрастированием для оценки анатомических особенностей коронарных вен и ПСМ для оценки миокардиальной перфузии ЛЖ.
Ретроспективно набрана группа сравнения. Пациентам этой группы имплантацию ресинхронизирующего устройства проводили по стандартной методике без предоперационной оценки анатомии коронарных вен и наличия рубцовых изменений.
Методы регистрации исходов
Оценку исходов проводили с помощью ЭхоКГ, выполненной через 6 мес. после интервенционного вмешательства.
Этическая экспертиза
Проведение исследования одобрено комитетом по биомедицинской этике НИИ кардиологии Томского НИМЦ (протокол № 232 от 26.10.2022).
Все участники исследования добровольно подписали форму информированного согласия до включения в исследование.
Статистический анализ
Принципы расчёта выборки. Размер выборки предварительно не рассчитывался.
Методы статистического анализа данных. Статистическую обработку результатов проводили с использованием программного пакета MedCalc® 12.1.14.0 (MedCalc Software Ltd, Бельгия) и STATISTICA® 10.0 (StatSoft Inc., Соединённые Штаты Америки). Количественные признаки представлены в виде Me [Q1; Q3], где Me — медиана, Q1 и Q3 — 1- и 3-й квартиль соответственно. Нормально распределённые количественные показатели представлены в виде M±SD, где M — среднее значение, SD — стандартное отклонение. Категориальные показатели представлены в виде абсолютных (n) и относительных (%) частот. Статистическую значимость межгрупповых различий количественных признаков оценивали в соответствии с непараметрическим критерием Манна–Уитни. Категориальные показатели сравнивали с помощью точного критерия Фишера. Статистически значимыми считали различия при p <0,05.
РЕЗУЛЬТАТЫ
Объекты исследования
Клинико-демографическая характеристика пациентов и данные ЭхоКГ в группах представлены в табл. 1. Группы статистически значимо не различались по клиническим характеристикам, объёму и сократимости ЛЖ по данным ЭхоКГ.
Таблица 1. Клинико-демографическая характеристика пациентов группы визуализации и сравнения
Показатель | Группа визуализации (n=40) | Группа сравнения (n=30) | p |
Пол (мужчины/женщины), n | 26/14 | 16/14 | 0,338 |
Возраст, лет | 59,5 [55; 68] | 58 [48; 64] | 0,183 |
Сердечная недостаточность: функциональный класс NYHA II/III, n | 22/18 | 11/19 | 0,224 |
Этиология хронической сердечной недостаточности (ишемическая/неишемическая), n | 15/25 | 10/20 | 0,804 |
Длительность комплекса QRS, мс | 171 [160; 184] | 166 [160; 180] | 0,284 |
Сахарный диабет, n (%) | 5 (12) | 3 (10) | 0,712 |
Индекс массы тела | 0,446 | ||
Конечно-диастолический объём левого желудочка, мл | 240 [210; 283] | 226 [190; 54] | 0,202 |
Конечно-систолический объём левого желудочка, мл | 181 [146; 203] | 161 [125; 195] | 0,306 |
Фракция выброса левого желудочка, % | 30 [25; 32] | 29 [21; 32] | 0,711 |
Примечание. Данные представлены в виде Me [Q1; Q3], где Me — медиана, Q1 и Q3 — 1- и 3-й квартиль соответственно; NYHA — Нью-Йоркская ассоциация сердца. | |||
Основные результаты исследования
В группе визуализации у всех пациентов левожелудочковый электрод имплантировали в целевую вену, выбранную по результатам 3D-реконструкции коронарного синуса, совмещённой с данными ПСМ. В группе сравнения его размещали по стандартной методике без применения данных визуализации. Частота использования различных коронарных вен в качестве целевой продемонстрирована в табл. 2. Следует отметить, что между группами выявлены статистически значимые различия по частоте выбора боковой вены в качестве целевой для установки левожелудочкового электрода (p=0,015); в остальных случаях статистически значимых различий не выявлено.
Таблица 2. Частота использования различных вен в качестве целевой при имплантации левожелудочкового электрода в группах
Целевая вена | Группа визуализации, n (%) | Группа сравнения, n (%) |
Боковая вена | 24 (60) | 8 (27) |
Заднебоковая вена | 10 (25) | 14 (47) |
Переднебоковая вена | 4 (10) | 6 (20) |
Задняя вена левого желудочка | 2 (5) | 2 (6) |
Для оценки влияния визуализирующего подхода на ход операции проанализированы значения дозы и времени флюороскопии во время операции. Статистически значимых различий между группами по этим показателям не выявлено (табл. 3). При этом необходимо учитывать дозу облучения, полученную пациентами группы визуализации при проведении дополнительных лучевых исследований на предоперационном этапе [средняя эффективная эквивалентная доза на весь протокол исследования составила 8,2±0,8 мЗв (от 7,6 до 9,1) на пациента].
Таблица 3. Сравнение дозы и времени флюороскопии во время операции в группах визуализации и сравнения
Показатель | Группа визуализации | Группа сравнения | p |
Эффективная доза облучения, мЗв | 0,082 | ||
Время флюороскопии, мин | 15,5 [10; 18] | 15 [10; 17] | 0,832 |
Примечание. Данные представлены в виде Me [Q1; Q3], где Me — медиана, Q1 и Q3 — 1- и 3-й квартиль соответственно. | |||
Через 6 мес. после интервенционного вмешательства получены статистически значимые различия частоты достижения первичной конечной точки (p=0,031):
- в группе визуализации — 33 пациента (82%);
- в группе сравнения — 17 пациентов (57%).
В обеих группах достижения вторичной конечной точки не выявлено.
Сравнительная характеристика изменений объёма и сократимости ЛЖ после СРТ в исследуемых группах продемонстрирована в табл. 4.
Таблица 4. Сравнительная характеристика изменений объёма и сократимости левого желудочка после сердечной ресинхронизирующей терапии в группах визуализации и сравнения
Показатель | Группа визуализации | Группа сравнения | p |
Δ Конечно-систолический объём левого желудочка, мл | −52 [−71; −22,5] | −21 [−64; −1] | 0,0391 |
Δ Фракции выброса левого желудочка, % | 4,5 [0; 13] | 0,082 | |
Примечание. Данные представлены в виде Me [Q1; Q3], где Me — медиана, Q1 и Q3 — 1- и 3-й квартиль соответственно; 1 — статистически значимые различия между группами. | |||
ОБСУЖДЕНИЕ
Резюме основного результата исследования
По результатам данного исследования установлено, что для повышения эффективности СРТ важную роль в планировании интервенционного вмешательства играет комплексный визуализирующий подход, включающий КТ-венографию сердца для оценки анатомии коронарных вен и ПСМ для выявления зоны рубцовых изменений миокарда ЛЖ. Применение данной стратегии ассоциировано с увеличением числа пациентов, ответивших на СРТ, а также более значительным снижением КСО ЛЖ после операции.
Обсуждение основного результата исследования
Известно, что одним из факторов, приводящих к отсутствию ответа на проводимую СРТ, является неоптимальное расположение левожелудочкового электрода. В ранее проведённых исследованиях показано, что имплантация данного электрода в область рубца не приводит к значимому улучшению гемодинамики после СРТ. При этом установка левожелудочкового электрода в вену сердца, соответствующую жизнеспособному миокарду, а также области поздней механической активации может быть полезна для повышения частоты и эффективности имплантаций ресинхронизирующих устройств [17]. Понимание анатомии коронарных вен перед имплантацией устройства позволяет спланировать ход операции, оценить соответствующий доступ к оптимальному месту стимуляции. Кроме того, это позволяет сократить время операции, лучевую нагрузку на пациента и объём используемого контрастного вещества.
Эффективность СРТ зависит от наличия достаточного количества жизнеспособного миокарда, который сможет сокращаться в ответ на стимуляцию. Метод магнитно-резонансной томографии является «золотым стандартом» количественной оценки рубцовых изменений в миокарде и рекомендован пациентам с ХСН [18]. Однако его широкое применение ограничивает сложность и длительность кардио-протокола, высокая стоимость исследования, а также необходимость введения контрастного препарата. Альтернативным методом оценки выраженности рубцовых изменений в миокарде ЛЖ может выступать ПСМ, которая характеризуется относительной доступностью и простотой выполнения. Она имеет высокую внутри- и межоператорскую воспроизводимость [19], не требует введения контрастного вещества. В нашем исследовании продемонстрирована высокая эффективность применения ПСМ и КТ-венографии для оптимального выбора целевой вены при имплантации левожелудочкового электрода СРТ.
Результаты представленного исследования согласуются с данными работ, опубликованных ранее. Так, T. Tada и соавт. [20] предложили способ оптимизации эффективности имплантации ресинхронизирующего устройства, основанный на анализе предоперационных результатов ПСМ и КТ-венографию сердца с контрастированием. Используя полученные данные, авторы оценивали анатомию коронарных вен и миокардиальную перфузию ЛЖ с целью определения оптимального места для имплантации и подбора левожелудочкового электрода, соответствующего анатомическим особенностям целевой вены. У всех пациентов отмечен положительный ответ на СРТ. Однако данный метод не апробирован на большой выборке пациентов (включено 4 пациента). Результаты нашего исследования показали, что применение методов кардиовизуализации для предоперационной оценки анатомии коронарного синуса и перфузии миокарда способствует увеличению доли пациентов, положительно ответивших на СРТ. При использовании данного подхода доля респондеров1 достигает 82%, тогда как в группе сравнения — 57% (p=0,031).
По данным литературы, мультимодальный визуализирующий подход перед имплантацией кардиоресинхронизирующего устройства может способствовать снижению неблагоприятных воздействий на пациента за счёт сокращения времени операции, объёма контрастного вещества и времени лучевого воздействия. Однако в нашем исследовании не выявлено статистически значимых различий по времени рентгеноскопии и эффективной дозы облучения, полученной во время операции у пациентов двух групп. Тем не менее проведение КТ-венографии и ПСМ перед выполнением СРТ предоставляет врачу дополнительную информацию для подбора левожелудочкового электрода с оптимальной длиной и формой изгиба, соответствующими анатомии целевой вены.
Ограничения исследования
Ограничением данного исследования является небольшой объём выборки.
Кроме того, при планировании и проведении исследования размер выборки для достижения требуемой статистической мощности результатов не рассчитывали. В связи с этим полученная в ходе исследования выборка участников не может считаться в достаточной степени репрезентативной, что не позволяет экстраполировать полученные результаты и их интерпретацию на генеральную совокупность аналогичных пациентов за пределами исследования.
ЗАКЛЮЧЕНИЕ
Применение методов сердечно-сосудистой визуализации, включая КТ-венографию сердца и ПСМ, позволяет определить оптимальное место для имплантации левожелудочкового электрода при планировании СРТ. Такой подход ассоциирован c увеличением доли пациентов, положительно отвечающих на неё. Тем не менее необходимы дальнейшие многоцентровые исследования для выявления его клинической эффективности.
ДОПОЛНИТЕЛЬНАЯ ИНФОРМАЦИЯ
Вклад авторов. А.И. Мишкина — проведение и интерпретация лучевых исследований, сбор и анализ литературных данных, заполнение и анализ базы данных, написание и редактирование текста рукописи; Т.А. Атабеков — отбор и курация пациентов, хирургическое лечение пациентов, сбор и анализ клинической части базы данных, сбор и анализ литературных данных, написание и редактирование текста рукописи; С.И. Сазонова, Р.Е. Баталов, С.В. Попов — сбор и анализ литературных данных, написание и редактирование текста рукописи; К.В. Завадовский — концепция исследования, сбор и анализ литературных данных, написание и редактирование текста рукописи. Все авторы одобрили рукопись (версию для публикации), а также согласились нести ответственность за все аспекты работы, гарантируя надлежащее рассмотрение и решение вопросов, связанных с точностью и добросовестностью любой её части.
Этическая экспертиза. Исследование одобрено комитетом по биомедицинской этике НИИ кардиологии Томского НИМЦ (протокол № 232 от 26.10.2022). Все участники исследования добровольно подписали форму информированного согласия до включения в исследование.
Источники финансирования. Отсутствуют.
Раскрытие интересов. Авторы заявляют об отсутствии отношений, деятельности и интересов за последние три года, связанных с третьими лицами (коммерческими и некоммерческими), интересы которых могут быть затронуты содержанием статьи.
Оригинальность. При создании настоящей работы авторы не использовали ранее опубликованные сведения (текст, иллюстрации, данные).
Доступ к данным. Редакционная политика в отношении совместного использования данных к настоящей работе не применима.
Генеративный искусственный интеллект. При создании настоящей статьи технологии генеративного искусственного интеллекта не использовали.
Рассмотрение и рецензирование. Настоящая работа подана в журнал в инициативном порядке и рассмотрена по обычной процедуре. В рецензировании участвовали один внешний рецензент и один член редакционной коллегии журнала.
ADDITIONAL INFORMATION
Author contributions: A.I. Mishkina: investigation, data curation, writing—original draft, writing—review & editing; T.A. Atabekov: investigation, data curation, writing—original draft, writing—review & editing; S.I. Sazonova, R.E. Batalov, S.V. Popov: data curation, writing—original draft, writing—review & editing; K.V. Zavadovsky: conceptualization, data curation, writing—original draft, writing—review & editing. All the authors approved the version of the manuscript to be published and agreed to be accountable for all aspects of the work, ensuring that questions related to the accuracy or integrity of any part of the work are appropriately investigated and resolved.
Ethics approval: The study was approved by the Committee on Biomedical Ethics of the Cardiology Research Institute, Tomsk National Research Medical Center (protocol No. 232 dated October 26, 2022). All the participants provided written informed consent prior to inclusion in the study.
Funding sources: No funding.
Disclosure of interests: The authors have no relationships, activities, or interests for the last three years related to for-profit or not-for-profit third parties whose interests may be affected by the content of the article.
Statement of originality: No previously published material (text, images, or data) was used in this work.
Data availability statement: The editorial policy regarding data sharing does not apply to this work.
Generative AI: No generative artificial intelligence technologies were used to prepare this article.
Provenance and peer-review: This paper was submitted unsolicited and reviewed following the standard procedure. The peer review process involved an external reviewer and a member of the editorial board.
1 Респондер — пациент, положительно реагирующий на лечение, то есть показывающий ожидаемый положительный эффект на терапию.
About the authors
Anna I. Mishkina
Tomsk National Research Medical Centre, Russian Academy of Sciences
Author for correspondence.
Email: anna123.2013@gmail.com
ORCID iD: 0000-0001-9453-1635
SPIN-code: 9792-6033
MD, Cand. Sci. (Medicine), Cardiology Research Institute
Russian Federation, TomskTariel A. Atabekov
Tomsk National Research Medical Centre, Russian Academy of Sciences
Email: kgma1011@mail.ru
ORCID iD: 0000-0003-2645-4142
SPIN-code: 3274-6898
MD, Cand. Sci. (Medicine), Cardiology Research Institute
Russian Federation, TomskSvetlana I. Sazonova
Tomsk National Research Medical Centre, Russian Academy of Sciences
Email: sazonova_si@mail.ru
ORCID iD: 0000-0003-2799-3260
SPIN-code: 3787-2774
MD, Dr. Sci. (Medicine), Cardiology Research Institute
Russian Federation, TomskRoman E. Batalov
Tomsk National Research Medical Centre, Russian Academy of Sciences
Email: romancer@cardio-tomsk.ru
ORCID iD: 0000-0003-1415-3932
SPIN-code: 1371-4429
MD, Dr. Sci. (Medicine), Cardiology Research Institute
Russian Federation, TomskSergey V. Popov
Tomsk National Research Medical Centre, Russian Academy of Sciences
Email: svp@cardio-tomsk.ru
ORCID iD: 0000-0002-9050-4493
SPIN-code: 6853-7180
MD, Dr. Sci. (Medicine), Professor, academician of the Russian Academy of Science, Cardiology Research Institute
Russian Federation, TomskKonstantin V. Zavadovsky
Tomsk National Research Medical Centre, Russian Academy of Sciences
Email: konstzav@gmail.com
ORCID iD: 0000-0002-1513-8614
SPIN-code: 5081-3495
MD, Dr. Sci. (Medicine), Cardiology Research Institute
Russian Federation, TomskReferences
- Abdin A, Anker SD, Butler J, et al. “Time is prognosis” in heart failure: time-to-treatment initiation as a modifiable risk factor. ESC Heart Failure. 2021;8(6):4444–4453. doi: 10.1002/ehf2.13646 EDN: FYILWM
- Garganeeva AA, Bauer VA, Borel KN. The pandemic of the xxi century: chronic heart failure is the burden of the modern society. Epidemiology (literature review). The Siberian Medical Journal. 2014;29(3):8–12. EDN: TWKRHJ
- Sze E, Samad Z, Dunning A, et al. Impaired recovery of left ventricular function in patients with cardiomyopathy and left bundle branch block. Journal of the American College of Cardiology. 2018;71(3):306–317. doi: 10.1016/j.jacc.2017.11.020 EDN: YHSJTF
- ESC guidelines on cardiac pacing and cardiac resynchronization therapy. Russian Journal of Cardiology. 2022;27(7):289–370. doi: 10.15829/1560-4071-2022-5159 EDN: UTOLNY
- Tokavanich N, Mongkonsritragoon W, Sattawatthamrong S, et al. Outcomes of cardiac resynchronization therapy in congenital heart disease: A meta-analysis and systematic review. Journal of Cardiovascular Electrophysiology. 2023;35(2):249–257. doi: 10.1111/jce.16144 EDN: TNDOUD
- Daubert C, Behar N, Martins RP, et al. Avoiding non-responders to cardiac resynchronization therapy: a practical guide. European Heart Journal. 2017;38(19):1463–1472. doi: 10.1093/eurheartj/ehw270 EDN: YDAKAX
- Dhesi S, Lockwood E, Sandhu RK. Troubleshooting Cardiac Resynchronization Therapy in Nonresponders. Canadian Journal of Cardiology. 2017;33(8):1060–1065. doi: 10.1016/j.cjca.2017.04.007
- Zou J, Hua W, Su Y, et al. SPECT-Guided LV lead placement for incremental CRT efficacy. JACC: Cardiovascular Imaging. 2019;12(12):2580–2583. doi: 10.1016/j.jcmg.2019.07.009
- Hu X, Xu H, Hassea SRA, et al. Comparative efficacy of image-guided techniques in cardiac resynchronization therapy: a meta-analysis. BMC Cardiovascular Disorders. 2021;21(1):255. doi: 10.1186/s12872-021-02061-y EDN: IZWCJW
- Borgquist R, Carlsson M, Markstad H, et al. Cardiac resynchronization therapy guided by echocardiography, MRI, and CT Imaging. JACC: Clinical Electrophysiology. 2020;6(10):1300–1309. doi: 10.1016/j.jacep.2020.05.011 EDN: DOYWDC
- Zavadovskij KV, Saushkin VV, Varlamova YV, et al. Mechanical dyssynchrony for prediction of the cardiac resynchronization therapy response in patients with dilated cardiomyopathy. Kardiologiia. 2021;61(7):14–21. doi: 10.18087/cardio.2021.7.n1420 EDN: JWDUSY
- Viveiros Monteiro A, Martins Oliveira M, Silva Cunha P, et al. Time to left ventricular reverse remodeling after cardiac resynchronization therapy: Better late than never. Revista Portuguesa de Cardiologia. 2016;35(3):161–167. doi: 10.1016/j.repc.2015.11.008
- Mareev VYu, Fomin IV, Ageev FT, et al. Russian Heart Failure Society, Russian Society of Cardiology. Russian Scientific Medical Society of Internal Medicine Guidelines for Heart failure: chronic (CHF) and acute decompensated (ADHF). Diagnosis, prevention and treatment. Kardiologiia. 2018;17(S6):8–158. doi: 10.18087/cardio.2475 EDN: XUAREL
- Butter C, Georgi C, Stockburger M. Optimal CRT implantation—where and how to place the left-ventricular lead? Current Heart Failure Reports. 2021;18(5):329–344. doi: 10.1007/s11897-021-00528-9 EDN: PMWWDH
- Boonyasirinant T, Halliburton SS, Schoenhagen P, et al. Absence of coronary sinus tributaries in ischemic cardiomyopathy: An insight from multidetector computed tomography cardiac venographic study. Journal of Cardiovascular Computed Tomography. 2016;10(2):156–161. doi: 10.1016/j.jcct.2016.01.015
- Stiles MK, Fauchier L, Morillo CA, Wilkoff BL. 2019 HRS/EHRA/APHRS/LAHRS focused update to 2015 expert consensus statement on optimal implantable cardioverter-defibrillator programming and testing. Heart Rhythm. 2020;17(1):e220–e228. doi: 10.1016/j.hrthm.2019.02.034 EDN: RFAGXG
- Wang J, Wang Y, Yang M, et al. Mechanical contraction to guide CRT left-ventricular lead placement instead of electrical activation in myocardial infarction with left ventricular dysfunction: An experimental study based on non-invasive gated myocardial perfusion imaging and invasive electroanatomic mapping. Journal of Nuclear Cardiology. 2020;27(2):419–430. doi: 10.1007/s12350-019-01710-2 EDN: DVOUZZ
- ESC guidelines for the diagnosis and treatment of acute and chronic heart failure. Russian Journal of Cardiology. 2023;28(1):117–224.
- Mansour N, Nekolla SG, Reyes E, et al. Multi-center study of inter-rater reproducibility, image quality, and diagnostic accuracy of CZT versus conventional SPECT myocardial perfusion imaging. Journal of Nuclear Cardiology. 2023;30(2):528–539. doi: 10.1007/s12350-022-03054-w EDN: XJIKCA
- Tada T, Osuda K, Nakata T, et al. A novel approach to the selection of an appropriate pacing position for optimal cardiac resynchronization therapy using CT coronary venography and myocardial perfusion imaging: FIVE STaR method (fusion image using CT coronary venography and perfusion SPECT applied for cardiac resynchronization therapy). Journal of Nuclear Cardiology. 2021;28(4):1438–1445. doi: 10.1007/s12350-019-01856-z
Supplementary files

