

")


Fuzzy controller design for predicting the systolic area of photoplethysmogram signal using Persian medicine pulsology
- Authors: Dehghandar M.1, Mirhosseini-Alizamini S.M.1, Vaghasloo M.A.2,3,4, Najafabadi A.K.1
-
Affiliations:
- Payame Noor University
- Tehran University of Medical Sciences
- Persian Medicine Network
- Universal Scientific Education and Research Network
- Issue: Vol 6, No 3 (2025)
- Pages: 414-426
- Section: Original Study Articles
- Submitted: 08.09.2024
- Accepted: 12.11.2024
- Published: 14.10.2025
- URL: https://jdigitaldiagnostics.com/DD/article/view/635802
- DOI: https://doi.org/10.17816/DD635802
- EDN: https://elibrary.ru/CQCNLE
- ID: 635802

Cite item
Full Text

Abstract
BACKGROUND: Photoplethysmography, a method used to measure blood volume changes per pulse, is widely applied in healthcare. In Persian medicine, pulsology is considered one of the most important methods for clinical diagnosis. However, recently the theory of fuzzy sets has provided a valuable foundation for developing knowledge-based systems in medical research.
AIM: To estimate and predict the systolic area of photoplethysmography signals using Persian medicine pulsology, by leveraging the potential of fuzzy systems.
METHODS: To design the fuzzy controller, a Persian medicine specialist simultaneously recorded data on PM pulse characteristics including pulse frequency and pulse strength—along with photoplethysmography signals, from 55 healthy volunteers. Initially, rules were generated based on the input and output variables. After evaluating these rules using the collected data, 35 were retained and presented in a two-input–one-output lookup table.
RESULTS: The fuzzy system was then constructed using MATLAB. It included 35 rules, triangular and trapezoidal membership functions, a singleton fuzzifier, a product inference engine, and a center-average defuzzifier. This system, which used pulse frequency and pulse strength as inputs and provided the systolic area as output, demonstrated acceptable performance within the defined input range.
CONCLUSIONS: The proposed fuzzy controller system reasonably predicted the systolic area of photoplethysmography signals using Persian medicine pulse parameters. The results revealed that increasing pulse frequency decreased the systolic area, while increasing pulse strength increased it, in alignment with previous results. Therefore, this system may boost the clinical skills of Persian medicine students and practitioners. It also holds promise for application in disease diagnosis and prediction and for facilitating integration between Persian medicine and mainstream medicine.
Keywords
Full Text
ОБОСНОВАНИЕ
Научные и технологические достижения обусловливают существенное повышение сложности процессов принятия решений, что приводит к увеличению времени реакции и прерыванию последующих операций. Сложность дополнительно возрастает в связи с неопределённостью, которая может принимать различные формы и влиять на результаты процессов принятия решений. Данные часто бывают неполными, неточными, неоднозначными и даже противоречивыми. В большинстве случаев неопределённость можно контролировать с использованием нечёткой логики — метода прогнозирования, включающего разработку систем на основе нечётких правил [1–3]. Согласно результатам исследований, методы нечёткой логики представляют ценность для ранней диагностики заболеваний, которая имеет ключевое значение для разработки более эффективных планов лечения [4, 5].
Персидская традиционная медицина — одна из наиболее развитых школ традиционной медицины, которая вызывает значительный интерес исследователей. Её активно изучают во многих странах, включая Иран, где она зародилась. Особое место в этой системе занимает пульсовая диагностика, которую на протяжении веков использовали для оценки состояния здоровья пациента и стадии заболевания [6, 7]. Учитывая, что более четверти содержания фундаментальных трудов по персидской традиционной медицине посвящено именно этому методу, пульсовую диагностику можно рассматривать как перспективное направление, дополняющее современные стандартные обследования [8, 9]. В последние годы активно изучают возможности применения технологий искусственного интеллекта, таких как нечёткие системы, для развития методов пульсовой диагностики персидской традиционной медицины и их интеграции в стандартную диагностику [10–13]. Однако сохраняются сложности, связанные с интерпретацией результатов пульсовой диагностики врачами и обучением студентов в данной области. Фотоплетизмография (ФПГ) — это метод оценки изменений объёма крови при каждом сердечном сокращении. Его широко применяют в медицине для оценки жизненно важных физиологических параметров [14, 15]. Особое внимание уделяется роли ФПГ в пульсовой диагностике персидской традиционной медицины.
Персидская традиционная медицина — одна из наиболее развитых школ традиционной медицины, внёсшая существенный вклад в здравоохранение за свою многовековую историю. Специалисты данной области тысячелетиями применяли пульсовую диагностику для оценки состояния здоровья пациента [5, 16]. В персидской традиционной медицине, как и в современной физиологии, пульс определяют как ритмические колебания стенки артерии, обусловленные сокращениями сердца и выбросом крови. Каждый сердечный цикл включает две фазы (сокращение и расслабление), с двумя паузами между ними. При оценке состояния здоровья пациента используют различные параметры пульса. К ним относятся трёхмерное расширение, сила, частота, состояние кожи и тканей, наполнение и целостность кровеносных сосудов, скорость, однородность колебаний пульса и наполнение пульса [17–19].
ФПГ — это неинвазивный метод оценки изменений объёма крови при каждом сердечном сокращении [14]. Её широко применяют в медицине для оценки различных физиологических параметров. Кроме того, ФПГ используют для оценки содержания глюкозы в крови, частоты сердечных сокращений, степени насыщения крови кислородом и артериальной жёсткости [15]. При ФПГ датчик обычно размещают на коже; он оборудован фотодетектором для регистрации изменений поглощения света за заданный период времени. Сигнал фотоплетизмограммы отражает частоту сердечных сокращений и включает непульсирующие частотные компоненты, на которые влияют такие факторы, как дыхание и активность симпатической нервной системы [14, 15]. Анализ формы пульсовой волны включает выделение характерных признаков сигнала фотоплетизмограммы, регистрируемого с использованием одного датчика. Усовершенствованные инструменты анализа данных и вычислительная техника значительно упростили предобработку и постобработку физиологических сигналов, включая их форму [14]. Амплитуда систолической волны, определяемая как максимальная амплитуда во время систолической фазы сигнала фотоплетизмограммы, относится к пульсирующим компонентам объёма крови [20]. Она тесно связана с ударным объёмом крови, который, в свою очередь, пропорционален расширению просвета кровеносных сосудов на участке измерения [21, 22].
В последние годы ФПГ стала объектом интереса исследователей в связи с растущей потребностью в простых, низкозатратных и портативных технологиях, подходящих для применения при оказании первичной и внебольничной медицинской помощи. Технологии, основанные на ФПГ, применяют в различных коммерчески доступных медицинских изделиях для измерения степени насыщения крови кислородом, сердечного выброса и артериального давления, оценки автономной функции сердца и диагностирования заболеваний периферических сосудов. Например, в работе J. Allen [23] предложены и проиллюстрированы общие принципы ФПГ, демонстрирующие возможности применения данной технологии для широкого диапазона клинических оценок. H. Liu и соавт. [24] предложили метод оценки времени распространения пульсовой волны с использованием двух камер, расположенных друг напротив друга, для одновременной регистрации сигналов фотоплетизмограммы. Одна камера регистрирует сигнал на кончике указательного пальца, а вторая — в височной области. В 2020 году M.H. Chowdhury и соавт. [25] разработали метод оценки артериального давления с использованием сигнала фотоплетизмограммы и алгоритмов машинного обучения.
J. Park и соавт. [22] оценили ФПГ с инженерной точки зрения, обобщив результаты предыдущих исследований и рассмотрев принципы измерений и механизмы в основе этого метода, характеристики сигнала и связанные технологии предобработки и постобработки, а также текущую роль ФПГ и перспективы её дальнейшего развития. Кроме того, в последние годы растёт применение технологий искусственного интеллекта и нечётких систем в персидской традиционной медицине. Например, M. Dehghandar и соавт. [12] применяли нечёткую логику к факторам поддержания нормального пульса с использованием параметров пульсовой диагностики персидской традиционной медицины. Разработанная авторами модель основана на 10 входных переменных, трёх выходных переменных и 25 правилах. V.R. Nafisi и соавт. [13] оценивали применение системы дистанционной медицины, основанной на принципах персидской традиционной медицины. В данной системе использовали тепловую камеру для измерения температуры и влажности, а также специально разработанное устройство для регистрации характеристик пульса на запястье. В 2022 году V.R. Nafisi и соавт. [10] разработали автономный воспроизводимый метод с использованием данных 34 участников. Его применяли для оценки характеристик пульса на запястье. M. Dehghandar и соавт. [6] оценивали градиент давления в плечевой артерии у мужчин с использованием 11 входных переменных, одной выходной переменной и 36 правил. Кроме того, авторы описали возможность получения этого градиента с использованием параметров пульсовой диагностики персидской традиционной медицины.
ЦЕЛЬ
Оценка и прогнозирование систолического индекса площади по сигналам фотоплетизмограммы с использованием пульсовой диагностики персидской традиционной медицины и возможностей нечётких систем.
МЕТОДЫ
Дизайн исследования
С учётом отсутствия аналогичных исследований, настоящее исследование проводили как наблюдательное одноцентровое одномоментное пилотное.
Условия проведения исследования
Исследование проводили в сотрудничестве с клиникой персидской традиционной медицины «Ахмадие» при Тегеранском медицинском университете. Для разработки нечёткого регулятора применяли соответствующие концепции персидской традиционной медицины, сигналы фотоплетизмограммы и нечёткие системы.
Критерии соответствия
В исследовании участвовали здоровые добровольцы в возрасте 7–69 лет; пациентов с подтверждёнными сердечно-сосудистыми заболеваниями исключали из исследования.
Нечёткие системы
Нечёткую логику широко используют в различных областях науки. Её и связанные с ней правила активно применяют в технологиях искусственного интеллекта с использованием недетерминированных данных. Нечёткое множество A в универсальном множестве U определяется уравнением (1) со значениями в интервале [0, 1].
(1)
Таким образом, нечёткое множество — это обобщение классического множества. Оно допускает использование только двух значений (0 или 1), в то время как функция принадлежности нечётких множеств непрерывна в интервале [0; 1]. Нечёткая экспертная система обычно состоит из четырёх компонентов:
- программы введения нечёткости для входных данных;
- базы правил;
- механизма логического вывода;
- программы восстановления чёткости для выходных данных.
Ключевой аспект настоящего исследования — формирование таблицы нечётких правил для разработки нечёткой системы. Следующие пять этапов описывают процесс разработки нечёткой системы с использованием справочной таблицы:
- этап 1 — определение соответствующих нечётких множеств, отражающих области ввода и вывода;
- этап 2 — генерация нечётких правил на основании входных и выходных переменных;
- этап 3 — присвоение степени истинности каждому установленному правилу;
- этап 4 — формирование базы нечётких правил и разработка нечёткой системы в соответствии с ней;
- этап 5 — разработка нечёткой системы на основании базы нечётких правил.
Если нечёткую систему разрабатывают в соответствии с этапами, указанными выше, с использованием одноэлементной программы введения нечёткости, механизма логического вывода для продукта и программы восстановления чёткости по среднему центру, форма итогового нечёткого регулятора будет соответствовать уравнению (2). Это непрерывный ограниченный кусочно-линейный регулятор:
(2)
где — входная переменная; а — центр выходного нечёткого множества. Параметры характеризуют входные нечёткие множества, где — центр симметрии этих множеств. Параметр n отражает количество входных переменных, а параметр 2N+1 — количество нечётких правил в системе. Для обеспечения симметрии определений функции принадлежности N нечётких множеств помещают слева от центральной точки, N нечётких множеств — справа от центральной точки и одно нечёткое множество — в центральной точке. Следует отметить, что нечёткая система, определяемая уравнением (2), может аппроксимировать любую непрерывную функцию к желаемому уровню точности [26].
Разработка нечёткой системы с использованием параметров персидской традиционной медицины и фотоплетизмографии
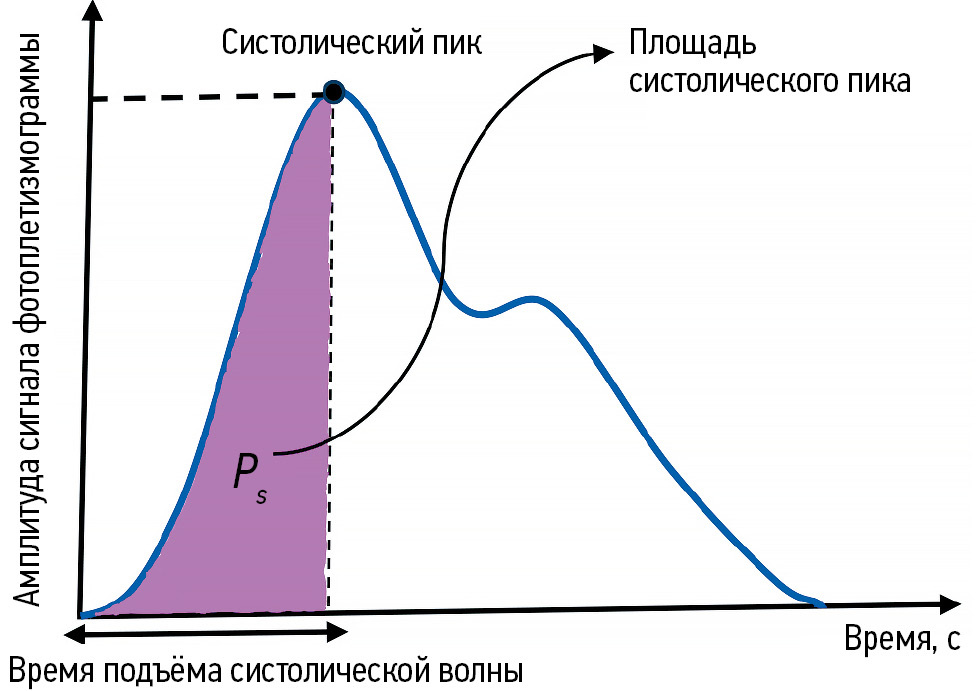
Амплитуда систолической волны, систолический пик и время подъёма систолической волны — это последовательные фазы сердечного цикла с подтверждённой диагностической и прогностической ценностью при оценке общей функции сердца [22, 23, 27]. Соответственно, в настоящем исследовании оценивали систолический индекс площади, отражающий характеристики, описанные выше. На рис. 1 представлен сигнал фотоплетизмограммы с указанием систолического пика и времени подъёма систолической волны, кроме того, отмечена площадь систолического пика (Ps).

Рис. 1. Сигнал фотоплетизмограммы, указывающий на площадь систолического пика. Ps — систолический индекс площади.
Частота и сила пульса в персидской традиционной медицине — это параметры с наиболее выраженной связью с систолическим индексом площади для сигнала фотоплетизмограммы [8, 27]. Соответственно, в настоящем исследовании оценивали два ключевых параметра пульса: частоту и силу. Повышение силы пульса непосредственно увеличивает объём крови на сердечное сокращение в систолической фазе, поэтому данный параметр положительно коррелирует с систолическим индексом площади. Напротив, при повышении частоты пульса объём крови на сердечное сокращение в систолической фазе уменьшается, что указывает на обратную корреляцию с систолическим индексом площади [12, 27].
Систолический индекс площади для сигнала фотоплетизмограммы оценивали с использованием отдельных параметров пульсовой диагностики персидской традиционной медицины.
Для разработки системы специалист по персидской традиционной медицине регистрировал частоту и силу пульса. Эти параметры оценивали и классифицировали с использованием двух шкал. Для частоты пульса применяли шкалу от 1 до 7 (крайне низкая, очень низкая, низкая, средняя, высокая, очень высокая и крайне высокая соответственно), а для силы пульса — шкалу от 1 до 5 (очень низкая, низкая, средняя, высокая и очень высокая соответственно). Одновременно регистрировали сигналы фотоплетизмограммы для каждого участника с использованием пульсоксиметра Beurer® PO 80 (Beurer GmbH, Германия) в течение 5 с. Систолический индекс площади, соответствующий каждому сигналу фотоплетизмограммы (см. рис. 1), приблизительно рассчитывали с использованием инструмента Image Processing Toolbox в MATLAB® R2021b (The MathWorks, Inc., CША). На основании определённых координат, полученные значения варьировали от 660 до 1210. Для целей настоящего исследования частота пульса обозначена как F, сила пульса — как S, а систолический индекс площади — как Ps. Целью была разработка нечёткого регулятора, который использует F и S в качестве входных переменных и генерирует Ps в качестве выходной переменной. Общие характеристики частоты пульса (F), силы пульса (S) и систолического индекса площади Ps для 55 участников обобщены в табл. 1.
Таблица 1. Общие характеристики частоты пульса (F), силы пульса (S) и систолического индекса площади (Ps) здоровых добровольцев | |||||
Переменные | Max | Min | Mean | Женский пол | Мужской пол |
n | — | — | — | 15 | 40 |
Возраст, лет | 69 | 7 | 25,9 | 43,3 | 19,4 |
Частота пульса (F) | 7 | 1 | 4,2 | 3,8 | 4,4 |
Сила пульса (S) | 5 | 1 | 3,1 | 2,9 | 3,2 |
Систолический индекс площади (Ps) | 1210 | 660 | 973 | 940 | 985 |
Согласно данным табл. 1, предельные значения для переменных определены следующим образом:
(3)
где U — область ввода; V — область вывода. Учитывая отсутствие аналогичных результатов других исследований, формирование выборки в соответствии с целями настоящего исследования было существенно затруднено и ограничено. Разработанная система является пилотной; системы с использованием дополнительных данных и переменных, которые будут разработаны в дальнейшем, могут обеспечить более высокую производительность.
Разработка нечёткого регулятора включала следующие этапы.
Этап 1: определение нечётких множеств, отражающих области ввода и вывода
В частности, для каждого интервала [α1, β1], где i=1, 2,…n, нечёткие множества Ai определяют как , где l=1, 2,…55. Множества являются полными в диапазоне [α1, β1]; это указывает, что для каждого xi∈[αi,βi] существует такое , что .
В частности, в настоящем исследовании использовали следующие нечёткие множества:
(4)
Входные переменные (частоту и силу пульса) анализировали с использованием треугольных функций принадлежности (рис. 2 и 3).

Рис. 2. Функция принадлежности для частоты пульса (входная переменная).

Рис. 3. Функция принадлежности для силы пульса (входная переменная).
Кроме того, выходную переменную (систолический индекс площади) определяли с использованием треугольных функций принадлежности (рис. 4).

Рис. 4. Функция принадлежности для систолического индекса площади (выходная переменная).
Нормальные нечёткие множества разработаны таким образом, чтобы:
(5)
На этапе 1 определены семь нечётких множеств в интервале [0, 8] (см. рис. 2), пять нечётких множеств в интервале [0, 6] (см. рис. 3) и семь нечётких множеств в интервале [650, 1220] (см. рис. 4).
Этап 2: генерация правил на основании входных и выходных переменных
На данном этапе для каждой пары входных и выходных переменных [(Fl, Sl; Psl), l=1, 2,…55] определяли соответствующие значения функции принадлежности в нечётких множествах . Затем для каждой пары входных и выходных переменных (Fl, Sl; Psl) определяли нечёткое множество, где для этой пары наблюдали наибольшее значение функции принадлежности. Например, для генерации правил оценивали первый, второй и третий наборы данных в табл. 2.
Таблица 2. Значения частоты пульса (F), силы пульса (S) и систолического индекса площади (Ps) для трёх добровольцев | |||
Участник исследования | Переменные | ||
частота пульса (F) | сила пульса (S) | систолический индекс площади (Ps) | |
1 | 6 | 1 | 660 |
2 | 1 | 5 | 1209 |
3 | 1,5 | 5 | 1171 |
С использованием данных табл. 2 оценивают первую пару входных и выходных переменных (F1, S1; Ps1)=(6, 1, 660). Согласно функциям принадлежности (см. рис. 2), для F1=6 (рис. 5) значение функции принадлежности составляет 1 в нечётком множестве H2; в других нечётких множествах значение функции принадлежности составляет 0:

Рис. 5. Значение функции принадлежности F1.
Таким образом, согласно функциям принадлежности (см. рис. 3), для S1=1 (рис. 6) значение составляет 1 в нечётком множестве L2:

Рис. 6. Значение функции принадлежности S1.
В соответствии с функциями принадлежности (см. рис. 4) для Ps1=660 (рис. 7) значение составляет 0,95 в нечётком множестве L2:

Рис. 7. Значение функции принадлежности Ps1.
Следовательно, первое правило получают так: ЕСЛИ F1 составляет H2 и S1 — L2, ТО Ps1 составляет L3. С использованием данных табл. 1 оценивают вторую пару входных и выходных переменных (F2, S2; Ps2)=(1, 5; 1209). Согласно функциям принадлежности (см. рис. 2), для F2 (рис. 8) значение составляет 1 в нечётком множестве L3; в других нечётких множествах значение функции принадлежности составляет 0:

Рис. 8. Значение функции принадлежности F2.
Таким образом, согласно функциям принадлежности (рис. 3 и 9):

Рис. 9. Значение функции принадлежности S2.
В соответствии с функциями принадлежности (рис. 4 и 10):

Рис. 10. Значение функции принадлежности Ps2.
Следовательно, второе правило получают так: ЕСЛИ F2 составляет L3 и S2 — H2, ТО Ps2 составляет H3. С использованием данных табл. 1 оценивают третью пару входных и выходных переменных (F13, S13; Ps13)=(1,5, 5; 1171). Согласно функциям принадлежности (см. рис. 2), для F13 (рис. 11) значение составляет 0,5 в нечётком множестве L3 и L2; в других нечётких множествах значение функции принадлежности составляет 0. Поскольку для L3 и L2 они одинаковы, можно выбрать L3:

Рис. 11. Значение функции принадлежности F13.
Согласно функциям принадлежности (рис. 3 и 12):
.

Рис. 12. Значение функции принадлежности S13.
В соответствии с функциями принадлежности (рис. 4 и 13):

Рис. 13. Значение функции принадлежности Ps13.
Следовательно, тринадцатое правило получают так: ЕСЛИ F13 составляет L3 и S13 — H2, ТО Ps13 составляет H3.
Этап 3: присвоение степени истинности каждому сгенерированному правилу
Поскольку возможно большое количество пар входных и выходных переменных, и каждая из них генерирует правило, существует вероятность противоречащих друг другу правил (т. е. правил с одинаковыми частями «ЕСЛИ», но разными частями «ТО»). Для разрешения подобных противоречий каждому правилу, сгенерированному на этапе 2, присваивают степень истинности. В результате сохраняется только одно из противоречащих друг другу правил, с наибольшей степенью истинности. Данный подход позволяет не только исключить противоречия, но и значительно сократить общее количество правил. Степень истинности правила определяют как:
(6)
Например, рассчитаем степени истинности для первого, второго и тринадцатого правил. Для первого правила мы имеем:
Таким образом,
Для второго правила мы имеем:
Таким образом,
Для тринадцатого правила мы имеем:
Таким образом,
Учитывая, что второе и тринадцатое правила принадлежат к одной группе и D (rule 2)=0,89 превышает D (rule 13)=0,255, тринадцатое исключают из базы правил.
Этап 4: формирование базы нечётких правил и разработка нечёткой системы в соответствии с ней
На этом этапе база нечётких правил, соответствующих нечётким множествам (см. рис. 2–4), представлена в виде справочной таблицы с двумя входами (табл. 3). Каждая ячейка таблицы соответствует сочетанию нечётких множеств в пределах [α1, β2] и [α2, β2], отражающему потенциальное правило. Согласно табл. 3, итоговая база включает 35 правил.
Таблица 3. Справочная таблица, основанная на нечётких правилах, для оценки систолического индекса площади | |||||
Частота | Сила | ||||
L2 | L1 | M | H1 | H2 | |
L3 | L1 | M | H1 | H2 | H3 |
L2 | L1 | M | M | H2 | H3 |
L1 | L1 | M | M | M | H2 |
M | L2 | L2 | L1 | L1 | M |
H1 | L2 | L1 | L1 | L1 | L1 |
H2 | L3 | L2 | L1 | L1 | M |
H3 | L3 | L2 | L2 | L1 | L1 |
Например, в соответствии с этапами 2 и 3, первое правило будет следующим: ЕСЛИ F1 составляет H2 и S1 составляет L2, ТО Ps1 составляет L3. Иными словами, если частота пульса составляет H2 и сила пульса составляет L2, ТО систолический индекс площади составляет L3 (см. табл. 3). Аналогичным образом, второе правило будет следующим: ЕСЛИ F2 составляет L3 и S2 — H2, ТО Ps2 составляет H3. Иными словами, если частота пульса составляет L3 и сила пульса составляет H2, ТО систолический индекс площади составляет H3 (см. табл. 3).
Этап 5: разработка нечёткой системы на основании базы нечётких правил
На этом этапе разрабатывали нечёткую систему в MATLAB® (The MathWorks, Inc., CША) с использованием базы правил, созданной на этапе 4. Система включала механизм логического вывода для продукта, одноэлементную программу введения нечёткости и программу восстановления чёткости по среднему центру.
Этическая экспертиза
Проведение исследования было одобрено этическим комитетом Payame Noor University (Тегеран); протокол № IR.PNU.REC.1403.685 от 08.03.2025.
Результаты
Характеристики выборки
В настоящем исследовании одновременно регистрировали частоту пульса, силу пульса и сигнал фотоплетизмограммы у 55 добровольцев в клинике персидской традиционной медицины «Ахмадие» при Тегеранском медицинском университете. Исследуемая группа включала 15 женщин и 40 мужчин (см. табл. 1).
Основные результаты исследования
Система, основанная на нечётких правилах, представлена в виде справочной таблицы с двумя входами и одним выходом (см. табл. 3). В ней представлены следующие правила:
- ЕСЛИ F составляет H2 и S — L2, ТО Ps составляет L3;
- ЕСЛИ F составляет L3 и S — H2, ТО Ps составляет H3.
Повышение значения функции принадлежности для частоты пульса и снижение значения функции принадлежности для силы пульса приводит к снижению значения функции принадлежности для систолического индекса площади. Напротив, снижение значения функции принадлежности для частоты пульса и повышение значения функции принадлежности для силы пульса приводит к повышению значения функции принадлежности для систолического индекса площади.
На рис. 14 приведено двухмерное представление систолического индекса площади; стрелками обозначены значения градиента, рассчитанные с использованием функции Quiver в MATLAB® (The MathWorks, Inc., CША). Таким образом, учитывая, что повышение градиента указывает на максимальные значения функции, направление стрелок соответствует областям, где наблюдают эти максимальные значения. В двухмерных функциях области, где стрелки для обоих входных значений имеют одинаковое направление, соответствуют максимальному выходному значению; области, где стрелки имеют разное направление, соответствуют минимальному выходному значению.

Рис. 14. Нечёткая система для прогнозирования систолического индекса площади с использованием 35 правил.
Область с максимальными значениями систолического индекса площади обозначена красным цветом, а область с минимальными значениями — жёлтым цветом. Область, обозначенная красным цветом (см. рис. 14), соответствует правилам, где повышение силы и частоты пульса приблизительно в 4–5 и 1–2 раза соответственно приводит к увеличению систолического индекса площади. Напротив, область, обозначенная жёлтым цветом (см. рис. 14), соответствует правилам, где снижение силы и частоты пульса приблизительно в 1–2 и 6–7 раз соответственно приводит к уменьшению систолического индекса площади.
ОБСУЖДЕНИЕ
Резюме основного результата исследования
Нечёткая система, разработанная на основании итоговых правил, обеспечивает приемлемое качество прогнозирования систолического индекса площади с использованием входных значений силы и частоты пульса, полученных методом пульсовой диагностики персидской традиционной медицины, которые согласуются с существующими правилами.
Обсуждение основных результатов исследования
Систолический индекс площади обладает существенной диагностической и прогностической ценностью при оценке общей функции сердца, а пульсовая диагностика персидской традиционной медицины — один из наиболее значимых методов клинической диагностики. Таким образом, оценка систолического индекса площади методом пульсовой диагностики персидской традиционной медицины с использованием нечётких систем имеет важное значение в клинической практике. Согласно исследованиям в области персидской традиционной медицины, сила и частота пульса по-разному влияют на объём крови, выбрасываемый при каждом сердечном сокращении в систолическую фазу. Повышение силы пульса ассоциируется с его увеличением, тогда как его учащение — с уменьшением [9, 11]. В настоящем исследовании эти закономерности подтвердились: увеличение силы пульса сопровождалось ростом систолического индекса площади (см. рис. 14, область, обозначенная красным цветом), тогда как повышение частоты пульса приводило к его снижению (см. рис. 14, область, обозначенная жёлтым цветом). Полученные результаты согласуются с данными как персидской традиционной медицины [9, 11], так и современной науки [22, 23, 27–29]. Кроме того, в недавнем исследовании использовали нечёткую систему для оценки связи между отдельными характеристиками сигнала фотоплетизмограммы в систолической фазе и параметрами пульсовой диагностики персидской традиционной медицины [30]. Данная система разработана с использованием 236 правил, с погрешностью менее 0,05, что считается приемлемым уровнем точности. В этом исследовании также установлено, что систолический индекс площади для сигнала фотоплетизмограммы, тесно связанный с его характеристиками в систолической фазе, также коррелирует с параметрами пульсовой диагностики персидской традиционной медицины. С учётом отсутствия аналогичных исследований для сравнения или подтверждения полученных результатов, нечёткая система, разработанная в настоящем пилотном исследовании, может служить полезной моделью для прогнозирования систолического индекса площади по сигналу фотоплетизмограммы с использованием пульсовой диагностики персидской традиционной медицины. Однако эффективность этой системы в дальнейшем можно повысить по мере получения новых данных и переменных.
ЗАКЛЮЧЕНИЕ
Предлагаемый нечёткий регулятор позволяет с достаточной точностью прогнозировать систолический индекс площади по сигналу фотоплетизмограммы с использованием входных значений силы и частоты пульса, полученных методом пульсовой диагностики персидской традиционной медицины, которые согласуются с установленными нечёткими правилами. Кроме того, отмечено, что повышение частоты пульса приводит к уменьшению систолического индекса площади, в то время как повышение силы пульса приводит к его увеличению. В целом, с учётом диагностической и прогностической значимости систолических интервалов фотоплетизмограммы в качестве неинвазивных показателей функции сердца, а также ключевой роли пульсовой диагностики в персидской традиционной медицине, применение технологий искусственного интеллекта, таких как нечёткий регулятор, разработанный в настоящем исследовании, может способствовать интеграции методов персидской традиционной медицины в современную клиническую практику для повышения эффективности диагностики.
ДОПОЛНИТЕЛЬНАЯ ИНФОРМАЦИЯ
Вклад авторов. M. Dehghandar — концепция и дизайн исследования, программное обеспечение, написание и редактирование текста рукописи; S.M. Mirhosseini-Alizamini — сбор, анализ и обработка данных, написание черновика рукописи; M.А. Vaghasloo — проведение исследования, сбор, анализ и обработка данных, подготовка графических материалов; A.K. Najafabadi — руководство исследованием, дизайн исследования, программное обеспечение. Все авторы одобрили рукопись (версию для публикации), а также согласились нести ответственность за все аспекты работы, гарантируя надлежащее рассмотрение и решение вопросов, связанных с точностью и добросовестностью любой её части.
Этическая экспертиза. Проведение исследования одобрено этическим комитетом Payame Noor University (Тегеран); протокол № IR.PNU.REC.1403.685 от 08.03.2025.
Источники финансирования. Отсутствуют.
Раскрытие интересов. Авторы заявляют об отсутствии отношений, деятельности и интересов за последние три года, связанных с третьими лицами (коммерческими и некоммерческими), интересы которых могут быть затронуты содержанием статьи.
Оригинальность. При создании настоящей работы авторы не использовали ранее опубликованные сведения (текст, иллюстрации, данные).
Доступ к данным. Данные, использованные для подтверждения результатов настоящего исследования, можно получить у автора, ответственного за переписку, по запросу.
Генеративный искусственный интеллект. При создании настоящей статьи технологии генеративного искусственного интеллекта не использовали.
Рассмотрение и рецензирование. Настоящая работа подана в журнал в инициативном порядке и рассмотрена по обычной процедуре. В рецензировании участвовали один внешний рецензент и член редакционной коллегии журнала.
ADDITIONAL INFORMATION
Author contribution: M. Dehghandar: conceptualization, methodology, software, writing and editing the manuscript; S.M. Mirhosseini-Alizamini: data curation, original draft preparation; M.A. Vaghasloo: visualization, data curation, validation, investigation; A.K. Najafabadi: software, methodology, supervision. Thereby, all authors provided approval of the version to be published and agree to be accountable for all aspects of the work in ensuring that questions related to the accuracy or integrity of any part of the work are appropriately investigated and resolved.
Ethical approval: This study was approved by the Ethics Committee of Payame Noor University (Tehran) on March 8, 2025, with ethics code IR.PNU.REC.1403.685.
Funding sources: No funding.
Disclosure of interests: The authors have no relationships, activities or interests for the last three years related with for-profit or not-for-profit third parties whose interests may be affected by the content of the article.
Statement of originality: When creating this work, the authors did not use previously published information (text, illustrations, data).
Data availability statement: The data used to support the findings of this study are available from the corresponding author upon request.
Generative AI: Generative AI technologies were not used for this article creation.
Provenance and peer-review: This article was submitted to the journal on an unsolicited basis and reviewed according to the usual procedure. Оne external peer-reviewerand one member of the editorial board were involved in the review process.
About the authors
Mohammad Dehghandar
Payame Noor University
Author for correspondence.
Email: dehghandar@gmail.com
ORCID iD: 0000-0003-4882-3121
PhD, Assistant Professor
Iran, Islamic Republic of, TehranSeyed M. Mirhosseini-Alizamini
Payame Noor University
Email: m_mirhosseini@pnu.ac.ir
ORCID iD: 0000-0003-1433-3124
PhD, Assistant Professor
Iran, Islamic Republic of, TehranMahdi A. Vaghasloo
Tehran University of Medical Sciences; Persian Medicine Network; Universal Scientific Education and Research Network
Email: mhdalizadeh@gmail.com
ORCID iD: 0000-0002-2987-4292
MD, PhD
Iran, Islamic Republic of, Tehran; Tehran; TehranAsghar K. Najafabadi
Payame Noor University
Email: khosravi.a@lu.ac.ir
ORCID iD: 0009-0003-3897-8215
PhD
Russian Federation, TehranReferences
- Dehghandar M, Rezvani S. Classification of COVID-19 Individuals Using Adaptive Neuro-Fuzzy Inference System. Journal of Medical Signals & Sensors. 2022;12(4):334–340. doi: 10.4103/jmss.jmss_140_21 EDN: TSMDZV
- Iancu I. Heart Disease Diagnosis Based on Mediative Fuzzy Logic. Artificial Intelligence in Medicine. 2018;89:51–60. doi: 10.1016/j.artmed.2018.05.004
- Ramzan M, Hamid M, Alhussan AA, et al. Accurate Prediction of Anxiety Levels in Asian Countries Using a Fuzzy Expert System. Healthcare (Basel). 2023;11(11):1594. doi: 10.3390/healthcare11111594 EDN: NSWNIO
- Vlamou E, Papadopoulos B. Fuzzy Logic Systems and Medical Applications. AIMS Neuroscience. 2019;6(4):266–272. doi: 10.3934/Neuroscience.2019.4.266
- Dehghandar M, Pabasteh M, Heydari R. Diagnosis of COVID-19 Disease by the Fuzzy Expert System Designed Based on Input-Output. Journal of Control. 2021;14(5):71–78. doi: 10.52547/joc.14.5.71 EDN: DNEKMI
- Dehghandar M, Alizadeh M, Moradi B. Estimation of Men's Brachial Blood Pressure Gradient Using Fuzzy System by Pulse Parameters in Persian Medicine. In: Proceedings of the 4th National Seminar on Control and Optimization. Behshahr; 2022.
- Alizadeh M, Keshavarz M, Ebadiani M, et al. Complexity and Rationality of Avicenna's Pulsology: A Step Towards Understanding the Past for Today’s Applications. International Journal of Cardiology. 2012;157(3):434–435. doi: 10.1016/j.ijcard.2012.03.168
- Dehghandar M, Khaloozadeh H, Alizadeh M, et al. Ranking the Temperature of Fever Diseases in Iranian Traditional Medicine Using Fuzzy Logic. Survey Methodology. 2015;44(1):94–118. Available from: https://www.researchgate.net/profile/Mansoor-Keshavarz/publication/
- Alizadeh Vaghasloo M. Explaining the Ten Parameters of Pulse Diagnosis in Traditional Iranian Medicine [dissertation abstract]. Tehran; 2013. (In Persian).
- Nafisi VR, Ghods R, Shojaedini SV. A Novel Pulse-Taking Device for Persian Medicine Based on Convolutional Neural Networks. Journal of Medical Signals & Sensors. 2022;12(4):285–293. doi: 10.4103/jmss.jmss_133_21
- Dehghandar M. Investigating the Effect of Pulse Traditional Medicine on the Factors of Blood Pressure by Fuzzy Calculations. In: Investigating the Effect of Pulse Traditional Medicine on the Factors of Blood Pressure by Fuzzy Calculations. Payame Noor University; 2016. (In Persian). Available from: https://www.researchgate.net/publication/368831791
- Dehghandar M, Khaloozadeh H, Soltanian F, Keshavarz M. Application of Fuzzy Logic to Determine the Retentive Causes of Pulse Body by the Pulse Parameters in Iranian Traditional Medicine. Journal of Multidisciplinary Engineering Science and Technology (JMEST). 2016;3(2):3881–3884. Available from: https://www.jmest.org/wp-content/uploads/JMESTN42351337.pdf
- Nafisi VR, Ghods R. A Telecare System for Use in Traditional Persian Medicine. The Open Biomedical Engineering Journal. 2021;15(1):105–114. doi: 10.2174/1874120702115010105
- Padilla JM, Berjano EJ, Saiz J, et al. Assessment of Relationships Between Blood Pressure, Pulse Wave Velocity and Digital Volume Pulse. Computers in Cardiology. 2006;33:893–896. Available from: https://scispace.com/pdf/assessment-of-relationships-between-blood-pressure-pulse-uq4mzofvxp.pdf
- Rubins U, Grabovskis A, Grube J, Kukulis I. Photoplethysmography Analysis of Artery Properties in Patients with Cardiovascular Diseases. In: Proceedings of the 14th Nordic-Baltic Conference on Biomedical Engineering and Medical Physics. Berlin: Springer; 2008. P. 319–322. doi: 10.1007/978-3-540-69367-3_85
- Dehghandar M, Khaloozadeh H, Soltanian F, Keshavarz M. Modeling of the Pulse Parameters in Iranian Traditional Medicine and Estimation of Blood Pressure by Artificial Neural Network. Journal of Industrial Engineering Research. 2016;2(1):17–22.
- Naseri M, Rezai Zadeh H, Choopani R. General overview of Traditional Medicine. Tehran: Nashre Shahr; 2010. P. 14–27. (In Persian).
- Chashti M. Exir-e-Azam [Great Elixir]. Tehran: Research Institute for Islamic and Complementary Medicine; 2008. Vol. 3. (In Persian).
- Alizadeh Vaghasloo M, Naghizadeh A, Keshavarz M. The Concept of Pulse. Traditional and Integrative Medicine. 2017;2(2):54–60.
- Asada HH, Shaltis P, Reisner A, et al. Mobile Monitoring With Wearable Photoplethysmographic Biosensors. IEEE Engineering in Medicine and Biology Magazine. 2003;22(3):28–40. doi: 10.1109/MEMB.2003.1213624 EDN: PRTJSL
- Murray WB, Foster PA. The Peripheral Pulse Wave: Information Overlooked. Journal of Clinical Monitoring. 1996;12(5):365–377. doi: 10.1007/bf02077634 EDN: UZAJZG
- Park J, Seok HS, Kim SS, Shin H. Photoplethysmogram Analysis and Applications: An Integrative Review. Frontiers in Physiology. 2022;12:1–23. doi: 10.3389/fphys.2021.808451
- Allen J. Photoplethysmography and its Application in Clinical Physiological Measurement. Physiological Measurement. 2007;28(3):R1–R39. doi: 10.1088/0967-3334/28/3/R01
- Liu H, Ivanov K, Wang Y, Wang L. Toward a Smartphone Application for Estimation of Pulse Transit Time. Sensors. 2015;15(10):27303–27321. doi: 10.3390/s151027303
- Chowdhury MH, Shuzan MNI, Chowdhury MEH, et al. Estimating Blood Pressure from the Photoplethysmogram Signal and Demographic Features Using Machine Learning Techniques. Sensors. 2020;20(11):3127. doi: 10.3390/s20113127
- Wang L. A Course in Fuzzy Systems and Control. NJ United States: Prentice-Hall, Inc.; 1996. ISBN: 978-0-13-540882-7
- Liu SH, Li RX, Wang JJ, et al. Classification of Photoplethysmographic Signal Quality with Deep Convolution Neural Networks for Accurate Measurement of Cardiac Stroke Volume. Applied Sciences. 2020;10(13):4612. doi: 10.3390/app10134612
- Kim H. Comparison of PCR Primers for Analyzing Denitrifying Microorganisms in the Hyporheic Zone. Applied Sciences. 2020;10(12):4172. doi: 10.3390/APP10124172 EDN: FMVNCU
- Finnegan E, Davidson S, Harford M, et al. Features From the Photoplethysmogram and the Electrocardiogram for Estimating Changes in Blood Pressure. Scientific Reports. 2023;13(1):986. doi: 10.1038/s41598-022-27170-2 EDN: GYJFUE
- Dehghandar M, Mirhosseini-Alizamini M, Alizadeh Vaghasloo M, Khosravi Najafabadi A. Design and Implementation of a Fuzzy Intelligent System to Estimate the Photoplethysmogram Systolic Features by Persian Medicine Pulsology. Health Management and Information Science. 2023;10(4):226–234. doi: 10.30476/jhmi.2024.102577.1220
Supplementary files

