







 Email this article


Evaluation of the radiation dose from dental cone-beam computed tomography: short communication
- Authors: Al-Salihi A.1, Al-Saedi A.L.1, Bader S.J.1, Abul-Hail R.C.1
-
Affiliations:
- University of Basrah
- Issue: Vol 6, No 3 (2025)
- Pages: 487-495
- Section: Short communications
- Submitted: 23.10.2024
- Accepted: 20.03.2025
- Published: 29.09.2025
- URL: https://jdigitaldiagnostics.com/DD/article/view/637381
- DOI: https://doi.org/10.17816/DD637381
- EDN: https://elibrary.ru/JBIYAZ
- ID: 637381

Cite item
Full Text

Abstract
BACKGROUND: Dental cone-beam computed tomography offers several advantages, including superior image quality, an acceptable size, and a lower radiation dose compared to conventional CT scanning. Moreover, cone-beam computed tomography is more suitable for dentists to acquire and analyze images, and it provides greater comfort for patients due to technological advancements. Cone-beam computed tomography generates three-dimensional images of the head and neck and is utilized across various dental fields, including dental surgery, endodontics, trauma, implant dentistry, head and neck lesions and diseases, and orthodontics.
AIM: To evaluate seven tissue doses using three scan protocols on a cone-beam computed tomography scanner KaVo OP 3D Pro, and to investigate the effect of resolution options on the effective dose.
METHODS: Three protocols were employed in this study. Three voxel size settings were assessed: 420 μm, 380 μm, and 320 μm. The field of view and tube voltage were kept constant at 13 cm × 15 cm and 90 kV, respectively. Other were, scan time (8–27 seconds) and dose range (50–350 μSv). The absorbed and effective doses were calculated for each cone-beam computed tomography scan protocol.
RESULTS: In the throat, the highest dose was absorbed by tissue-2 (7.719 mGy). In the teeth, the highest dose was absorbed by tissue-3 (16.326 mGy). In the cheek, the maximum dose was absorbed by tissue-3 (25.053 mGy). In the eyes, the highest dose was absorbed by tissue-3 (12.962 mGy). In the forehead, the highest dose was absorbed by tissue3 (8.465 mGy). In the mid-skull, the highest dose was absorbed by tissue-3 (20.904 mGy). In the occipital region, the highest dose was absorbed by tissue-2 (7.8 mGy). Regarding effective doses, protocol-3 generally resulted in higher values, except in the throat and occipital regions, where tissue-2 absorbed more.
CONCLUSION: This study demonstrates that changes in cone-beam computed tomography exposure parameters influence the effective dose. Adjusting resolution settings results in variations in effective doses, highlighting the significance of selecting appropriate exposure factors, such as voxel size or resolution options. Dentists must carefully consider imaging parameters, as these decisions have a direct impact on patient exposure.
Full Text
Обоснование
Проведено значительное число исследований с целью расчёта дозы облучения, получаемой обследуемыми при конусно-лучевой компьютерной томографии (КЛКТ) [1–3]. В большинстве исследований для оценки стандартных доз пациента применяли термолюминесцентные дозиметры (ТЛД), размещённые в фантомах, составленных из материалов, эквивалентных по свойствам биологическим тканям [4–6]. КЛКТ внедрили в стоматологическую практику P. Mozzo и соавт. [7] в 1998 году. Данный метод позволяет получать трёхмерные (3D) изображения головы и шеи и его используют в различных областях стоматологии, включая хирургическую стоматологию, эндодонтию, травматологию, имплантологию, ортодонтию и диагностику поражений и заболеваний мягких тканей головы и шеи [8–10]. В настоящее время КЛКТ — один из наиболее важных и эффективных инструментов в диагностике заболеваний челюстно-лицевой области, планировании лечения и лучевой терапии [11–13]. Обследования с использованием данного метода связаны с большей дозой облучения по сравнению с традиционной панорамной рентгенографией, но с меньшей по сравнению с традиционной компьютерной томографией (КТ) [1, 13]. В стоматологической рентгенодиагностике специалисты часто отдают предпочтение КЛКТ по сравнению с КТ благодаря таким преимуществам, как более высокое качество изображения, ценовая доступность, компактность оборудования, широкое распространение и меньшая доза облучения. Кроме того, КЛКТ более удобна для стоматологов при получении и анализе изображений, а также она обеспечивает больший комфорт для пациентов благодаря технологическим усовершенствованиям [3, 14, 15]. Однако величина дозы облучения при КЛКТ зависит от конфигурации системы и протокола сканирования [16]. При КЛКТ возможны различные варианты полей обзора и настроек размера вокселя, которые можно адаптировать для стоматологических исследований. Так, большие, средние и малые поля обзора позволяют получать объёмы, достаточные для визуализации челюстно-лицевой области, дентoальвеолярных структур и локализованных зон соответственно [17, 18]. Радиационное поле при стоматологических исследованиях охватывает область головы и шеи, включая глаза, щитовидную железу и слюнные железы [19–21]. В связи с этим важно минимизировать дозу облучения при КЛКТ из-за сопряжённых радиологических рисков [5, 10, 22]. При этом качество изображения должно оставаться оптимальным даже при снижении дозы облучения [20, 21].
Цель
Оценить дозы облучения семи тканей при трёх протоколах сканирования с использованием конусно-лучевого компьютерного томографа KaVo OP 3D Pro, а также изучить влияние вариантов пространственного разрешения на величину эффективной дозы.
Методы
Дизайн исследования
Проведено экспериментальное (in vitro) одноцентровое исследование.
Конусно-лучевая компьютерная томография
В настоящем исследовании использовали конусно-лучевой компьютерный томограф KaVo ORTHOPANTOMOGRAPH® (OP) 3D Pro (KaVo Dental GmbH, Германия). Для протоколов 1, 2 и 3 применяли одно и то же поле обзора (13×15 см), которое охватывает бóльшую часть челюстно-лицевой области (табл. 1). Настройки разрешения для протоколов 1, 2 и 3 соответственно были следующими:
- низкое разрешение (размер вокселя 420 мкм);
- стандартное разрешение (размер вокселя 380 мкм);
- высокое разрешение (размер вокселя 320 мкм).
Таблица 1. Параметры протоколов конусно-лучевой компьютерной томографии, использованных в исследовании | |||
Параметр | Протокол | ||
1 | 2 | 3 | |
Размер вокселя, мкм | 420 | 380 | 320 |
Поле обзора, см | 13×15 | 13×15 | 13×15 |
Напряжение на трубке, кВ | 90 | 90 | 90 |
Ток трубки, мА | 3,2 | 5 | 8 |
Время экспозиции, с | 4,5 | 8,1 | 8,1 |
Разрешение | Низкое | Стандартное | Высокое |
Применение | Ортодонтия и первичные обследования | Общая стоматология и рутинные обследования | Планирование имплантации, эндодонтические и пародонтологические исследования |
Таким образом, меньший размер вокселя соответствует более высокому разрешению, хотя и сопровождается снижением силы тока трубки.
Использование одного томографа обусловлено практическими соображениями, такими как наличие оборудования в учреждении и акцент на применении имеющихся ресурсов, что позволило детально изучить возможности одной модели.
Методологические преимущества такого подхода включают:
- согласованность благодаря стандартизации качества изображений;
- оптимизацию для более глубокого понимания и совершенствования;
- повышение надёжности за счёт снижения вариабельности при интерпретации результатов диагностики.
Кроме того, данный подход обеспечивает экономическую эффективность за счёт минимизации затрат на оборудование и обучение, развитие специализированной экспертизы и упрощение рабочего процесса за счёт знакомства персонала с системой.
Диапазон параметров сканирования протоколов КЛКТ, использованных в настоящем исследовании, включал:
- источник рентгеновского излучения (90 кВп, 5–100 мА);
- детектор (плоскопанельный детектор с комплементарной структурой металл–оксид–полупроводник);
- размер вокселя (420, 380 и 320 мкм);
- поле обзора (13х15 см);
- время сканирования (8–27 с);
- диапазон дозы (50–350 мкЗв).
Программное обеспечение и средства интеграции, использованные в исследовании, включали KaVo OP 3D Imaging Software® (KaVo Dental GmbH, Германия), совместимость с DICOM (Digital Imaging and Communications in Medicine), а также интеграцию со стоматологическими программами (например, OrthoAnalyzer, Implant Planning Software).
Оценка поглощённой и эффективной дозы
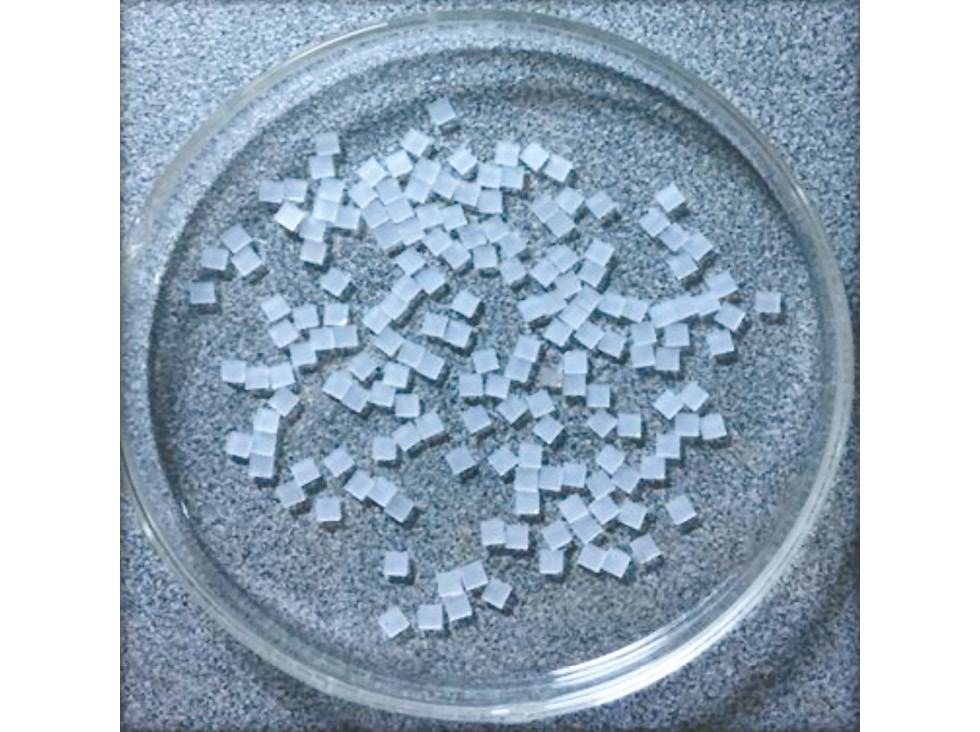
Измерения радиационного облучения проводили с использованием дозиметров TLD-100® (LiF) (Thermo Fisher Scientific, США). Дозиметры помещали в герметичный пластиковый контейнер и фиксировали внутри антропоморфного фантома, как показано на рис. 1. Всего использовали 63 дозиметра (по 21 чипу для каждого протокола КЛКТ), которые располагались в семи анатомических зонах, представленных на рис. 2 и перечисленных в табл. 2.

Рис. 1. Термолюминесцентный дозиметр TLD-100® (LiF) (Thermo Fisher Scientific, США).

Рис. 2. Фантом.
Таблица 2. Анатомическое расположение термолюминесцентных дозиметрических чипов внутри фантома | |
Анатомическая область | Идентификаторы термолюминесцентных дозиметров для каждого протокола конусно-лучевой компьютерной томографии |
Глотка | Протокол 1: 1, 2, 3; протокол 2: 22, 23, 24; протокол 3: 43, 44, 45 |
Зубы | Протокол 1: 4, 5, 6; протокол 2: 25, 26, 27; протокол 3: 46, 47, 48 |
Щека | Протокол 1: 7, 8, 9; протокол 2: 28, 29, 30; протокол 3: 49, 50, 51 |
Глаза | Протокол 1: 10, 11, 12; протокол 2: 31, 32, 33; протокол 3: 52, 53, 54 |
Лобная область | Протокол 1: 13, 14, 15; протокол 2: 34, 35, 36; протокол 3: 55, 56, 57 |
Средняя часть черепа | Протокол 1: 16, 17, 18; протокол 2: 37, 38, 39; протокол 3: 58, 59, 60 |
Затылочная область | Протокол 1: 19, 20, 21; протокол 2: 40, 41, 42; протокол 3: 61, 62, 63 |
Перед облучением дозиметры на основе фторида лития [TLD-100® (LiF) (Thermo Fisher Scientific, США)] калибровали в соответствии с процедурами, описанными в справочнике по термолюминесценции [23]. Калибровка позволила установить зависимость между показаниями ТЛД и дозами рентгеновского излучения, которую затем использовали для оценки поглощённых доз в анатомических областях фантома. Для каждого облучения использовали 21 дозиметр. Дополнительно использовали три ТЛД для оценки фонового излучения, которое составило 0,013 мГр. Минимальные зарегистрированные показания ТЛД превышали этот фоновый уровень в три раза; данный показатель был вычтен из показаний дозиметров.
Отжиг всех ТЛД перед облучением проводили в муфельной печи Gallenkamp® (Gallenkamp & Co. Ltd., Великобритания) при температуре 400 °С в течение 1 ч, с последующей низкотемпературной термообработкой при 100 °С в течение 2 ч. После облучения выполняли дополнительный отжиг при 100 °С в течение 10 мин [23]. Для считывания термолюминесцентного сигнала использовали ридер Harshaw 2000 B/C® (Harshaw Filtrol Partnership, США).
Эффективную дозу (E) рассчитывали в зивертах (Зв) в соответствии с рекомендациями ICRP (International Commission on Radiological Protection) 60 с использованием следующего уравнения [24]:
(1)
где WT — взвешивающий коэффициент для каждой ткани или органа (T), а HT — эквивалентная доза в ткани или органе, Зв.
(2)
где HT — эквивалентная доза в ткани или органе, Зв; WR — взвешивающий коэффициент излучения; D — поглощённая доза, Гр. Для рентгеновского излучения значение WR равно единице [25]. Таким образом, величина эффективной дозы зависит от поглощённой дозы (D) и взвешивающих коэффициентов тканей (WT).
Сведения об ошибках измерений включают факторы, влияющие на эффект затухания, среди которых:
- тип материала ТЛД [дозиметры TLD-100® (LiF) (Thermo Fisher Scientific, США)];
- уровень дозы (при более высоких дозах выраженность затухания выше);
- время хранения (чем дольше хранение, тем больше затухание);
- температура (более высокие температуры ускоряют процесс затухания).
Влияние затухания на дозиметрию проявляется в недооценке дозы (снижение зарегистрированных значений), неточности дозовых оценок, что отражается на радиационной безопасности и соблюдении нормативных требований, а также в проблемах калибровки, поскольку затухание влияет на калибровку прибора.
Этическая экспертиза
Проведение данного исследования одобрено этическим комитетом кафедры фундаментальных наук Стоматологического колледжа Университета Басры (протокол № 1022 от 07.11.2023).
Статистические методы
Для обработки данных использовали пакет статистических программ IBM SPSS Statistics®, версия 26 (IBM Corp., США). Для статистического анализа применяли однофакторный дисперсионный анализ с апостериорным сравнением. Доверительный интервал для среднего значения составлял 95%, а уровень статистической значимости р ≤0,05.
Результаты
Измеренные значения поглощённых (D) и эффективных доз (E) для различных тканей — глотки, зубов, щеки, глаз, лобной области, средней части черепа и затылочной области — в зависимости от протокола КЛКТ (протокол 1, низкое разрешение; протокол 2, стандартное разрешение; и протокол 3, высокое разрешение) приведены в табл. 3. Наибольшую поглощённую дозу в различных анатомических областях зафиксировали при следующих протоколах: в глотке — при протоколе 2 (7,719 мГр), в зубах — при протоколе 3 (16,326 мГр), в щеке — при протоколе 3 (25,053 мГр), в глазах — при протоколе 3 (12,962 мГр), в области лба — при протоколе 3 (8,465 мГр), в средней части черепа — при протоколе 3 (20,904 мГр), в затылочной области — при протоколе 2 (7,8 мГр). При оценке эффективной дозы протокол 3 в целом демонстрировал более высокие значения, за исключением глотки и затылочной области, где наибольшие эффективные дозы наблюдали при протоколе 2. Наблюдаемые различия представлены на рис. 3 и 4. Данные о статистически значимых и незначимых различиях между протоколами и тканями приведены в табл. 4.
Таблица 3. Поглощённые и эффективные дозы для различных тканей в зависимости от протокола конусно-лучевой компьютерной томографии | |||||
Протокол 1 | Протокол 2 | Протокол 3 | |||
D, мГр | E, мЗв | D, мГр | E, мЗв | D, мГр | E, мЗв |
Глотка | |||||
0,473 (0,113–1,838) | 0,023 (0,011–0,551) | 7,719 (1,855–10,551) | 0,385 (0,025–1,255) | 1,565 (0,951–3,146) | 0,078 (0,012–0,544) |
Зубы | |||||
4,95 (1,453–5,755) | 0,049 (0,182–1,222) | 13,215 (3,211–25,122) | 0,132 (0,911–2,202) | 16,326 (2,541–28,512) | 0,163 (0,055–1,308) |
Щека | |||||
5,378 (0,341–4,662) | 0,053 (0,189–2,520) | 12,684 (1,024–20,441) | 0,126 (0,23–1,599) | 25,053 (5,226–30,905) | 0,250 (0,155–1,345) |
Глаза | |||||
2,099 (1,565–7,611) | 0,020 (0,997–3,105) | 7,577 (0,025–11,259) | 0,075 (0,051–1,658) | 12,962 (4,467–18,509) | 0,129 (0,054–2,411) |
Лобная область | |||||
3,46 (2,001–5,133) | 0,034 (0,118–1,251) | 5,104 (1,052–7,788) | 0,051 (0,022–1,422) | 8,465 (3,369–10,201) | 0,084 (0,055–1,655) |
Средняя часть черепа | |||||
4,894 (0,343–1,526) | 0,048 (0,222–0,908) | 13,013 (3,522–25,554) | 0,130 (1,02–2,487) | 20,904 (7,122–36,414) | 0,209 (0,190–0,989) |
Затылочная область | |||||
2,61 (0,902–2,881) | 0,026 (1,052–1,558) | 7,8 (1,288–9,333) | 0,078 (0,011–0,844) | 4,188 (0,988–4,322) | 0,041 (0,012–0,068) |
Примечание. D — поглощённая доза; E — эффективная доза. Результаты представлены с 95% доверительным интервалом. | |||||

Рис. 3. Распределение поглощённой дозы в различных тканях при использовании разных протоколов конусно-лучевой компьютерной томографии.

Рис. 4. Распределение эффективной дозы в различных тканях при использовании разных протоколов конусно-лучевой компьютерной томографии.
Таблица 4. Апостериорное сравнение, указывающее на статистически значимые и незначимые различия между протоколами конусно-лучевой компьютерной томографии и дозами облучения тканей | ||
Протокол | р | |
Поглощённая доза (D), мГр | Эффективная доза (E), мЗв | |
1 и 2 | 0,0004 | 0,056 |
2 и 3 | 0,234 | 0,953 |
1 и 3 | 0,013 | 0,006 |
Обсуждение
Наибольшая эффективная доза зафиксирована при наивысшем разрешении, что обусловлено прямой зависимостью между настройками разрешения и величиной эффективной дозы. Результаты настоящего исследования согласуются с ранее опубликованными данными, указывающими на обратную зависимость между размером вокселя и эффективной дозой [21]. Таким образом, общепризнанно, что изменения параметров экспозиции при КЛКТ напрямую влияют на величину эффективной дозы.
При использовании протоколов КЛКТ наибольшие поглощённые дозы отмечали в области щеки и зубов, поскольку эти ткани непосредственно подвергались воздействию первичного пучка (см. рис. 3). Напротив, наименьшие поглощённые дозы наблюдали в области глотки и лобной области, поскольку эти зоны располагались на большем расстоянии от пучка рентгеновского излучения. Основную роль в облучении тканей, находящихся за пределами первичного пучка, играло рассеянное излучение внутри организма. Полученные данные согласуются с результатами предыдущих исследований, в которых определяли наибольшие и наименьшие поглощённые дозы для этих тканей [18]. На рис. 4 представлены значения эффективных доз (E) для различных тканей в зависимости от протокола КЛКТ.
В настоящем исследовании сравнивали влияние режимов низкого, стандартного и высокого разрешения на эффективную дозу облучения. Как и ожидалось, эффективная доза находилась в обратной зависимости от размера вокселя и в прямой зависимости от разрешения, что в первую очередь связано с более продолжительным временем экспозиции при высоком разрешении. Этот результат согласуется с некоторыми опубликованными исследованиями [21, 26, 27], подчёркивающими необходимость высококачественных изображений при возрастании радиационных рисков, связанных с этими изображениями. В нескольких работах предложены рекомендации по оптимизации настроек вокселя и снижению уровня шумов изображения [28]. Таким образом, достижение баланса между дозой облучения и качеством изображения имеет принципиальное значение.
Клиническая значимость выявленных различий доз, связанных с изменением параметров экспозиции при КЛКТ, очевидна, поскольку данные параметры существенно влияют на величину эффективной дозы. Ключевые факторы, определяющие уровень облучения, включают настройки томографа, такие как напряжение на трубке, ток трубки, время экспозиции и поле обзора, повышение которых увеличивает дозу. Стратегии снижения эффективной дозы должны предусматривать выбор оптимальных протоколов сканирования, включая низкодозовые режимы для рутинных обследований.
Основные наблюдения в данном исследовании включают следующее:
- увеличение размера вокселя снижает разрешение, но уменьшает дозу облучения;
- поддержание постоянного напряжения на трубке (90 кВ) обеспечивает стабильное качество изображения;
- протокол 3 с более высоким током трубки улучшает разрешение.
Ограничения исследования
Основными ограничениями исследования были его короткая продолжительность и одноцентровой дизайн, небольшой размер выборки, ограниченный объём государственной поддержки, а также ограничения, обусловленные доступностью оборудования и инфраструктуры.
Заключение
Данное исследование продемонстрировало, что изменения параметров экспозиции при КЛКТ существенно влияют на величину эффективной дозы. Коррекция настроек разрешения приводит к значительным вариациям в эффективной дозе, что подчёркивает важность тщательного выбора факторов экспозиции, таких как размер вокселя и режим разрешения. Стоматологи должны учитывать выбранные параметры визуализации, поскольку они напрямую отражаются на безопасности пациента.
Использованные в данном исследовании протоколы визуализации обеспечили хорошее качество изображений с чётким различием смежных структур. Однако рекомендуется проведение дальнейших исследований с использованием разнообразных подходов. Параметры, связанные с качеством изображений КЛКТ, такие как пространственное разрешение, отношение сигнал/шум и отношение контраст/шум, ещё не оценивали. Эти аспекты целесообразно изучить в будущих исследованиях для получения более прогностически значимых данных.
Дополнительная информация
Вклад авторов. A. Al-Salihi — концепция и дизайн исследования, сбор данных, ресурсное и программное обеспечение, администрирование проекта, написание и редактирование текста рукописи; A.I.L. Al-Saedi — концепция и дизайн исследования, сбор данных, администрирование проекта, написание и редактирование текста рукописи; S.J. Bader, R.Ch. Abul-Hail — концепция и дизайн исследования, сбор данных, администрирование проекта, ресурсное обеспечение, написание и редактирование текста рукописи. Все авторы одобрили рукопись (версию для публикации), а также согласились нести ответственность за все аспекты работы, гарантируя надлежащее рассмотрение и решение вопросов, связанных с точностью и добросовестностью любой её части.
Этическая экспертиза. Проведение данного исследования одобрено этическим комитетом кафедры фундаментальных наук Стоматологического колледжа Университета Басры (протокол № 1022 от 07.11.2023).
Источники финансирования. Отсутствуют.
Раскрытие интересов. Авторы заявляют об отсутствии отношений, деятельности и интересов за последние три года, связанных с третьими лицами (коммерческими и некоммерческими), интересы которых могут быть затронуты содержанием статьи.
Оригинальность. При создании настоящей работы авторы не использовали ранее опубликованные сведения (текст, иллюстрации, данные).
Доступ к данным. Редакционная политика в отношении совместного использования данных к настоящей работе не применима.
Генеративный искусственный интеллект. При создании настоящей статьи технологии генеративного искусственного интеллекта не использовали.
Рассмотрение и рецензирование. Настоящая работа подана в журнал в инициативном порядке и рассмотрена по обычной процедуре. В рецензировании участвовали один внешний рецензент и член редакционной коллегии журнала.
Additional information
Author contributions: A. Al-Salihi: conceptualization, data curation, investigation, methodology, project administration, resources, software, writing—original draft, writing—review & editing; A.I.L. Al-Saedi: conceptualization, data curation, investigation, methodology, project administration, writing—original draft, writing—review & editing; S.J. Bader, R.Ch. Abul-Hail: conceptualization, data curation, investigation, methodology, project administration, resources, writing—original draft, writing—review & editing. All the authors approved the version of the manuscript to be published and agreed to be accountable for all aspects of the work, ensuring that questions related to the accuracy or integrity of any part of the work are appropriately investigated and resolved.
Ethics approval: The Ethics Committee of the Department of Basic Sciences, College of Dentistry, University of Basrah, approved this study (protocol No. 1022, 07-11-2023).
Funding sources: No funding.
Disclosure of interests: The authors have no relationships, activities or interests for the last three years related with for-profit or not-for-profit third parties whose interests may be affected by the content of the article.
Statement of originality: When creating this work, the authors did not use previously published information (text, illustrations, data).
Data availability statement: The editorial policy on data sharing does not apply to this work.
Generative AI: Generative AI technologies were not used for this article creation.
Provenance and peer-review: This article was submitted to the journal on an unsolicited basis and reviewed according to the usual procedure. Оne external peer-reviewer and one member of the editorial board were involved in the review process.
About the authors
Abdalrahman Al-Salihi
University of Basrah
Author for correspondence.
Email: abdalrahman.hassan@uobasrah.edu.iq
ORCID iD: 0000-0001-9828-4870
Assistant Professor
Iraq, BasrahAqeel Ibrahim L. Al-Saedi
University of Basrah
Email: aqeel.lazim@uobasrah.edu.iq
ORCID iD: 0000-0003-3495-784X
Assistant Professor
Iraq, BasrahSattar J. Bader
University of Basrah
Email: sattar.jabbar@uobasrah.edu.iq
ORCID iD: 0009-0009-5841-7929
Iraq, Basrah
Riyadh Ch. Abul-Hail
University of Basrah
Email: riydh.abalhiel@uobasrah.edu.iq
ORCID iD: 0000-0002-1897-3658
Professor
Iraq, BasrahReferences
- Bernasconi A, Dechir Y, Izzo A, et al; International Weightbearing CT Society. Trends in the Use of Weightbearing Computed Tomography. Journal of Clinical Medicine. 2024;13(18):5519. doi: 10.3390/jcm13185519 EDN: PJSSQY
- Kim NH, Yang BE, Kang SH, et al. Preclinical and Preliminary Evaluation of Perceived Image Quality of AI-Processed Low-Dose CBCT Analysis of a Single Tooth. Bioengineering. 2024;11(6):576. doi: 10.3390/bioengineering11060576 EDN: QQJYWJ
- Nikneshan S, Aghamiri MR, Moudi E, et al. Dosimetry of Three Cone Beam Computerized Tomography Scanners at Different Fields of View in Terms of Various Head and Neck Organs. Iranian Journal of Radiology. 2016;13(3):e34220. doi: 10.5812/iranjradiol.34220
- da Silva Moura W, Chiqueto K, Pithon GM, et al. Factors Influencing the Effective Dose Associated With CBCT: A Systematic Review. Clinical Oral Investigations. 2018;23(3):1319–1330. doi: 10.1007/s00784-018-2561-4 EDN: NDHTPF
- Pauwels R, Scarfe WC. Radiation Dose, Risks, and Protection in CBCT. In: Scarfe W, Angelopoulos C, editors. Maxillofacial Cone Beam Computed Tomography. Cham: Springer; 2017. P. 227–246. ISBN: 978-3-319-62061-9 doi: 10.1007/978-3-319-62061-9_8
- Gudac J, Hellén-Halme K, Maciulskiene V. The Changes in Size of Periapical Lesions after Root Canal Treatments Assessed by Digital Periapical Radiography and Cone-Beam Computed Tomography: A 2-Years Prospective Clinical Study. Medicina. 2022;58(10):1437. doi: 10.3390/medicina58101437 EDN: CSOKUX
- Mozzo P, Procacci C, Tacconi A, et al. A New Volumetric CT Machine for Dental Imaging Based on the Cone-Beam Technique: Preliminary Results. European Radiology. 1998;8(9):1558–1564. doi: 10.1007/s003300050586
- Hung KF, Hui L, Yeung AWK, et al. An Analysis of Patient Dose Received During Cone-Beam Computed Tomography in Relation to Scan Settings and Imaging Indications as Seen in a Dental Institution in Order to Establish Institutional Diagnostic Reference Levels. Dentomaxillofacial Radiology. 2022;51(5):20200529. doi: 10.1259/dmfr.20200529 EDN: ECGCDX
- Han M, Kim HJ, Choi JW, et al. Diagnostic Usefulness of Cone-Beam Computed Tomography Versus Multi-Detector Computed Tomography for Sinonasal Structure Evaluation. Laryngoscope Investigative Otolaryngology. 2022;7(3):662–670. doi: 10.1002/lio2.792 EDN: FPRLKI
- Colceriu-Șimon IM, Băciuţ M, Ştiufiuc RI, et al. Clinical Indications and Radiation Doses of Cone Beam Computed Tomography in Orthodontics. Medicine and Pharmacy Reports. 2019;92(4):346–351. doi: 10.15386/mpr-1434
- Al-Salihi A, Al-Saedi A, Abdullah K, et al. Review: Dosimetry in Dental Radiology. Kirkuk University Journal-Scientific Studies. 2021;16(4):1–12. doi: 10.32894/kujss.2021.170449 EDN: OFUUDC
- Pauwels R, Zhang G, Theodorakou C, et al; The SEDENTEXCT Project Consortium. Effective Radiation Dose and Eye Lens Dose in Dental Cone Beam CT: Effect of Field of View and Angle of Rotation. The British Journal of Radiology. 2014;87(1042):20130654. doi: 10.1259/bjr.20130654
- Al-Saleh MAQ, Alsufyani NA, Saltaji H, et al. MRI and CBCT Image Registration of Temporomandibular Joint: A systematic review. Journal of Otolaryngology — Head & Neck Surgery. 2016;45(1). doi: 10.1186/s40463-016-0144-4
- Joshi V, Gupta S. Immediate Implant Placement in Anterior Esthetic Region and Assessment using Cone-Beam Computed Tomography Scan Technology. Journal of International Oral Health: JIOH. 2015;7(Suppl. 2):99–102. Available from: https://pmc.ncbi.nlm.nih.gov/articles/PMC4672858/
- Kelaranta A, Ekholm M, Toroi P, Kortesniemi M. Radiation Exposure to Foetus and Breasts From Dental X-ray Examinations: Effect of Lead Shields. Dentomaxillofacial Radiology. 2016;45(1):20150095. doi: 10.1259/dmfr.20150095
- Alaei P, Spezi E. Imaging Dose From Cone Beam Computed Tomography in Radiation Therapy. Physica Medica. 2015;31(7):647–658. doi: 10.1016/j.ejmp.2015.06.003
- Sheikhi M, Dakhil-Alian M, Bahreinian Z. Accuracy and Reliability of the Linear Measurements Using Tangential Projection and Cone Beam Computed Tomography. Dental Research Journal. 2015;12(3):271–277. Available from: https://pmc.ncbi.nlm.nih.gov/articles/PMC4432612/
- De Smet E, De Praeter G, Verstraete KLA, et al. Direct Comparison of Conventional Radiography and Cone-Beam CT in Small Bone and Joint Trauma. Skeletal Radiology. 2015;44(8):1111–1117. doi: 10.1007/s00256-015-2127-3 EDN: FCEIQV
- Sang YH, Hu HC, Lu SH, et al. Accuracy Assessment of Three-dimensional Surface Reconstructions of In vivo Teeth from Cone-beam Computed Tomography. Chinese Medical Journal. 2016;129(12):1464–1470. doi: 10.4103/0366-6999.183430
- Lee C, Lee SS, Kim JE, et al. Comparison of Dosimetry Methods for Panoramic Radiography: Thermoluminescent Dosimeter Measurement Versus Personal Computer–Based Monte Carlo Method Calculation. Oral Surgery, Oral Medicine, Oral Pathology and Oral Radiology. 2016;121(3):322–329. doi: 10.1016/j.oooo.2015.10.030
- Jadu FM, Alzahrani AA, Almutairi MA, et al. The Effect of Varying Cone Beam Computed Tomography Image Resolution and Field-of-View Centralization on Effective Radiation Dose. Saudi Medical Journal. 2018;39(5):470–475. doi: 10.15537/smj.2018.5.21658
- Al-Salihi A, Abul-Hail RC, Badran HA. Environmental Radiation Dosimetry for School Buildings, Hospitals and Health Centers in Babil Governorate-Iraq Using TL-technique. Journal of Medical & Pharmaceutical Sciences. 2023;7(1):1–9. doi: 10.26389/ajsrp.a030123 EDN: DPVXCV
- Furetta C. Handbook of Thermoluminescence. World Scientific Publishing Company; 2009. ISBN: 978-981-283-892-6 doi: 10.1142/7187 EDN: YEHTFM
- Recommendations of the International Commission on Radiological Protection. ICRP Publication 60: Elsevier Health Sciences; 1991. ISBN: 0-08-041-l14-4 Available from: https://journals.sagepub.com/doi/pdf/10.1177/ANIB_21_1-3
- Martin A, Harbison SA. An Introduction to Radiation Protection. London: Taylor & Francis; 2006. Available from: https://csw.uobaghdad.edu.iq/wp-content/
- Dillenseger JP, Gros CI, Sayeh A, et al. Image Quality Evaluation of Small FOV and Large FOV CBCT Devices for Oral and Maxillofacial Radiology. Dentomaxillofacial Radiology. 2017;46(1):20160285. doi: 10.1259/dmfr.20160285
- Nikneshan S, Valizadeh S, Javanmard A, Alibakhshi L. Effect of Voxel Size on Detection of External Root Resorption Defects Using Cone Beam Computed Tomography. Iranian Journal of Radiology. 2016;13(3):e34985. doi: 10.5812/iranjradiol.34985
- Carneiro ALE, Reis INR, Bitencourt FV, et al. Accuracy of Linear Measurements for Implant Planning Based on Low-Dose Cone Beam CT Protocols: A Systematic Review and Meta-analysis. Dentomaxillofacial Radiology. 2024;53(4):207–221. doi: 10.1093/dmfr/twae007 EDN: IZZGJP
Supplementary files


