

")


Virtual platform for computer simulation of radionuclide imaging in nuclear cardiology: Comparison with clinical data
- Autores: Denisova N.V.1,2, Gurko M.A.1,2, Kolinko I.P.1,2, Ansheles A.A.3, Sergienko V.B.3
-
Afiliações:
- Novosibirsk State University
- Khristianovich Institute of Theoretical and Applied Mechanics
- National Medical Research Centre of Cardiology Named After Academician E.I. Chazov
- Edição: Volume 4, Nº 4 (2023)
- Páginas: 492-508
- Seção: Original Study Articles
- ##submission.dateSubmitted##: 22.09.2023
- ##submission.dateAccepted##: 31.10.2023
- ##submission.datePublished##: 15.12.2023
- URL: https://jdigitaldiagnostics.com/DD/article/view/595696
- DOI: https://doi.org/10.17816/DD595696
- ID: 595696

Citar

Resumo
BACKGROUND: In radionuclide imaging, in vivo human clinical studies are limited because of radiation exposure and ethical concerns; therefore, mathematical modeling and in silico computer simulations based on digital models are becoming increasingly important. In the English-language literature, this approach is called “virtual clinical trials.”
AIMS: This study aimed to develop software tools for the simulation of radionuclide visualization of myocardial perfusion by single-photon emission computed tomography combined with computed tomography using 99mTc-MIBI as the radiopharmaceutical and perform studies aimed at improving the accuracy of single-photon emission computed tomography.
MATERIALS AND METHODS: A software package “Virtual platform for simulations of single-photon emission computed tomography combined with computed tomography method in nuclear cardiology” was developed using digital patient models, a scanner, and assessment of the state of the myocardium using digital images of the left ventricle in the form of a “polar map.” Verification of the software package was performed by comparison with clinical data obtained at the National Medical Research Center of Cardiology Named After Academician E.I. Chazov (Moscow). Simulation computer tests were performed, in which the accuracy of assessing the state of the myocardium was assessed, depending on the approach to normalizing the polar map and corrective factors in the reconstruction algorithm.
RESULTS: The results of the simulation tests revealed that the assessment of left ventricular myocardial perfusion significantly depended on the method of normalizing the polar map and considered corrective factors in the reconstruction algorithm. The most accurate estimates were obtained by calculating the normalization coefficient from the average value of activity in the normal zone of the myocardium. The common approach to pixel normalization with maximum intensity can lead to errors. The results of the virtual trials were fully consistent with clinical observations.
CONCLUSIONS: The transition from relative normalized values of activity in the myocardium to absolute quantitative estimates may eliminate existing limitations and uncertainties and is the main condition for improving the diagnostic accuracy of single-photon emission computed tomography combined with computed tomography in nuclear cardiology.
Texto integral
BACKGROUND
Single-photon emission computed tomography with computed tomography (SPECT/CT) is a modern diagnostic technique in nuclear medicine. It is widely accepted as the clinical standard for examining patients with cardiovascular diseases [1]. SPECT/CT imaging can detect myocardial perfusion defects (impaired blood supply) that precede irreversible fatal damage. An intravenous radiopharmaceutical is administered during the examination, which is distributed in the myocardium proportional to blood flow and reflects myocardial perfusion. Radiopharmaceuticals accumulate only in healthy myocardial cells and hence serve as a marker of normal function.
SPECT imaging assesses heterogeneous radiopharmaceutical uptake in left ventricular (LV) cardiomyocytes. Slices and “polar maps” are used to visualize the LV. A polar map is a graphical digital representation of the entire surface of the LV myocardium in a single planar image that enables measurement of normal perfusion areas and the extent and severity of damage. Three commercial software packages were developed to display the LV as a polar map:
- 4D-MSPECT (University of Michigan Medical Center, Michigan, USA) [2];
- Emory Cardiac Toolbox (ECTb; Emory University, Atlanta, USA) [3];
- Quantitative Perfusion SPECT (QPS) (Cedars-Sinai Medical Center, Los Angeles, USA) [4].
All three packages are currently standardized and widely used in clinical SPECT systems. However, these packages provide different quantitative assessments of the myocardium [5]. According to an editorial by Germano [6], the final results of different software packages are generally comparable; however, significant differences were found between the packages in the quantitative assessment of myocardial perfusion.
How precise the estimates are and how closely they match the actual distribution of radiopharmaceuticals in the myocardium remains unclear. Studies that compare the polar maps of the reconstructed image of the LV myocardium to a reference polar map of a myocardial phantom with a known radiopharmaceutical distribution are required to assess the accuracy of SPECT imaging in nuclear cardiology. Such studies are performed in clinical settings using calibration phantoms (in vitro). However, owing to the high cost and radiation exposure of researchers, performing dozens or hundreds of such studies is challenging. Furthermore, studies with calibration phantoms do not capture the entire range of clinical cases. A viable alternative is computer simulation (in silico) using digital anthropomorphic phantoms to represent patients with various body types and lesions of various sizes and locations. Computer simulation encompasses all sequential stages of SPECT/CT imaging, from radiopharmaceutical distribution in the patient’s organs to semiquantitative perfusion assessment using a polar map. This approach, called virtual clinical trials, has been actively evolving in high-tech nuclear medical centers worldwide over the last two decades [7]. Such research has only recently become available in Russia [8, 9].
AIM
This study aimed to develop a virtual platform for simulation testing of SPECT/CT in nuclear cardiology that will use digital models of the patient, scanner, and myocardial assessment based on digital representations of the left ventricle in the form of a polar map. For the first time, computer simulation experiments included the analysis of the relationship between semiquantitative LV myocardial perfusion assessment and the polar map standardization approach and correction factors in the reconstruction algorithm.
MATERIALS AND METHODS
We developed a virtual platform for simulation testing of SPECT/CT in nuclear cardiology using digital models of the patient, scanner, and myocardial assessment based on digital representations of the left ventricle in the form of a polar map. The software package has a modular structure and includes four modules that simulate all sequential stages of the examination, from radiopharmaceutical (technetium-99m methoxy isobutyl isonitrile, 99mTc-MIBI) distribution in the patient’s organs to LV myocardial perfusion assessment using polar maps:
- Virtual patient program;
- Virtual scanner program;
- Image reconstruction algorithms program;
- Polar map program.
Virtual Patient program
An anthropomorphic mathematical phantom (mathematical model of torso, MMT) developed at the Institute of Theoretical and Applied Mechanics (Novosibirsk) was used [9, 10]. Each organ of the MMT phantom was generated using analytical geometry equations describing appropriate three-dimensional (3D) shapes (planes, cones, cylinders, paraboloids, ellipsoids, etc.). These shapes were overlaid, intersected, and truncated using logical Boolean operators to generate complex geometric compositions that describe the outlines of organs close to the Atlas images [11]. The phantom is represented as 64 × 64 × 64 or 128 × 128 × 128 digital arrays.
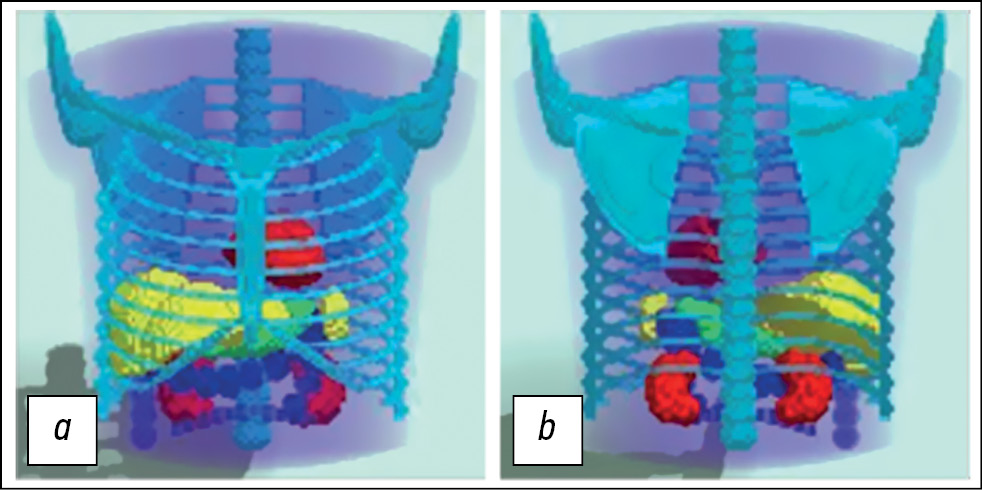
MMT is a voxel phantom based on analytical geometry equations that describe surfaces (boundaries) dividing structures with different morphological characteristics. It is possible to generate phantoms with different anatomical structures and in different positions by modifying the parameters of the geometric shapes. This study used an anatomical model of a typical male patient in a position with his arms up. The model includes the torso, chest bones, lungs, heart, spleen, stomach, and kidneys. The large intestine represents the intestines. Diagnostic nuclear medicine rarely requires detailed imaging of fine anatomical structures. The MMT does not consider heartbeat and respiratory excursion. This model generally corresponds to modern SPECT/CT systems in the phase mode, with cardiac and respiratory motions removed. The model is presented in Fig. 1.

Fig. 1. Three-dimensional mathematical model of the torso, simulating the anatomical structure of the average male patient in a position with arms raised up: a - front view; b — rear view. The model is specified in a discrete representation of 128×128×128.
The distribution of radiopharmaceuticals in various organs, rather than the anatomical structure of the patient, plays a critical role in nuclear medicine simulation studies. The virtual patient program generates a 3D map of radiopharmaceutical uptake (“activity map”) in the MMT phantom using clinical data on the distribution of 99mTc-MIBI. As an example, Fig. 2 shows clinically reconstructed SPECT images of a real patient, with activity values in several organs in pulse/voxel units. Data were collected using SPECT/CT imaging (Philips BrightView XCT, Philips, Netherlands) at the EI Chazov National Medical Research Center of Cardiology. These values may differ among patients. The present study used the values shown in Table 1 when creating an activity map for the MMT phantom. A homogeneous distribution of activity within each organ was specified, except for modeling LV myocardial ischemic injury.

Fig. 2. Clinical data. Relative values (pulse/voxel) of accumulation of the radiopharmaceutical 99mTc-MIBI in the patient’s chest organs. The images were obtained during examination of the patient using single-photon emission computed tomography combined with computed tomography using a Philips BrightView XCT installation at the Federal State Budgetary Institution “National Medical Research Center for Cardiology named after Academician E.I. Chazov" of the Ministry of Health of the Russian Federation.
Table 1. Relative 99mTc-MIBI uptake in phantom organs in the mathematical model of the torso
Organ | Relative 99mTc-MIBI uptake, pulse/voxel |
Soft tissues | 130 |
Lungs | 100 |
Liver | 900 |
Heart | 750 |
Large intestine | 1000 |
Gallbladder | 2500 |
Figure 3 shows the activity map for the phantom. The image is cropped in accordance with the gamma camera dimensions. The lungs, kidneys, spleen, and stomach are not shown because the concentration of radiopharmaceutical is nearly the same as that in soft tissues. LV, liver, gallbladder, and intestinal loops are clearly visualized. The heart model is represented by the LV because the right ventricle is practically invisible on SPECT images because of its thin walls.

Fig. 3. a — radiopharmaceutical accumulation map: three-dimensional distribution of relative concentration values of 99mTc-MIBI, calculated based on a mathematical model of the torso. The map is specified in a discrete representation of 128×128×100; b - attenuation map generated based on the mathematical model of the torso. The map is specified in a discrete representation of 128×128×100. A central longitudinal section is shown.
In clinical tests, CT findings are used to account for the attenuation of gamma radiation in biological tissues of various densities, and an individual 3D attenuation map is generated. An attenuation map for the MMT phantom was generated in this study, which included the main differences by substance density. Three media of different densities were studied: lungs (air), soft tissues (water), and skeletal bones. Table 2 presents the attenuation coefficients for 140 keV gamma radiation used in this study [12].
Table 2. Attenuation coefficients for 140 keV gamma radiation (technetium)
Organ (medium) | Attenuation coefficients for 140 keV gamma radiation, 1/cm |
Soft tissues (water) | 0.15 |
Lungs (air) | 0.04 |
Bones | 0.28 |
Thus, the virtual patient program generates three phantoms: anthropomorphic anatomical MMT phantom, activity map, and attenuation map.
Virtual Scanner program
The virtual scanner program modeled SPECT/CT imaging in a “virtual patient.” Raw projection data were calculated using the Monte Carlo procedure. From a mathematical standpoint, this stage solves a direct problem: gamma radiation transmission from a specified spatial source through substances of different densities. There are two main approaches to solving such problems.
The first is based on solving transfer equations that describe gamma radiation transmission in a substance and on geometric approximations when calculating gamma ray transmission through a collimator detector system. However, this approach requires additional shadowing procedures to account for Poisson data.
The second is a statistical approach based on the Monte Carlo procedure. This approach employs a random (pseudorandom) number generator in various statistical modeling methods for distributions characterizing physical processes such as the Poisson distribution (radioactive decay, mean free path), Klein–Nishina–Tamm distribution (angular distribution of scattered photons), and Gaussian distribution (different fluctuations of the detecting system). The modeling of the raw data collection included several stages:
- Gamma ray emission by a source;
- Radiation transmission through a substance;
- Detector response formation.
At the stage of modeling gamma ray emission by a source, coordinates, directions, energy, and other variable gamma ray characteristics are generated based on specified distributions. For modeling the 99mTc-MIBI source, the distribution of particle emission directions was considered to be uniform over the entire solid angle, and the energy distribution was specified by a delta function of 140.5 keV. The activity map defines the distribution of the gamma ray emission coordinates.
Modeling radiation transmission through a substance is time-consuming. Thus, properly selecting models for describing physical processes and accurately implementing them algorithmically is critical. We used our own software, which implements several validated algorithms for modeling both the transmission of gamma rays and their interactions with a substance.
The NIST XCOM database was used as an interaction cross-sectional database for gamma ray interactions with substances [13]. Three main types of interaction were considered during gamma ray transmission through a substance: the photoelectric effect, Compton scattering, and coherent scattering. The scattering angle indicators for Compton and coherent scattering were modeled using the algorithms provided in the Livermore low-energy electromagnetic models of the Geant4 modeling package (Geant4 Collaboration) [14]. A combination of algorithms was used for gamma ray transmission modeling. If the volume in which the gamma ray is located at a time moment is inhomogeneous (defined voxel-wise or parametrically), the peak cross-section method is used to generate the mean free path (Woodcock tracking) [15]. If the volume is homogeneous, the mean free path is generated according to the law of exponential attenuation. These methods determine the mean free path, which is then compared to the particle path length before leaving or entering another volume, which is calculated via algorithms for determining the ray intersection with geometric shapes.
In this study, the gamma ray transmission was calculated through a low-energy high-resolution collimator. The method for calculating projection data was verified by comparing it with clinical findings. Figure 4 shows an example of raw data generated using the Monte Carlo procedure: left anterior oblique (a), frontal (b), right anterior oblique (c), and left lateral (d) projections. The projections were obtained considering the 99mTc-MIBI uptake map and virtual patient attenuation map (Fig. 3). Similar clinical projections obtained using SPECT/CT imaging (Philips BrightView XCT) at the EI Chazov National Medical Research Center of Cardiology are shown for comparison. The LV myocardium images in these projections are in good agreement.

Fig. 4. Comparison of projections obtained in a clinical setting when examining a patient (top) and calculated by the Monte Carlo method (bottom) using a three-dimensional activity map of a virtual patient: a - left anterior oblique projection; b — frontal projection; c — right anterior oblique projection; d — left lateral projection. Clinical data were obtained during examination of a patient using single-photon emission computed tomography using a Philips BrightView XCT installation at the Federal State Budgetary Institution “National Medical Research Center for Cardiology named after Academician E.I. Chazov" of the Ministry of Health of the Russian Federation.
Image Reconstruction Algorithms program
For image reconstruction, modern commercial SPECT/CT systems use algorithms based on maximum likelihood expectation maximization (MLEM) [16] and its accelerated version, ordered subset expectation maximization (OSEM):
(1)
where:
- and are activity (pulse/voxel) in the jth voxel during iteration steps (n + 1) and n, respectively;
- gi is the number of recorded pulses in the ith pixel of the detector;
- aij is a system matrix that describes the probability that a photon emitted in the jth voxel of the uptake map will be recorded in the ith pixel of the detector.
A homogeneous distribution is used during the first step.
We used our own image reconstruction algorithms software to calculate the system matrix, which considers the physical effects associated with gamma radiation transmission through biological tissues and a collimator–detector system. The accuracy of the system matrix calculation determines the quality of the reconstructed images. The system matrix elements are presented as follows:
(2)
where:
- estimates the likelihood that a photon emitted in the jth voxel of the activity map will pass through the virtual patient’s biological tissues and hit the kth pixel of the collimator surface. That is, this variable describes the gamma flux attenuation due to scattering in biological tissues. Attenuation correction (AC) is used to describe this effect.
- estimates the likelihood that a photon will pass through the collimator and be recorded as a pulse in the kth pixel of the detector. That is, this variable describes the effect of passing through the collimator and detector crystal while accounting for the point spread function. Resolution recovery (RR) is used to describe this effect.
Figure 5 shows a fragment of the 99mTc-MIBI uptake map of the MMT phantom and its reconstruction using the OSEM algorithm based on the data obtained in the virtual scanner program (Fig. 4). A similar clinical image obtained at the EI Chazov National Medical Research Center of Cardiology using the Astonish algorithm during myocardial perfusion imaging in a real patient is shown for comparison.

Fig. 5. Distribution of the radiopharmaceutical 99mTc-MIBI in the chest organs: a - phantom; b - reconstruction; c — clinical case. A clinical case was obtained during examination of a patient using single-photon emission computed tomography at the Federal State Budgetary Institution “National Medical Research Center for Cardiology named after Academician E.I. Chazov" of the Ministry of Health of the Russian Federation.
Polar Map program
Because existing commercial polar map packages are closed source software and cannot be modified, several researchers use their own software [17–20]. One of the first polar map generation programs was created at the Catholic University of Leuven (Belgium) for computer simulation studies [17]; it was later used by Turco et al. [20].
A research group from Kanazawa University, Japan, proposed an alternative to the three standard packages [18]. The authors discovered that the diagnostic results of the same patient differed when different software packages (4D-MSPECT, ECTb, and QPS) were used; thus, they created their own open source software to standardize the research. In Russia, polar maps were developed by Kotina et al. in St. Petersburg [19].
An example of a clinical image obtained at the EI Chazov National Medical Research Center of Cardiology using the QPS package is shown in Fig. 6. The first column (on the left) presents images in slice mode after a stress test; the second column presents the same images at rest. In the tomographic slice mode, data were displayed in three cross-sections: along the vertical long axis, horizontal long axis, and short axis. The third column presents polar maps in percentage mode (from top to bottom: stress map, rest map, and map of differences). The third column shows 3D LV images.

Fig. 6. Graphical presentation of the results of a clinical examination of myocardial perfusion using single-photon emission computed tomography. The images were obtained using the QPS software package when examining a patient at the Federal State Budgetary Institution “National Medical Research Center for Cardiology named after Academician E.I. Chazov" of the Ministry of Health of the Russian Federation.
In this study, a method for generating a polar map that is similar to the commercial QPS software was devised. The LV image is manually segmented, the main axis is determined, and the image is rotated. The epicardial and endocardial surfaces specified in the phantom were used to eliminate delineation errors. The LV is moved to a separate file and divided into layers along the long axis (Fig. 7). Subsequently, data on cumulative activity (pulse/voxel) in each layer are collected. The distribution of cumulative activity proportional to the degree of myocardial perfusion was recorded sequentially in each layer as circular profiles. The data collection process can be divided into two nested cycles. In the first cycle, there is a descent through the layers from the top of the LV (basal part) to the bottom (apical part). In the second cycle, data on cumulative activity in each sector of the cross-section are collected. The mean value was calculated based on the thickness of the myocardium and in each sector of the slice. According to Turco et al. [20], this method of calculating cumulative activity provides better accuracy than using the uptake value based on the maximum value in the myocardium. The number of sectors into which each slice is divided is calculated automatically based on the shape and size of the LV. As shown in Fig. 7, the cumulative activity values in each cross-section are projected onto the polar diagram as concentric rings, with the basal part of the LV corresponding to the outer ring and the apical part corresponding to the inner ring.

Fig. 7. The vertical long axis (VLA, left) section of the left ventricle model is divided into short axis (SAX) layers, and the accumulated activity values in each section are projected onto the polar diagram in concentric rings so that the basal part of the left ventricle corresponds to the outer ring, and the apical part — internal (arrows show where each layer is projected onto the polar map).
“VIRTUAL” studies
Methodology of computer simulation
Computer simulation included all sequential stages of myocardial perfusion assessment using SPECT/CT imaging with 99mTc-MIBI, from radiopharmaceutical distribution in the patient’s organs to perfusion assessment using a polar map. First, the virtual patient program calculated the radiopharmaceutical distribution using the MMT anatomical model. Imaging in a virtual patient was modeled using the virtual scanner program and the Monte Carlo procedure. The data collection parameters were close to clinical parameters and were determined according to the European Association of Nuclear Medicine (EANM) protocol [21]. The gamma camera had a 180° arc from the left posterior oblique projection to the right anterior oblique projection. Data recording was simulated in a step-by-step mode with a circular orbit. The number of projections (n = 32) and exposure time per projection (15 s) corresponded to the standard clinical protocol for Philips BrightView XCT. Approximately 100,000 pulses (counts) were recorded in each projection because of simulation using the Monte Carlo procedure. The total number of recorded pulses during raw data collection was 4,000,000. The image was reconstructed using the conventional OSEM algorithm (eight subsets, two iterations) based on the calculated projection data. Using a polar map software, the 3D LV image was then displayed as slices and a polar map, and a semiquantitative myocardial perfusion assessment was performed. The accuracy of SPECT imaging was assessed by comparing the polar map of the reconstructed image of the LV myocardium with a reference polar map of a phantom, i.e., a virtual patient with a known, specified radiopharmaceutical distribution.
Problems of interest
Computer simulation studies analyzed the accuracy of myocardial perfusion assessment depending on the polar map standardization approach and correction factors in the reconstruction algorithm.
Relationship between myocardial perfusion assessment and the polar map standardization approach
The homogeneity of radiopharmaceutical distribution was assessed based on reconstructed LV image mapping as a standard 17-segment polar map. Clinical studies have assessed the following parameters of LV myocardial perfusion: summed rest score (SRS), summed stress score (SSS), and summed difference score. In mathematical modeling, the radiopharmaceutical distribution was supposed to correspond to the rest mode. In this study, the total SRS and local relative perfusion in percentage mode (normalization) were calculated using the three approaches described in the literature:
A. Smax score
This approach is the most common and used to generate polar maps with the 4D-MSPEC [2], ECTb [3], and QPS [4] software. The pixel with the highest activity is selected on the polar map and assigned a value of 100%. The remaining pixels are assigned a percentage value based on their proportion to the maximum value. The mean uptake values (in percentage) for each sector are then calculated, as well as their sum (Smax), which is an analog of the SRS parameter.
B. S90 score
To minimize the impact of false hot spots, the Cedar-Sinai AutoQUANT QPS/QGS v.7.2 user manual recommends normalizing polar maps so that the 90th percentile equals 100%. The mean uptake values (in percentage) for each sector are then calculated, as well as their sum (S90).
C. Snorm score
In a recent publication, Garcia et al. [22] have presented recommendations from the authors of the commercial software 4D-MSPEC [2], ECTb [3], and QPS [4] (2007) for polar map standardization. The authors recommend using “the perfusion intensity in the most normal area within the LV,” rather than the maximum intensity value, as 100%. All pixel values greater than or equal to the normal intensity are considered as 100%; the rest are calculated by proportion. The mean uptake values for each sector are then calculated, as well as their sum (Snorm). Okuda et al. [18] have proposed standardization based on the mean intensity in the normal area of the myocardium. In this case, a normal area is defined as a cluster of pixels with intensity in the 80th (±10) percentile for the entire data sample.
For all three approaches, the mean radiopharmaceutical uptake was calculated in percentage mode for each sector of the polar map. Perfusion was assessed using the threshold values shown in Table 3, which serve as the default template. Based on the calculated percentages of uptake, each sector is assigned a score from 0 to 4, and these scores are added together. As a result, total scores (analogs of the SRS parameter) are obtained.
Table 3. Left ventricular myocardial perfusion assessment
Lesion severity | Score | Segment perfusion (relative to the maximum) |
Normal value | 0 | ≥70% |
Mild perfusion defect | 1 | 50–69% |
Moderate perfusion defect | 2 | 30–49% |
Severe perfusion defect | 3 | 10–29% |
No perfusion | 4 | <10% |
Relationship between myocardial perfusion assessment and correction factors in the reconstruction algorithm
In Russia and worldwide, there are various operational SPECT systems that do not have CT support. Computer simulation studies included a comparative analysis of myocardial perfusion assessment with and without attenuation correction in the reconstruction algorithm. When reconstructing images with AC, the value in formula (2) was calculated individually for each nonzero activity voxel, taking the attenuation map into account. In computer simulation without attenuation correction (non-AC), = 1. For the reconstructed images of the LV myocardium, AC and non-AC polar maps were generated.
According to the EANM manual [21], integrating the effect of “blurring” of a point source image (RR) in the reconstruction algorithm requires rigorous phantom tests. In this study, computer simulation studies included a comparative analysis of polar maps generated in reconstruction modes with and without image blurring (RR and non-RR, respectively).
RESULTS
Study subjects
Computer simulation studies included two virtual patients: one with a healthy heart and the other with an ischemic injury in the anterolateral zone of the LV myocardium. Based on the MMT model, the virtual patient program specified the matching 99mTc-MIBI uptake maps or activity maps for these patients.
In the first case, an MMT phantom with a homogeneous distribution of 99mTc-MIBI activity in the LV myocardium was used as a virtual patient. The reference polar map for this phantom is shown in Fig. 8. It is homogeneous and independent of the standardization approach. In each sector, the relative radiopharmaceutical uptake corresponded to 100%, and the reference SRS perfusion score (Sref) was 0.

Fig. 8. Reference polar map of left ventricular myocardial perfusion of a virtual patient with healthy myocardium (normal). SRS (Summed Rest Score) values:
In the second case, a virtual patient with an ischemic injury of the left ventricle (LV) myocardium was studied. The 99mTc-MIBI uptake map of the MMT mathematical phantom included a defect in the anterolateral zone of LV with decreased radiopharmaceutical uptake. Reference polar maps generated based on the described standardization approaches (A, B, and C) (Fig. 12). Reference SRS perfusion scores for these maps differed slightly:
The general scheme of the computer tests was as follows. After simulation imaging in virtual patients, image reconstruction was performed using the OSEM technique with or without correction factors. On the reconstructed images, LV segmentation was performed, and three types of polar maps standardized in accordance with approaches A, B, and C were generated.
Key study findings
Case 1: a virtual patient with a healthy left ventricular myocardium
The reference polar map for this case is shown in Fig. 8; the reference SRS (Sref) = 0. Figure 9 shows the polar maps generated using reconstruction with attenuation correction and resolution recovery (АС/RR). The polar maps were standardized according to approaches A, B, and C. The activity distribution no longer appears heterogeneous because of reconstruction errors. In all three maps, a visible decrease in activity was noted in the apical region. This occurrence, known as a false apical defect, is frequently observed on clinical images. SRS perfusion scores calculated using various standardization approaches were as follows: Smax = 10, S90 = 1, and Snorm = 3. S90 and Snorm scores are within the normal range, whereas Smax is overestimated and provides an incorrect perfusion assessment. Overestimation of Smax corresponds to clinical practice. The software used in SPECT systems uses polar map normalization by the pixel with maximum intensity. According to Ansheles [1], “one of the problems with images is that, for unknown reasons, the total scores (SSS, SRS) can be significantly overestimated.”

Fig. 9. AC/RR. Polar map of reconstructed left ventricular myocardial perfusion image. The reconstruction was carried out with attenuation correction (AC) and resolution recovery (RR). Values of the Summed Rest Score (SRS) indicator for three methods for calculating the polar map: a - Smax=10; b — S90=1; c — Snorm=3.
Figure 10 shows polar maps generated by image reconstruction using the OSEM algorithm without attenuation correction but with resolution recovery (non-AC/RR). The images show an artifact in the form of decreased activity at the bottom of the polar map. This artifact is typical of non-AC clinical images. Notably, the false apical defect disappeared, which is common in non-AC images in clinical practice. The total SRS perfusion scores were as follows: Smax = 17, S90 = 9, and Snorm = 4. It is significantly higher than the reference value (Sref = 0). Non-AC images require a different template obtained in the same mode.

Fig. 10. non-AC/RR. Polar map of the reconstructed left ventricle. The reconstruction was performed without attenuation correction (non-AC), but with resolution restoration (RR). Values of the Summed Rest Score (SRS): a — Smax=17; b - S90=9; c — Snorm=4.
Figure 11 shows the polar maps generated by image reconstruction using the OSEM algorithm with attenuation correction but without resolution recovery (AC/non-RR). The total SRS perfusion scores were as follows: Smax = 9, S90 = 3, Snorm = 4. The AC/RR images in Fig. 9 and the AC/non-RR images in Fig. 11 look similar; however, the SRS scores in the AC/RR mode are more accurate.

Fig. 11. AC/non-RR. Polar map of reconstructed left ventricular myocardial perfusion image. The reconstruction was carried out with attenuation correction (AC), but without taking into account resolution restoration (non-RR). Summed Rest Score (SRS): a — Smax=9; b — S90=3; c — Snorm=4.
Case 2: a virtual patient with an ischemic injury in the LV myocardium
The reference polar map for case 2 is shown in Fig. 12; the reference SRS scores for the three polar map standardization approaches differ slightly and amount to Polar maps generated for AC/RR reconstructed images of a virtual patient with an ischemic injury are shown in Fig. 13. SRS: Smax = 12, S90 = 6, and Snorm = 6.

Fig. 12. Reference polar maps of left ventricular perfusion with ischemic lesions. Values of the Summed Rest Score (SRS): a — Smax=6; b — S90=5; c — Snorm=6.

Fig. 13. AC/RR. Polar maps of reconstructed left ventricular myocardial perfusion images. The reconstruction was carried out with absorption correction (AC) and taking into account resolution restoration (RR). Summed Rest Score (SRS) scores: a — Smax=12; b - S90=6; c — Snorm=6.
The reconstructed defect in Fig. 13 corresponds to the images on the reference polar map in Fig. 12 for all three polar map standardization approaches on AC/RR images. However, an artifact from the right ventricle appeared, which mirrored the true defect.
Figure 14 reveals the polar maps generated by image reconstruction in the non-AC/RR mode. The defect is smaller than the reference polar map in Fig. 12. A false defect was observed in the lower right part, whereas the apical defect was absent.

Fig. 14. non-AC/RR. Polar map of reconstructed left ventricular perfusion image. The reconstruction was carried out without attenuation correction (non-AC), but taking into account resolution restoration (RR). Summed Rest Score (SRS) scores: a — Smax=23; b - S90=7; c — Snorm=2.
Figure 15 shows polar maps generated by image reconstruction in AC/non-RR mode: with attenuation correction but without resolution recovery. The defect boundaries roughly correspond to those in the AC/RR mode. The total SRS scores for various map generation approaches were as follows: Smax = 21, S90 = 10, and Snorm = 6.

Fig. 15. AC/non-RR. Polar map of the reconstructed left ventricle. The reconstruction was carried out with attenuation correction, but without taking into account the resolution restoration. Summed Rest Score (SRS) scores: a — Smax=21; b - S90=10; c — Snorm=6.
DISCUSSION
Summary of the key study findings
The findings of the virtual tests were completely consistent with the clinical data. The polar maps of the reconstructed LV images of virtual patients showed the same errors (artifacts) as in the clinical images of real patients. These findings confirm that the virtual platform for the simulation testing of SPECT/CT in nuclear cardiology is appropriate for addressing nuclear cardiology problems. AC/RR mode reconstruction and polar map standardization by the mean activity in the normal area of the myocardium yielded perfusion and ischemic focus assessment results closest to the exact values.
Discussion of the key study findings
LV myocardial perfusion imaging by SPECT/CT is an outcome of solving the inverse ill-posed problem of image reconstruction based on Poisson data. Because the theory of solving ill-posed stochastic problems is a relatively young branch of mathematics, complex current reconstruction algorithms “cannot work miracles” [21], and the resulting solutions are prone to errors (artifacts). The same artifacts seen in clinical images were observed in mathematical modeling similar to clinical conditions.
In image reconstruction using the OSEM algorithm in AC mode, a false apical defect is observed on all polar maps. According to Ansheles [1], this artifact occurs in ~50% of clinical cases after reconstruction in AC mode and is rarely considered a significant defect. In practice, distinguishing between a false apical defect and minor focal lesion in the apical region can be challenging. In our simulation studies of a virtual patient with an ischemic injury of the myocardium, the lesion partially overlapped the area of the false apical defect (Fig. 13), leading to overestimation of defect severity.
In non-AC images (Figs. 13 and 14), an artifact in the form of decreased activity was noted in the bottom of the polar map. The false apical defect was absent. This is common for clinical polar maps generated in the non-AC mode. A visual comparison of polar maps derived from a mathematical simulation of a case with an ischemic injury of the LV myocardium reveals that the lesion size closest to the reference size is observed in AC/RR mode. In image reconstruction in the non-AC/RR mode, the lesion is significantly smaller, which corresponds to the clinical findings. According to Ansheles [23], the SRS scores and area of transient ischemia are significantly greater in AC mode than in non-AC mode.
The simulation approach has the benefit of comparing semiquantitative assessments for each sector of polar maps, as well as the total SRS parameters of the reconstructed image, to a template (polar map of the phantom). A comparison analysis revealed that the lower LV wall exhibited falsely increased activity, which could be influenced by liver activity (an effect not obvious to the doctor and is caused by the scattering of gamma rays emitted by the liver and scattered on the lower LV wall). Some of these scattered photons enter the detector exactly in the image of the left ventricle, which may cause an error.
In this situation, standardization by the maximum pixel results in hypoperfusion and increased total SRS score compared with the reference polar map. Polar map standardization using the maximum pixel resulted in overestimation of SRS in all cases. The best results were obtained when standardization using the mean activity in the normal area was used. This is consistent with the novel recommendations by the authors of standard commercial polar map packages [22].
Furthermore, artifacts caused by limitations in the reconstruction algorithms are present in images of healthy subjects. Thus, modern SPECT/CT systems use relative values based on a polar map of the reconstructed LV and relative values in comparison to reference databases, allowing identification of perfusion defects. The findings of these studies indicate that one should rely on comparative relative values rather than relative values based on a polar map of the reconstructed LV. However, this approach has a significant limitation: all conditions for obtaining clinical images should be similar to those for creating a reference database.
CONCLUSION
Our findings demonstrate that computer simulation can help clinicians better understand the limitations, uncertainties, and errors in myocardial perfusion assessment. The transition from relative standardized values of activity accumulation in the myocardium to absolute quantitative assessments can eliminate existing limitations and uncertainties and is the primary condition for improving the diagnostic accuracy of SPECT/CT imaging in nuclear cardiology.
ADDITIONAL INFORMATION
Funding source. This study was not supported by any external sources of funding.
Competing interests. The authors declare that they have no competing interests.
Authors’ contribution. All authors made a substantial contribution to the conception of the work, acquisition, analysis, interpretation of data for the work, drafting and revising the work, final approval of the version to be published and agree to be accountable for all aspects of the work.
N.V. Denisova — development of the concept and planning of scientific work, drafting the manuscript, final approval of the published version of the manuscript, development of the “Virtual Patient” and “Reconstruction Algorithms” programs; M.A. Gurko — development of the “Virtual Tomograph” program, participation in writing and editing the manuscript; I.P. Kolinko — development of the “Polar map” program; A.A. Ansheles, V.B. Sergienko — clinical data, analysis of scientific papers, critical revision with the introduction of valuable intellectual content.
Sobre autores
Natalya Denisova
Novosibirsk State University; Khristianovich Institute of Theoretical and Applied Mechanics
Autor responsável pela correspondência
Email: NVDenisova2011@mail.ru
ORCID ID: 0000-0001-9374-1753
Código SPIN: 4928-8185
Dr. Sci. (Phys.-Math.), Professor
Rússia, Novosibirsk; NovosibirskMikhail Gurko
Novosibirsk State University; Khristianovich Institute of Theoretical and Applied Mechanics
Email: m.gurko@g.nsu.ru
ORCID ID: 0000-0002-6154-172X
Código SPIN: 3214-5765
Rússia, Novosibirsk; Novosibirsk
Inna Kolinko
Novosibirsk State University; Khristianovich Institute of Theoretical and Applied Mechanics
Email: kiina131313@gmail.com
ORCID ID: 0009-0001-6779-1535
Código SPIN: 1625-6043
Rússia, Novosibirsk; Novosibirsk
Alexey Ansheles
National Medical Research Centre of Cardiology Named After Academician E.I. Chazov
Email: aansheles@gmail.com
ORCID ID: 0000-0002-2675-3276
Código SPIN: 7781-6310
MD, Dr. Sci. (Med.), Assistant Professor
Rússia, MoscowVladimir Sergienko
National Medical Research Centre of Cardiology Named After Academician E.I. Chazov
Email: vbsergienko@yandex.ru
ORCID ID: 0000-0002-0487-6902
Código SPIN: 4918-3443
MD, Dr. Sci. (Med.), Professor
Rússia, MoscowBibliografia
- Ansheles AA, Sergienko VB. Yadernaya Kardiologiya. Sergienko VB, editor. Moscow: FGBU «NMITs kardiologii» Minzdrava Rossii; 2021. (In Russ).
- Ficaro E, Lee B, Kritzman J, Corbett J. Corridor4DM: The Michigan method for quantitative nuclear cardiology. Journal of Nuclear Cardiology. 2007;14(4):455–465. doi: 10.1016/j.nuclcard.2007.06.006
- Garcia E, Faber T, Cooke C, et al. The increasing role of quantification in clinical nuclear cardiology: The Emory approach. Journal of Nuclear Cardiology. 2007;14(4):420–432. doi: 10.1016/j.nuclcard.2007.06.009
- Germano G, Kavanagh P, Slomka P, et al. Quantitation in gated perfusion SPECT imaging: The Cedars-Sinai approach. Journal of Nuclear Cardiology. 2007;14(4):433–454. doi: 10.1016/j.nuclcard.2007.06.008
- Wolak A. Quantitative myocardial-perfusion SPECT: Comparison of three state-of-the-art software packages. Journal of Nuclear Cardiology. 2008;15(1):27–34. doi: 10.1016/j.nuclcard.2007.09.020
- Germano G. Quantitative measurements of myocardial perfusion and function from SPECT (and PET) studies depend on the method used to perform those measurements. Journal of Nuclear Cardiology. 2018;25(3):925–928. doi: 10.1007/s12350-016-0757-z
- Abadi E, Segars WP, Tsui BMW, et al. Virtual clinical trials in medical imaging: a review. Journal of Medical Imaging. 2020;7(4):1. doi: 10.1117/1.JMI.7.4.042805
- Denisova NV, Ansheles AA. A study of false apical defects in myocardial perfusion imaging with SPECT/CT. Biomedical Physics & Engineering Express. 2018;4(6):065018. doi: 10.1088/2057-1976/aae414
- Denisova N, Ondar M, Kertesz H, Beyer T. Development of anthropomorphic mathematical phantoms for simulations of clinical cases in diagnostic nuclear medicine. Computer Methods in Biomechanics and Biomedical Engineering: Imaging & Visualization. 2023;11(3):433–441. doi: 10.1080/21681163.2022.2074308
- Denisova NV. Computational Phantoms for Medical Radiology. Medical Radiology and Radiation Safety. 2022;67(6):51–61. doi: 10.33266/1024-6177-2022-67-6-51-61
- Sinel’nikov RD, Sinel’nikov AYa, Sinel’nikov YaR. Atlas Anatomii Cheloveka. 2nd Volume. Moscow: Novaya volna; 2022. (In Russ).
- Patton JA, Turkington TG. SPECT/CT Physical Principles and Attenuation Correction. Journal of Nuclear Medicine Technology. 2008;36(1):1–10. doi: 10.2967/jnmt.107.046839
- Seltzer S. XCOM-Photon Cross Sections Database [Internet]. Gaithersburg (MD): NIST Standard Reference Database 8. [cited 2023 Oct 10]. Available from: https://www.nist.gov/pml/xcom-photon-cross-sections-database doi: 10.18434/T48G6X
- Ivanchenko VN, Incerti S, Allison J, et al. Geant4 electromagnetic physics: improving simulation performance and accuracy. In: Caruge D, Calvin C, Diop CM, Malvagi F, Trama JC, editorss. SNA + MC 2013 — Joint International Conference on Supercomputing in Nuclear Applications + Monte Carlo. doi: 10.1051/snamc/201403101
- Behlouli A, Visvikis D, Bert J. Improved Woodcock tracking on Monte Carlo simulations for medical applications. Physics in Medicine & Biology. 2018;63(22):225005. doi: 10.1088/1361-6560/aae937
- Shepp LA, Vardi Y. Maximum Likelihood Reconstruction for Emission Tomography. IEEE Transactions on Medical Imaging. 1982;1(2):113–122. doi: 10.1109/TMI.1982.4307558
- Nuyts J, Mortelmans L, Suetens P, Oosterlinck A, de Rou M. Model-based quantification of myocardial perfusion images from SPECT. Journal of nuclear medicine. 1989;30(12):1992–2001.
- Okuda K, Nakajima K, Hosoya T, et al. Quantification of myocardial perfusion SPECT using freeware package (cardioBull). Annals of Nuclear Medicine. 2011;25(8):571–579. doi: 10.1007/s12149-011-0504-0
- Ploskikh V, Kotina E. Challenges of gated myocardial perfusion SPECT processing. Cybernetics and Physics. 2021;10(3):171–177. doi: 10.35470/2226-4116-2021-10-3-171-177
- Turco A, Nuyts J, Gheysens O, et al. Lesion quantification and detection in myocardial 18F-FDG PET using edge-preserving priors and anatomical information from CT and MRI: a simulation study. EJNMMI Physics. 2016;3(1):9. doi: 10.1186/s40658-016-0145-4
- Verberne HJ, Acampa W, Anagnostopoulos C, et al. EANM procedural guidelines for radionuclide myocardial perfusion imaging with SPECT and SPECT/CT: 2015 revision. European Journal of Nuclear Medicine and Molecular Imaging. 2015;42(12):1929–1940. doi: 10.1007/s00259-015-3139-x
- Garcia EV, Slomka P, Moody JB, Germano G, Ficaro EP. Quantitative Clinical Nuclear Cardiology, Part 1: Established Applications. Journal of Nuclear Medicine. 2019;60(11):1507–1516. doi: 10.2967/jnumed.119.229799
- Ansheles AA. Specific features of interpretation of myocardial perfusion single-photon emission computed tomography with computed tomographic absorption correction. Journal of Radiology and Nuclear Medicine (Vestnik rentgenologii i radiologii). 2014;(2):5–20. (In Russ). doi: 10.20862/0042-4676-2014-0-2-5-20
Arquivos suplementares

