

")


Роль магнитно-резонансной томографии в выявлении злокачественных лёгочных узлов: систематический обзор и метаанализ
- Авторы: Васильев Ю.А.1,2, Панина О.Ю.1,2,3, Грик Е.А.3, Ахмад Е.С.1, Васильева Ю.Н.3
-
Учреждения:
- Научно-практический клинический центр диагностики и телемедицинских технологий
- Городская клиническая онкологическая больница № 1
- Московский государственный медико-стоматологический университет имени А.И. Евдокимова
- Выпуск: Том 2, № 3 (2021)
- Страницы: 301-312
- Раздел: Систематические обзоры
- Статья получена: 07.05.2021
- Статья одобрена: 04.07.2021
- Статья опубликована: 15.10.2021
- URL: https://jdigitaldiagnostics.com/DD/article/view/70306
- DOI: https://doi.org/10.17816/DD70306
- ID: 70306

Цитировать

Аннотация
Цель ― оценка возможности метода магнитно-резонансной томографии (МРТ) органов грудной клетки для выявления лёгочных узлов, подозрительных в отношении злокачественности, в сравнении с компьютерной томографией (КТ).
Материалы и методы. Проведён поиск в базах данных PubMed и Google Scholar за период до 7 апреля 2021 г. включительно. В соответствии с критериями соответствия были отобраны исследования, в которых проводилась оценка способности МРТ и КТ к выявлению лёгочных узлов, подозрительных в отношении злокачественности. Выбор метода анализа и группировки данных о чувствительности и специфичности выполняли по результатам оценки гетерогенности исследований. Для оценки статистической гетерогенности исследований, включённых в метаанализ, применяли критерий согласия Пирсона χ2 и индекс гетерогенности I2.
Результаты. По результатам поиска было отобрано 168 работ, в метаанализ вошло 21 исследование. Отобранные работы включали 1188 пациентов. По результатам метаанализа выявлено наличие статистически значимой гетерогенности p <0,00001 по критерию χ2 и индекс гетерогенности I2=99% для чувствительности и специфичности. В связи с этим для анализа данных использовали метод случайных эффектов. Значения чувствительности для МРТ находились в диапазоне от 70,4 до 100%, специфичности ― от 60,6 до 100%.
Заключение. МРТ обладает достаточной чувствительностью и специфичностью для определения злокачественности лёгочных узлов, обнаруженных при КТ-диагностике.
Ключевые слова
Полный текст
ВВЕДЕНИЕ
Лёгочный узел (solitary pulmonary nodule, SPN) ― единый, отграниченный округлый очаг размерами менее 3 см в диаметре [1, 2]. Лёгочной узел полностью окружён неизменённой лёгочной тканью, не связан с ателектазом, корнем лёгкого или средостением. Данное образование может представлять собой доброкачественные процессы, такие как гамартома, различные инфекционные поражения, гранулематозное воспаление, а также злокачественные процессы (такие как первичный рак лёгкого, метастатическое поражение или лимфома. Злокачественность узлов предполагается до тех пор, пока не доказано обратное [2].
В настоящее время компьютерная томография (КТ) является золотым стандартом для оценки и динамического контроля за лёгочными узлами, подозрительными на злокачественность [3]. КТ при наличии большого количества преимуществ имеет основной недостаток ― высокую лучевую нагрузку, которая, безусловно, увеличивается в ходе динамического контроля. C развитием и совершенствованием технического и программного обеспечения поиск новых альтернативных методов визуализации становится очевидным. Последние 20 лет изучение потенциального применения магнитно-резонансной томографии (МРТ) для диагностики заболеваний органов грудной клетки позволило выделить отдельную область научных исследований, посвящённую выявлению лёгочных узлов посредством МРТ. Преимуществом МРТ является отсутствие воздействия ионизирующего излучения, а также опциональная количественная оценка выявленных изменений даже при отсутствии введения контрастных препаратов.
Цель исследования ― оценка возможности МРТ органов грудной клетки по сравнению со стандартной КТ для выявления злокачественных лёгочных узлов.
МЕТОДЫ
Данная работа была оформлена согласно стандарту репортирования результатов систематического обзора и метаанализа PRISMA (Preferred Reporting Items for Systematic Reviews and Meta-Analyses) [4].
Тип исследований
Критерии включения:
- (I) проспективные исследования по типу случай-контроль, ретроспективные исследования по типу случай-контроль, проспективные когортные исследования, ретроспективные когортные исследования;
- (II) исследования, включающие описание использования МРТ для выявления злокачественных лёгочных узлов;
- (III) эталонным методом выступала КТ;
- (IV) наличие сведений о чувствительности и специфичности.
Критерии исключения:
- (I) полный текст работы недоступен;
- (II) исследование проводилось не на людях;
- (III) исследование проводилось с участием детей;
- (IV) описания клинических случаев, исследование серии случаев, систематические обзоры, метаанализы;
- (V) сочетание позитронно-эмиссионной томографии (ПЭТ) и КТ (ПЭТ/КТ) и сочетание позитронно-эмиссионной томографии и МРТ (ПЭТ/МРТ); исследования с контрастным усилением;
- (VI) включение в исследование пациентов с лёгочной формой туберкулёза и другими воспалительными заболеваниями лёгких.
Типы участников
Пациенты старше 18 лет.
В обзор не вошли пациенты, для которых отсутствовали данные по диагностике с применением стандартных эталонных методов (стандартная КТ органов грудной клетки).
Типы вмешательства
Исследования, в которых проводилась оценка способности МРТ и стандартной КТ к выявлению лёгочных узлов, подозрительных в отношении злокачественности.
Типы результатов
Первичные результаты: числовые значения чувствительности и специфичности МРТ лёгких для оценки выявления злокачественных лёгочных узлов.
Вторичные результаты: выявление наиболее оптимальных МР-импульсных последовательностей.
Источники информации
Проведён поиск в базах данных PubMed и Google Scholar в период до 7 апреля 2021 г.
Поиск
В базе данных PubMed применяли два типа поисковых запросов с использованием терминов библиотеки MeSH и ключевых слов для поиска среди недавних статей, поскольку в PubMed требуется около одного месяца для присвоения термина MeSH опубликованной работе:
«Magnetic Resonance imaging» [Mesh] or «MRI» and «Computed tomography» or «CT» and «Lung neoplasms» [Mesh] or «Solitary Pulmonary Nodule» [Mesh] and «Sensitivity» and «Specificity»;
«Lung MRI» or «chest MRI» and «Computed tomography» or «CT» and «lung cancer» or «Solitary Pulmonary Nodule».
Для поиска в базе данных Google Scholar использовали запрос «MRI, CT, lung cancer, specificity, sensitivity».
Процесс сбора данных и элементы данных
С помощью сервиса Google Spreadsheet разработали таблицу извлечения данных. Авторы имели одновременный и неограниченный доступ к документу. Два исследователя (О.Ю. Панина и Е.А. Грик) извлекли следующие данные из отобранных работ: название статьи, журнал (или сервис для размещения препринтов), дата публикации, DOI, протокол МРТ, значение магнитной индукции МРТ, типы выявленных очагов, чувствительность, специфичность, стандартное отклонение для МРТ и КТ. В случаях когда показатели чувствительности и специфичности были рассчитаны для каждой импульсной последовательности (ИП) отдельно, в метаанализ включались наиболее эффективные показатели.
Три других исследователя (Е.С. Ахмад, Ю.Н. Васильева и Ю.А. Васильев) осуществили проверку извлечённых данных. Все разногласия были решены в ходе обсуждения между авторами.
Риск систематической ошибки в отдельных исследованиях
Авторы использовали контрольный список QUADAS-2 (Quality Assessment of Diagnostic Accuracy Studies) [5], рекомендованный для проведения систематических обзоров Агентством исследований и оценки качества здравоохранения США (Agency for Healthcare Research and Quality, Cochrane Collaboration, AHRQ). Каждую из отобранных работ оценивали по четырём доменам: отбор пациентов, исследуемый тест, эталонный тест и поток пациентов. Полное описание каждого направления и используемые критерии суждения приведены в Кокрановском руководстве по систематическим обзорам медицинских вмешательств (Cochrane Handbook) [6].
Статистический анализ
Выбор метода анализа и группировки данных о чувствительности и специфичности (модель случайных эффектов или модель фиксированного эффекта) выполняли по результатам оценки гетерогенности исследований. Для оценки статистической гетерогенности исследований, включённых в метаанализ, применяли критерий χ2 и индекс гетерогенности I2. Статистически значимая гетерогенность в исследованиях соответствует p <0,10 в критерии χ2 и I>40%. Метаанализ проводили при помощи программного пакета RevMan 5.4.1.
РЕЗУЛЬТАТЫ
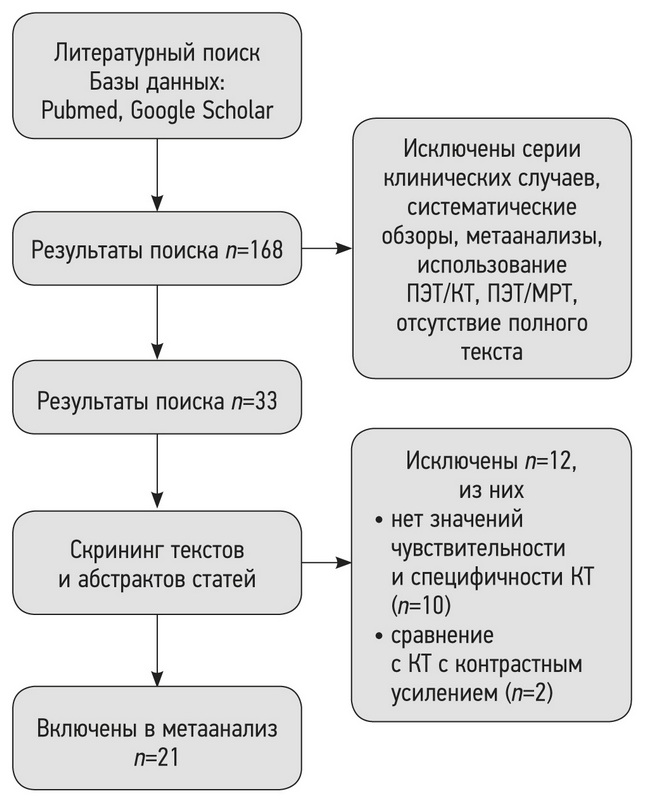
По результатам поиска в базах данных PubMed и Google Scholar 168 отобранных работ были импортированы в библиотеку программы для управления ссылками Mendeley. После дополнительной проверки на критерии включения и исключения и изучения текста исследований осталось 33 работы (рис. 1).

Рис. 1. Схема процесса отбора исследований (flow diagram).
В ходе изучения текстов оставшихся 33 работ [7–38] обнаружено, что в двух исследованиях проводилось КТ с контрастным усилением [23, 24], что также не является соответствующим типом вмешательств. Кроме того, в 10 работах [20–22, 25–29, 31, 32] полностью отсутствовали значения чувствительности и специфичности для КТ, поэтому было принято решение об исключении данных исследований. В метаанализ были включены статьи, где контрольным исследованием выступала низкодозовая КТ [9, 10, 16], не являющаяся критерием исключения. Таким образом, непосредственно в метаанализ было включено 21 исследование (см. рис. 1).
Отобранные работы включали 1188 пациентов. Все исследования содержали сведения о процедуре проведения МРТ и КТ лёгких. Данные о чувствительности для МРТ и КТ были представлены во всех работах, однако в трёх статьях показатели специфичности не были указаны [8, 16, 30]. Большинство исследований выполнены на томографах с индукцией магнитного поля 1,5 Т (табл. 1).
Таблица 1. Характеристики МР-исследований, включённых в метаанализ
№ | Исследования | Год | Индукция магнитного поля, Тл | Модель, производитель МРТ | ИП МРТ |
1 | Both [7] | 2005 | 1,5 | Magnetom Vision, Siemens | VIBE, HASTE, T2TSE |
2 | Bruegel [8] | 2007 | 1,5 | Magnetom Sonata, Siemens | STIR |
3 | Chang [19] | 2015 | 1,5 | Intera Achieva, Philips | SS-TSE-HF |
4 | Cieszanowski [30] | 2016 | 1,5 | Magnetom Avanto, Siemens | T2TSE, T2-STIR, T2-HASTE |
5 | Dewes [33] | 2016 | 3,0 | Magnetom Prisma, Siemens | CAIPIRINHA-VIBE |
6 | Fatihoğlu [34] | 2019 | 1,5 | Magnetom Aera, Siemens | DWI (ADC) |
7 | Heye [35] | 2012 | 1,5 | Avanto, Siemens | VIBE, HASTE |
8 | Huang [39] | 2020 | 1,5 | Magnetom Aera, Siemens | UTE free-breathing |
9 | Koo [36] | 2019 | 3,0 | Magnetom Skyra, Siemens | T2FSE |
10 | Koyama [37] | 2008 | 1,5 | Intera, Philips | STIR |
11 | Koyama [38] | 2015 | 1,5 | Achieva, Philips | DWI (ADC) |
12 | Meier-Schroers [9] | 2016 | 1,5 | Ingenia, Philips | T2FSE |
13 | Meier-Schroers [10] | 2019 | 1,5 | Ingenia, Philips | T2STIR |
14 | Ohno [11] | 2017 | 3,0 | Vantage Titan, Canon Medical Systme | UTE |
15 | Regier [12] | 2011 | 1,5 | Achieva, Philips | DWI (ADC) |
16 | Satoh [13] | 2008 | 1,5 | Intera NovoDual, Philips | DWI (ADC) |
17 | Schaefer [14] | 2006 | 1,0 | Magnetom Expert, Siemens | PDWI |
18 | Schroeder [15] | 2005 | 1,5 | Magnetom Sonata, Siemens | HASTE |
19 | Sommer [16] | 2014 | 1,5 | Magnetom Avanto, Siemens | HASTE |
20 | Vogt [17] | 2004 | 1,5 | Magnetom Sonata, Siemens | HASTE |
21 | Yi [18] | 2007 | 3,0 | Achieva, Philips | T1WI 3D TFE* |
Примечание. ИП МРТ ― импульсные последовательности магнитно-резонансной томографии.
Риск систематической ошибки
В 11 исследованиях были надлежащим образом предоставлены сведения по исследуемому и эталонному тестам [7, 8, 10–13, 15–18, 33]. Основным источником ошибок являлся индексный тест (МРТ) и его интерпретация (рис. 2). В некоторых исследованиях не было полноценных данных для возможности судить о риске предвзятости: например, были ли интерпретированы результаты индексного теста без знания результатов эталонного теста, и наоборот, интерпретация эталонного теста без знания результатов индексного. Имеется также риск систематической ошибки в случае, если исследования, в которых выявлен эффект, были опубликованы с большей вероятностью, чем исследования, в которых эффект отсутствует. Однако во всех исследованиях участники соответствовали критериям протокола настоящего обзора.
По результатам метаанализа выявлены наличие статистически значимой гетерогенности p <0,00001 по критерию χ2 и индекс гетерогенности I2=99% для чувствительности и специфичности. В связи с этим для анализа данных использовали метод случайных эффектов.
Диагностическая точность МРТ органов грудной клетки
В каждой из 21 работ было проведено сравнение МРТ с эталонным методом. Значения чувствительности для МРТ находились в диапазоне от 70,4 до 100%, специфичности ― от 60,6 до 100% (рис. 3). Среднее значение чувствительности МРТ составило 88,3%, специфичности ― 71,3. В работах, где не указывались параметры стандартного отклонения SD для чувствительности и специфичности, расчёт производился путём оценки значений показателей [40].
Таблица 2. Характеристики исследований с наиболее высокими показателями чувствительности и специфичности
№ | Автор, год исследования | Чувствительность (общий показатель) | Специфичность (общий показатель) | ИП МРТ | Индукция магнитного поля, Тл |
1 | Both, 2005 [7] | 100 | 100 | VIBE, HASTE, T2TSE | 1,5 |
2 | Cieszanowski, 2016 [30] | 100 | - | T2TSE, T2-STIR, T2-HASTE | 1,5 |
3 | Meier-Schroers, 2016 [9] | 100 | 100 | T2FSE | 1,5 |
4 | Regier, 2011 [12] | 97 | 92,3 | DWI (ADC) | 1,5 |
5 | Heye, 2012 [35] | 100 | 100 | VIBE, HASTE | 1,5 |
6 | Schaefer, 2006 [14] | 100 | 75 | PDWI | 1,5 |
Примечание. ИП МРТ ― импульсные последовательности магнитно-резонансной томографии.
В табл. 2 представлены характеристики включённых в метаанализ исследований с наиболее высокими значениями чувствительности и специфичности для метода МРТ, сопоставимыми с КТ. На рис. 3 данные исследования отмечены как имеющие минимальную разницу чувствительности и специфичности для МРТ и КТ.

Рис. 2. Гистограмма риска систематической ошибки.
ОБСУЖДЕНИЕ
Результаты данного метаанализа демонстрируют меньшие средние значения специфичности и чувствительности для метода МРТ по сравнению с КТ. В большинстве исследований, включённых в метаанализ, чувствительность и специфичность КТ органов грудной клетки для выявления лёгочных узлов составила 100%. Только три работы имели более низкие показатели. Это объясняется тем, что во включённых исследованиях КТ выступало в роли эталонного теста. Для МРТ органов грудной клетки 5 исследований из 21 имели 100% чувствительность, а всего 2 исследования ― 100% чувствительность и специфичность.

Рис. 3. Форест-график сгруппированных данных для специфичности (а) и чувствительности (b) [40].
Примечание. SMD (standardized mean difference) ― стандартизированная средняя разница; CI (confidence interval) ― доверительный интервал.
При анализе результатов метаанализа выявлено, что высокие показатели чувствительности наблюдались в исследованиях, в которых рассчитывались общие показатели чувствительности и специфичности для всего МР-протокола, а не отдельно для каждой ИП (см. табл. 2). Данное явление показывает особенность проведения метаанализа для МРТ как для метода, где оценка сигнальных характеристик производится в совокупности с протоколом сканирования. Данные примеры могут свидетельствовать о недостаточной изученности возможностей МРТ в дифференциальной диагностике лёгочных узлов, необходимости исследования современных ИП, а также тщательной настройке рутинных ИП на томографе. Такой подход поможет повысить эффективность МРТ для выявления лёгочных узлов и исследования их характеристик, что особенно важно в диагностике рака лёгких.
Рак лёгких продолжает занимать лидирующую позицию по смертности во всём мире, в том числе в Российской Федерации, являясь острой социально-экономической проблемой [41, 42]. Наличие рака в выявленных лёгочных узлах колеблется от 10 до 70% [2]. В некоторых странах в рамках скрининга проводится низкодозовая КТ группам высокого риска. Но в настоящее время охват населения программой скрининга остаётся низким, а критерии включения пациентов ограничены, чтобы обеспечить её экономическую целесообразность. Таким образом, многим пациентам по-прежнему будет ставиться диагноз после появления симптомов, т.е. не на ранней стадии развития заболевания и в условиях высокой цены ошибки при неправильной диагностике [41]. Мониторинг и управление неоднозначными лёгочными узлами до сих пор остаётся сложной задачей как для рентгенологов, так и для клиницистов, поэтому для постановки диагноза, маршрутизации пациента и выбора оптимальной тактики ведения и лечения всегда используется только комплексный подход [43].
Данный метаанализ показал возможности альтернативного подхода в оценке лёгочных узлов, подозрительных в отношении рака. В нашем исследовании акцент был сделан на стандартные исследования без использования контрастного усиления.
Ограничения исследования
Данное исследование имело ряд ограничений. В метаанализ по ряду причин были включены те данные, где размеры очагов были больше 6 мм. Во-первых, размеры узлов более 6 мм наиболее часто встречаются в исследованиях; во-вторых, по последним данным Флешнеровского сообщества, узлы менее 6 мм имеют достаточно низкий риск злокачественности [3]. Кроме того, в метаанализе не проводилось сравнение методов МРТ с гистологическими данными, что также может являться ограничением исследования.
ЗАКЛЮЧЕНИЕ
МРТ обладает достаточной чувствительностью и специфичностью для дополнительной диагностики лёгочных узлов, подозрительных в отношении злокачественности, обнаруженных при КТ. Среднее значение чувствительности МРТ составило 88,3%, специфичности ― 71,3%.
МРТ является неионизирующим методом лучевой диагностики и, кроме того, при оценке различных ИП может выступать дополнительным методом в решении спорных случаев.
Необходимо дальнейшее изучение наиболее эффективных импульсных последовательностей, целесообразности контрастного усиления и новых технологических решений для качественной диагностики лёгочных узлов.
ДОПОЛНИТЕЛЬНО
Источник финансирования. Авторы заявляют об отсутствии внешнего финансирования при проведении поисково-аналитической работы и подготовке статьи.
Конфликт интересов. Авторы декларируют отсутствие явных и потенциальных конфликтов интересов, связанных с публикацией настоящей статьи.
Вклад авторов. Ю.А. Васильев — разработка концепции, написание текста, анализ и экспертная оценка результатов; О.Ю. Панина — разработка концепции, поиск публикаций по теме, обработка полученных результатов, написание текста обзора; Е.А. Грик — поиск публикаций по теме, обработка полученных результатов; Е.С. Ахмад — обработка результатов, систематизация и финальное редактирование обзора; Ю.Н. Васильева — анализ и экспертная оценка результатов, финальное редактирование обзора. Все авторы подтверждают соответствие своего авторства международным критериям ICMJE (все авторы внесли существенный вклад в разработку концепции, подготовку статьи, прочли и одобрили финальную версию перед публикацией).
Funding source. The study had no sponsorship.
Competing interests. The authors declare that they have no competing interests.
Authors’ contribution. Yuriy A. Vasilev — research concept, writing the manuscript, analysis and expert assessment of research results; Оlga Yu. Panina — research concept, search for publications, processing of the results, writing the manuscript; Evgeniia A. Grik — search for publications, processing of the results, Kate A. Akhmad — processing of the results, systematization and final editing of the review; Yulia N. Vasileva — analysis and expert assessment of research results, systematization and final editing of the review. All authors made a substantial contribution to the conception of the work, acquisition, analysis, interpretation of data for the work, drafting and revising the work, final approval of the version to be published and agree to be accountable for all aspects of the work.
Об авторах
Юрий Александрович Васильев
Научно-практический клинический центр диагностики и телемедицинских технологий; Городская клиническая онкологическая больница № 1
Email: dr.vasilev@me.com
ORCID iD: 0000-0002-0208-5218
SPIN-код: 4458-5608
кандидат медицинских наук
Россия, 127051, Москва, ул. Петровка, д. 24, стр. 1; МоскваОльга Юрьевна Панина
Научно-практический клинический центр диагностики и телемедицинских технологий; Городская клиническая онкологическая больница № 1; Московский государственный медико-стоматологический университет имени А.И. Евдокимова
Email: o.panina@npcmr.ru
ORCID iD: 0000-0002-8684-775X
SPIN-код: 5504-8136
Scopus Author ID: 57219837311
мл. научный сотрудник
Россия, 127051, Москва, ул. Петровка, д. 24, стр. 1; Москва; 127473, Москва, ул. Делегатская, д. 20, стр. 1Евгения Андреевна Грик
Московский государственный медико-стоматологический университет имени А.И. Евдокимова
Email: evgeniyagrik@gmail.com
ORCID iD: 0000-0002-7908-3982
SPIN-код: 5558-7307
MD
Россия, 127473, Москва, ул. Делегатская, д. 20, стр. 1Екатерина Сергеевна Ахмад
Научно-практический клинический центр диагностики и телемедицинских технологий
Email: e.ahmad@npcmr.ru
ORCID iD: 0000-0002-8235-9361
SPIN-код: 5891-4384
Россия, 127051, Москва, ул. Петровка, д.24, стр.1
Юлия Николаевна Васильева
Московский государственный медико-стоматологический университет имени А.И. Евдокимова
Автор, ответственный за переписку.
Email: drugya@yandex.ru
ORCID iD: 0000-0003-4955-2749
SPIN-код: 9777-2067
кандидат медицинских наук
Россия, 127473, Москва, ул. Делегатская, д. 20, стр. 1Список литературы
- Ost D., Fein A.M., Feinsilver S.H. Clinical practice. The solitary pulmonary nodule//N Engl J Med. 2003. Vol. 348, N 25. Р. 2535–2542. doi: 10.1056/NEJMcp012290
- Nasim F., Ost D.E. Management of the solitary pulmonary nodule//Curr Opin Pulm Med. 2019. Vol. 25, N 4. Р. 344–353. doi: 10.1097/MCP.0000000000000586
- MacMahon H., Naidich D.P., Goo J.M., et al. Guidelines for management of incidental pulmonary nodules detected on CT images: From the Fleischner Society 2017//Radiology. 2017. Vol. 284, N 1. Р. 228–243. doi: 10.1148/radiol.2017161659
- Liberati A., Altman D.G., Tetzlaff J., et al. The PRISMA statement for reporting systematic reviews and meta-analyses of studies that evaluate health care interventions: Explanation and elaboration//PLoS Med. 2009. Vol. 6, N 7. Р. e1000100. doi: 10.1371/journal.pmed.1000100
- Whiting P.F., Rutjes A.W., Westwood M.E., et al. Quadas-2: A revised tool for the quality assessment of diagnostic accuracy studies//Ann Intern Med. 2011. Vol. 155, N 8. Р. 529–536. doi: 10.7326/0003-4819-155-8-201110180-00009
- Higgins J.P., Thomas J., Chandler J., et al. Cochrane handbook for systematic reviews of interventions. John Wiley & Sons, Hoboken; 2019. doi: 10.1002/9781119536604
- Both M., Schultze J., Reuter M., et al. Fast T1- and T2-weighted pulmonary MR-imaging in patients with bronchial carcinoma//Eur J Radiol. 2005. Vol. 53, N 3. P. 478–488. doi: 10.1016/j.ejrad.2004.05.007
- Bruegel M., Gaa J., Woertler K., et al. MRI of the lung: Value of different turbo spin-echo, single-shot turbo spin-echo, and 3D gradient-echo pulse sequences for the detection of pulmonary metastases//J Magn Reson Imaging. 2007. Vol. 25, N 1. P. 73–81. doi: 10.1002/jmri.20824
- Meier-Schroers M., Kukuk G., Homsi R., et al. MRI of the lung using the PROPELLER technique: Artifact reduction, better image quality and improved nodule detection//Eur J Radiol. 2016. Vol. 85, N 4. P. 707–713. doi: 10.1016/j.ejrad.2015.12.016
- Meier-Schroers M., Homsi R., Schild H.H., Thomas D. Lung cancer screening with MRI: characterization of nodules with different non-enhanced MRI sequences//Acta Radiol. 2019. Vol. 60, N 2. P. 168–176. doi: 10.1177/0284185118778870
- Ohno Y., Koyama H., Yoshikawa T., et al. Standard-, reduced-, and nodose thin-section radiologic examinations: Comparison of capability for nodule detection and nodule type assessment in patients suspected of having pulmonary nodules//Radiology. 2017. Vol. 284, N 2. P. 562–573. doi: 10.1148/radiol.2017161037
- Regier M., Schwarz D., Henes F.O., et al. Diffusion-weighted MR-imaging for the detection of pulmonary nodules at 1.5 Tesla: Intraindividual comparison with multidetector computed tomography//J Med Imaging Radiat Oncol. 2011. Vol. 55, N 3. P. 266–274. doi: 10.1111/j.1754-9485.2011.02263.x
- Satoh S., Kitazume Y., Ohdama S., et al. Can malignant and benign pulmonary nodules be differentiated with diffusion-weighted MRI?//Am J Roentgenol. 2008. Vol. 191, N 2. P. 464–470. doi: 10.2214/AJR.07.3133
- Schaefer J.F., Schneider V., Vollmar J., et al. Solitary pulmonary nodules: Association between signal characteristics in dynamic contrast enhanced MRI and tumor angiogenesis//Lung Cancer. 2006. Vol. 53, N 1. P. 39–49. doi: 10.1016/j.lungcan.2006.03.010
- Schroeder T., Ruehm S.G., Debatin J.F., et al. Detection of pulmonary nodules using a 2D HASTE MR sequence: comparison with MDCT//Am J Roentgenol. 2005. Vol. 185, N 4. P. 979–984. doi: 10.2214/AJR.04.0814
- Sommer G., Tremper J., Koenigkam-Santos M., et al. Lung nodule detection in a high-risk population: Comparison of magnetic resonance imaging and low-dose computed tomography//Eur J Radiol. 2014. Vol. 83, N 3. P. 600–605. doi: 10.1016/j.ejrad.2013.11.012
- Vogt F.M., Herborn C.U., Hunold P., et al. HASTE MRI versus chest radiography in the detection of pulmonary nodules: comparison with MDCT//Am J Roentgenol. 2004. Vol. 183, N 1. P. 71–78. doi: 10.2214/ajr.183.1.1830071
- Yi C.A., Jeon T.Y., Lee K.S., et al. 3-T MRI: usefulness for evaluating primary lung cancer and small nodules in lobes not containing primary tumors//Am J Roentgenol. 2007. Vol. 189, N 2. P. 386–392. doi: 10.2214/AJR.07.2082
- Chang S., Hong S.R., Kim Y.J., et al. Usefulness of thin-section single-shot turbo spin echo with half-fourier acquisition in evaluation of local invasion of lung cancer//J Magn Reson Imaging. 2015. Vol. 41, N 3. P. 747–754. doi: 10.1002/jmri.24587
- Schaefer J.F., Vollmar J., Schick F., et al. Solitary pulmonary nodules: Dynamic contrast-enhanced MR imaging — Perfusion differences in malignant and benign lesions//Radiology. 2004. Vol. 232, N 2. P. 544–553. doi: 10.1148/radiol.2322030515
- Kono R., Fujimoto K., Terasaki H., et al. Dynamic MRI of solitary pulmonary nodules: comparison of enhancement patterns of malignant and benign small peripheral lung lesions//Am J Roentgenol. 2007. Vol. 188, N 1. P. 26–36. doi: 10.2214/AJR.05.1446
- Feng H., Shi G., Liu H., et al. Free-breathing radial volumetric interpolated breath-hold examination sequence and dynamic contrast-enhanced MRI combined with diffusion-weighted imaging for assessment of solitary pulmonary nodules//Magn Reson Imaging. 2021. Vol. 75. P. 100–106. doi: 10.1016/j.mri.2020.10.009
- Kim J.H., Kim H.J., Lee K.H., et al. Solitary pulmonary nodules: A comparative study evaluated with contrast-enhanced dynamic MR imaging and CT//J Comput Assist Tomogr. 2004. Vol. 28, N 6. P. 766–775. doi: 10.1097/00004728-200411000-00007
- Ohno Y., Nishio M., Koyama H., et al. Solitary pulmonary nodules: Comparison of dynamic first-pass contrast-enhanced perfusion area-detector CT, dynamic first-pass contrast-enhanced MR imaging, and FDG PET/CT//Radiology. 2015. Vol. 274, N 2. P. 563–575. doi: 10.1148/radiol.14132289
- Heye T., Sommer G., Miedinger D., et al. Ultrafast 3D balanced steady-state free precession MRI of the lung: Assessment of anatomic details in comparison to low-dose CT//J Magn Reson Imaging. 2015. Vol. 42, N 3. P. 602–609. doi: 10.1002/jmri.24836
- Akata S., Kajiwara N., Park J., et al. Evaluation of chest wall invasion by lung cancer using respiratory dynamic MRI//J Med Imaging Radiat Oncol. 2008. Vol. 52, N 1. P. 36–39. doi: 10.1111/j.1440-1673.2007.01908.x
- Hittmair K., Eckersberger F., Klepetko W., et al. Evaluation of solitary pulmonary nodules with dynamic contrast-enhanced MR imaging-a promising technique?//Magn Reson Imaging. 1995. Vol. 13, N 7. P. 923–933. doi: 10.1016/0730-725x(95)02010-q
- Alper F., Kurt A.T., Aydin Y., et al. The role of dynamic magnetic resonance imaging in the evaluation of pulmonary nodules and masses//Med Princ Pract. 2013. Vol. 22, N 1. P. 80–86. doi: 10.1159/000339475
- Frericks B.B., Meyer B.C., Martus P., et al. MRI of the thorax during whole-body MRI: Evaluation of different MR sequences and comparison to thoracic multidetector computed tomography (MDCT)//J Magn Reson Imaging. 2008. Vol. 27, N 3. P. 538–545. doi: 10.1002/jmri.21218
- Cieszanowski A., Lisowska A., Dabrowska M., et al. MR imaging of pulmonary nodules: Detection rate and accuracy of size estimation in comparison to computed tomography//PLoS One. 2016. Vol. 11, N 6. P. e0156272. doi: 10.1371/journal.pone.0156272
- Ohno Y., Hatabu H., Takenaka D., et al. Solitary pulmonary nodules: Potential role of dynamic MR imaging in management — Initial experience//Radiology. 2002. Vol. 224, N 2. P. 503–511. doi: 10.1148/radiol.2242010992
- Zou Y., Zhang M., Wang Q., et al. Quantitative investigation of solitary pulmonary nodules: dynamic contrast-enhanced MRI and histopathologic analysis//Am J Roentgenol. 2008. Vol. 191, N 1. P. 252–259. doi: 10.2214/AJR.07.2284
- Dewes P., Frellesen C., Al-Butmeh F., et al. Comparative evaluation of non-contrast CAIPIRINHA-VIBE 3T-MRI and multidetector CT for detection of pulmonary nodules: In vivo evaluation of diagnostic accuracy and image quality//Eur J Radiol. 2016. Vol. 85, N 1. P. 193–198. doi: 10.1016/j.ejrad.2015.11.020
- Fatihoğlu E., Biri S., Aydın S., et al. MRI in evaluation of solitary pulmonary nodules//Turkish Thorac J. 2019. Vol. 20, N 2. P. 90–96. doi: 10.5152/TurkThoracJ.2018.18049
- Heye T., Ley S., Heussel C.P., et al. Detection and size of pulmonary lesions: How accurate is MRI? A prospective comparison of CT and MRI//Acta Radiol. 2012. Vol. 53, N 2. P. 153–160. doi: 10.1258/ar.2011.110445
- Koo C.W., Lu A., Takahashi E.A., et al. Can MRI contribute to pulmonary nodule analysis?//J Magn Reson Imaging. 2019. Vol. 49, N 7. P. e256–e264. doi: 10.1002/jmri.26587
- Koyama H., Ohno Y., Kono A., et al. Quantitative and qualitative assessment of non-contrast-enhanced pulmonary MR imaging for management of pulmonary nodules in 161 subjects//Eur Radiol. 2008. Vol. 18, N 10. P. 2120–2131. doi: 10.1007/s00330-008-1001-2
- Koyama H., Ohno Y., Seki S., et al. Value of diffusion-weighted MR imaging using various parameters for assessment and characterization of solitary pulmonary nodules//Eur J Radiol. 2015. Vol. 84, N 3. P. 509–515. doi: 10.1016/j.ejrad.2014.11.024
- Huang Y.S., Niisato E., Su M.Y., et al. Detecting small pulmonary nodules with spiral ultrashort echo time sequences in 1.5 T MRI//MAGMA. 2021. Vol. 34, N 3. P. 399–409. doi: 10.1007/s10334-020-00885-x
- Ying G.S., Maguire M.G., Glynn R.J., et al. Calculating sensitivity, specificity, and predictive values for correlated eye data//Investig Ophthalmol Vis Sci. 2020. Vol. 61, N 11. P. 29. doi: 10.1167/iovs.61.11.29
- Bradley S.H., Kennedy M.P., Neal R.D. Recognising lung cancer in primary care//Adv Ther. 2019. Vol. 36, N 1. P. 19–30. doi: 10.1007/s12325-018-0843-5
- Nikolаev E., Gombolevskiy V, Gonchar AP, et al. Incidental findings during lung cancer screening by low-dose computed tomography//Tuberc Lung Dis. 2018. Vol. 96, N 11. P. 60–67. doi: 10.21292/2075-1230-2018-96-11-60-67
- Loverdos K., Fotiadis A., Kontogianni C., et al. Lung nodules: A comprehensive review on current approach and management//Ann Thorac Med. 2019. Vol. 14, N 4. P. 226–238. doi: 10.4103/atm.ATM_110_19
Дополнительные файлы

