

")


评价当前COVID-19不同严重程度的光动脉直径 (根据肺的非敏感性计算机断层扫描)
- 作者: Aliev A.F.1,2, Kudryavtsev N.D.1,3, Petraikin A.V.3, Artyukova Z.R.3, Shkoda A.S.4, Morozov S.P.3
-
隶属关系:
- L.A. Vorokhobov Municipal Clinical Hospital No 67 of the Moscow Health Department
- The Moscow Research and Clinical Center for Tuberculosis Control of the Moscow Health Department
- Moscow Center for Diagnostics and Telemedicine
- Vorokhobov City Clinical Hospital No. 67
- 期: 卷 2, 编号 3 (2021)
- 页面: 249-260
- 栏目: 原创性科研成果
- ##submission.dateSubmitted##: 26.07.2021
- ##submission.dateAccepted##: 07.09.2021
- ##submission.datePublished##: 15.10.2021
- URL: https://jdigitaldiagnostics.com/DD/article/view/76726
- DOI: https://doi.org/10.17816/DD76726
- ID: 76726

如何引用文章

详细
论证。计算机断层扫描是评估病毒性肺炎(包括COVID-19相关肺炎)肺部损伤的一种选择方法。除了评估肺损伤外,计算机断层扫描还可以确定胸腔主要血管的大小。分析了COVID-19流动的严重程度与肺动脉和上主动脉直径变化的存在之间的关系。肺动脉扩张是肺高压的标志. 研究这些模式可能对确定治疗策略和预测COVID-19疾病的趋势具有临床意义。
目标是估计不同年龄患者的光动脉直径和COVID-19流量的严重程度
材料与方法患者组中进行单核单级固体不受控制的研究 (n=511,267男性,中美洲59岁,IQR 49.0-65.0,范围从31至84岁),在临时医院治疗COVID-19患者。 随着住院治疗,所有患者都通过了使用IISRO Truct Mobile System(Stryker,美国)的胸部器官的计算机断层研究。 CT 1-4规模上估计了轻微组织的病变程度。 通过垂直于容器的长轴的放射科医生的工作站的标准工具来进行光动脉直径和上升主动脉的测量。
结果。获得以下统计学显着的模式:光动脉的膨胀和光动脉/升序姿势的升高与COVID-19肺部病变程度的增加有关(克拉克尔-沃利斯准则,p <0.001;中值测试,p <0.001); 升高主动脉的直径随着患者的年龄而显着增加(克拉克尔-沃利斯准则,p <0.001;中值测试,p <0.001)。 显示了光动脉直径和患者年龄的直径之间的不准确的关系(克拉克尔-沃利斯准则,p=0.094;嗜源性测试,p=0.311)和腹腔直径的变化和肺部的病变程度之间的不准确的联系(克拉克尔-沃利斯准则,p=0,061;中值测试,p=0.165)。 所有年龄段的疾病方面和大量的肺病灶(KT-3和KT-4)中,可靠地增加了患有轻质高血压症状的患者(从29毫米和更多的光动脉膨胀)是显示。
结论。光动脉的扩张和光动脉/升序的直径比率的增加与在所有年龄组中COVID-19的肺病变的体积增加是可靠的
全文:
论证
COVID-19大流行的背景下,肺部计算机断层扫描(CT)已成为诊断和评估冠状病毒感染过程严重程度的主要方法之一[1-3]。
根据新冠病毒感染预防、诊断和治疗的联邦临床指南[2],确定了COVID-19病程的四个严重程度。该划分基于许多临床和实验室参数包括根据 CT 分类 1-4 [1, 3] 的肺组织病变体积。 病情轻微的患者中,未检测到肺损伤(CT-0); 对于中等严重程度的疾病,肺损伤程度高达25%(CT-1)和50-75%(CT-2); 对于病情严重的病程,肺损伤程度更高 - 50-75% (CT-3),对于极其严重的病程 - 超过 70% (CT-4)。 根据CT分类的肺炎严重程度也具有预后价值。因此,根据 CT 等级上受影响肺实质的体积,包括从轻度和中度到重度和极重度(从 CT 1-2 到 CT 3- 4),致死结果的风险增加[4]。
分析 COVID-19 相关肺炎的放射学特征特征时,相当重视肺实质、胸膜、支气管树的评估,以及在较小程度上评估大血管的变化 [5, 6]。 需要强调的是COVID-19 相关肺炎最具特征性和持续性的体征是节段性肺动脉 (PA) [7] 的扩张,以及发生肺血栓栓塞和急性呼吸窘迫综合征的高风险,并伴有气体交换恶化、低氧血症和多器官衰竭的发展 [4, 7, 8]。
与康复患者相比,具有致命结果的患者显着增加肺动脉直径(PA)和肺动脉直径(PA)的比例和升主动脉 (Ao)[9]。
因此,为了使用 CT 评估冠状病毒感染的过程、治疗的有效性和预后,人们不仅可以考虑肺部病变的体积,还可以考虑肺血管的状态 - 两个节段性肺动脉,[10– 12]和肺干(肺动脉主干)[9]。 肺循环动脉血管床内的压力升高表明血液难以通过肺部,从而降低患者的代偿能力并导致心力衰竭的发生。
这项研究的目的是确定不同年龄患者的冠状病毒感染过程COVID-19的严重程度与纵隔大血管直径(PA和Ao)之间的关系。
研究方法
研究设计
基于胸部器官CT扫描结果进行了一项单中心、单阶段、连续、非对照研究(图1)。

图 1研究设计。 CT - 计算机断层扫描; CT 1-4 - 用于视觉评估患者全身状况严重程度对 COVID-19 肺部变化的放射学迹象的性质和严重程度的依赖性的改编量表; PA-肺动脉。
遵从准则
纳入标准:冠状病毒感染COVID-19诊断,聚合酶链反应确诊; CT图像上存在病毒性肺炎的迹象; 对医疗干预的自愿知情同意的可用性。 如果胸部器官的CT扫描是在另一家医疗机构的院前阶段进行的,则在住院日或住院日后4天内,首次在储备医院进行胸部器官的CT扫描[3]。
排除标准:既往慢性肺部疾病史、胸部器官手术干预以及CT图像上明显的伪影,这些伪影妨碍对肺损伤体积和大血管直径的测量进行充分评估。
排除标准:由于住院次数有限,CT图像(CT-0)上无病毒性肺炎证据的患者。
执行条件
2020 年 10 月 8 日至 2020 年 12 月 5 日期间在 Krylatskoye 冰宫的临时储备医院接受治疗的一组患者参与了该研究(GBUZ «GKB67号 L.A. Vorokhobov DZM»)
医疗干预说明
医院指定的手术时间内,对胸部器官进行了2998次非对比CT检查,以诊断或监测新冠肺炎患者。
CT检查在一台移动式计算机断层扫描仪Airo-TruCT(美国斯特莱克)上进行,该扫描仪安装在一家后备医院,用于治疗新冠病毒-19患者(图2)。所使用的移动断层扫描仪具有105厘米的扩展孔径和32排探测器。该CT系统旨在用于神经外科手术室,但其紧凑性、对电源的低要求(能够连接到 1.5 千瓦电网的能力)使其可以在临时医院中有效使用该设备。 断层扫描仪的电源单元允许以高达 30千伏的功率进行短期扫描。考虑到保证全天候运行的需要,选择了以下扫描参数:X射线管上的电压120 千伏; 电流 38 毫安; 切片厚度 1 毫米; 512×512矩阵; 音高 1.415; 旋转时间 1.92 秒,平均扫描长度 30 厘米(12 秒); 有效剂量为 3.9 毫希沃特。 最大流量可达每小时 6 名患者。

图 2 Airo TruCT 移动计算机断层扫描仪安装在临时急诊医院的入院科,用于治疗在 Krylatskoye 冰宫组织的 COVID-19 患者。
由此产生的匿名 CT 图像由分别具有3年和9年经验的两名放射线技师独立评估。 为了查看 CT 图像并进行测量,我们在Agfa Enterprise Imaging平台(Agfa HealthCare,比利时)上使用了莫斯科市统一医疗信息和分析系统(ERIS EMIAS)的统一放射信息服务软件。 为了评估对肺的损伤程度并测量大血管,使用带有观察窗肺和软组织参数的 1 毫米轴向 CT 切片:窗口宽度和水平 - 1500 HU、-500 HU和350 HU,分别为 50 HU。
大量患者流动的情况下,根据胸部图像的冠状和矢状投影的轴向和重建,基于对压实肺组织体积的视觉评估,使用经验视觉量表来评估肺损伤的体积。 没有使用计算机辅助方法来评估受影响的实质体积。
根据已批准的方法学推荐 [1, 2] 和国内作者提出的描述病理变化的方案,结合 CT 1-4 分类对肺病灶体积进行评估,同时考虑到肺实质病变的体积。 肺组织的变化(磨砂玻璃、网状压实、实变、“鹅卵石路面”症状、“空气支气管造影”、反向“晕”)通过评估病变体积和肺叶变化的定位来确定和肺的部分。
PA 大小是在最宽点的轴向截面上测量的,垂直于血管的长轴(图 3,a,c,e,g)。 右肺动脉的最大直径处测量升主动脉的大小 [13]。 测量精度的限制是缺乏对比度增强、心脏同步和降低信噪比。 测量结果由两名放射技师进行的独立测量取平均值。如果评估实质损伤程度或测量大血管(超过2毫米)的结果存在显著差异,则考虑具有15年经验的第三位放射科医生的意见。
本研究的主要结果
评估纵隔大血管(PA,Ao)的各种测量参数及其衍生值与肺实质病变体积和年龄依赖性之间的相关性。
补充研究结果
评估上升Ао直径与患者年龄之间的关系,这可以证实先前确定的规律性。
亚组分析
研究过程中,根据肺部病变的体积(CT扫描1-4)和三个年龄范围(50岁以下、51至69岁、70岁以上)将男女患者分为4组。岁)。
伦理审查
该研究是根据世界医学协会制定的赫尔辛基宣言进行的。
俄罗斯放射科医师和放射科医师学会莫斯科地区分会独立伦理委员会于 2021 年 2 月 18 日第 2/2021 号批准了该研究
所有患者都签署了医疗干预(CT 扫描)和将其医疗数据用于科学目的的自愿知情同意书。
统计分析
使用 StatSoft Statistica 12 软件进行统计数据处理。所需的样本量使用 Altman 列线图(功效为 0.8,显着性水平为 0.05)确定。对500多名患者的检查使我们能够获得最小的足够样本量,以获得具有统计学意义的结果。使用 Kolmogorov-Smirnov 检验和 Lilliefors 和 Shapiro-Wilk 校正检查正态性定量数据的分布。 考虑到多个研究组中PA和Ao指数与正态分布的差异,以及不同的患者分组数,使用非参数 Kruskal-Wallis (KU) 检验评估差异的显着性,非参数模拟ANOVA和中值检验。 为了进一步评估纵隔大血管大小的许多研究参数之间的关系,使用非参数斯皮尔曼等级相关系数 (ρ)。 分析组间差异时使用2×2表, 非参数菲舍尔F检验。 所有测试中的显着性水平 (p) 对应于 <0.05。
结果
研究对象(参与者)
对 511 名患者的 CT 研究进行了分析,平均年龄 57±12岁,中位年龄59岁; IQR 49.0-65.0岁;最小- 31岁,最大- 84岁; 男性-52.2%,女性-47.8%。 按性别、肺损伤程度和年龄间隔划分的患者分布在表1提出。
表 1 按性别(M - 男性)、年龄和 CT 等级 1-4 肺炎严重程度划分的患者组分布
指标 | CT-1 | CT-2 | CT-3 | CT-4 | 总数, n |
I组 50岁一下 | 47 (34 М) | 56 (38 М) | 19 (14 М) | 9 (9 М) | 131 (95 М) |
II组 (50–69 岁) | 84 (36 М) | 127 (56 М) | 78 (39 М) | 24 (19 М) | 313 (150 М) |
第III组 (70 岁及以上) | 24 (8 М) | 18 (4 М) | 16 (4 М) | 9 (6 М) | 67 (22 М) |
总数, n | 155 (78 М) | 201 (98 М) | 113 (57 М) | 42 (34 М) | 511 (267 М) |
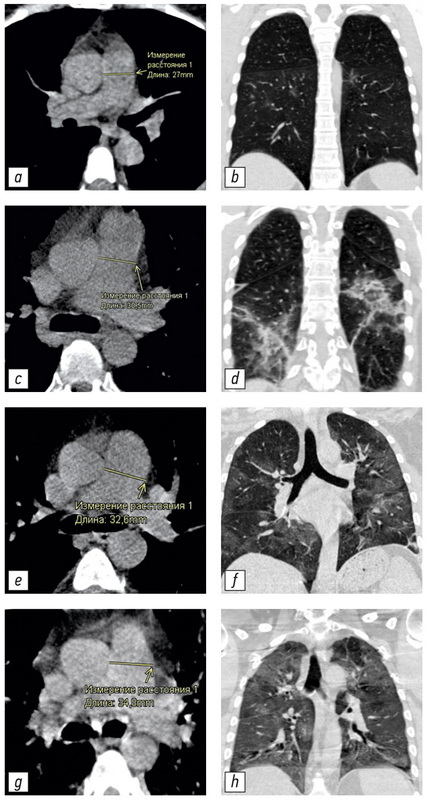
不同体积肺实质病变患者的CT图像及相应的肺动脉测量值在图3提出。

图 3 具有不同 PA 直径和肺部受累程度的 CT 图像示例:a、b - 未扩张的 PA(27.0 毫米),CT-1 肺部受累程度(小于 25%); c, d - 肺损伤程度 CT-2 (25-50%) 增大的 PA (30.5 毫米); e, f - 扩张的 PA (32.6毫米),肺损伤程度为 KT-3 (50–75%); g, h - 肺损伤程度 CT-4(大于 75%)的扩张 PA(34.8毫米)。 CT - 计算机断层扫描; CT 1-4 - 用于视觉评估患者全身状况严重程度对 COVID-19 肺部变化的放射学迹象的性质和严重程度的依赖性的改编量表; PA-肺动脉。
主要研究成果
获得了以下可靠模式:肺损伤程度导致 PA 直径增加(K-U p <0.001;中值检验,p <0.001); Ao 直径随着患者年龄的增加而增加(K-U p <0.001;MT p <0.001); PA / Ao 比率的增加取决于肺损伤的严重程度(K-U p <0.001;MT p = 0.008)和该指标随着年龄的增长而降低(K-U p <0.001;MT p <0.001)。 肺干直径的小幅增加与年龄的相关性 (KU p = 0.094; MT p = 0.311) 是不可靠的,以及主动脉直径的轻微增加与肺损伤程度 (KU p = 0.061;MT p = 0.165)。

图 4。肺动脉直径对 COVID-19 肺损伤年龄和严重程度的依赖性。 CT 1-4 - 用于视觉评估患者全身状况严重程度对 COVID-19 肺部变化的放射学迹象的性质和严重程度的依赖性的改编量表; PA-肺动脉
根据图 4 中显示的结果,确定了以下 斯皮尔曼等级相关系数(在PA 直径和病变严重程度之间):对于整个样本 - ρ = 0.268; p <0.005; 50 岁以下 - ρ = 0.245; p <0.005; 50 至 70 岁 - ρ = 0.229; p <0.005; 70 岁及以上 - ρ = 0.374; p <0.005,即 注意到一种微弱的正相关关系。 分析时通过片面F-F菲舍尔检验的差异,重症肺炎患者(CT 3-4)在表2显示肺动脉显着扩张(超过 29 毫米)。
表 2 按年龄间隔、肺炎严重程度和肺动脉扩张检查患者的分布
年龄间隔 ,年 | 指标 | |||
CT 严重程度 | PA < 29 毫米 | PA ≥ 29 毫米 | PA ≥ 29 毫米, % | |
到50* | CT 3–4 | 10 | 18 | 64,3 |
CT 1–2 | 80 | 23 | 22,3 | |
50–69** | CT 3–4 | 47 | 51 | 52,0 |
CT 1–2 | 145 | 62 | 29,9 | |
70 岁及以上*** | CT 3–4 | 10 | 19 | 65,5 |
CT 1–2 | 30 | 16 | 34,8 | |
注意:差异是显着的:* p <0.0001; ** p = 0.0001,*** p = 0.0089(F 检验)。CT - 计算机断层扫描; CT 1-4 - 用于视觉评估患者全身状况严重程度对 COVID-19 肺部变化的放射学迹象的性质和严重程度的依赖性的改编量表; PA - 肺动脉。
其他研究成果
作为研究期间获得的其他结果,可以注意到以下观察结果:在年龄较大(>70岁)的患者组中,观察到的新冠病毒-19(CT 3-4)的严重病程更频繁(37%)。年龄组(<50岁)中,严重病程的发生率较低(21%)。中年组(50~69岁)中,重症病例数居中(32%)。
还需要注意的是,CT-1到CT-4的肺动脉直径增加了12.9%(计算为数值差值与一半之和的比值),而标准值的比值对 PA 平均值的偏差为 13.5%。 对于比值PA / Ao,相对增加为 8.3%,标准差与平均值的比值为 11.9%。 根据这些估计,PA直径的增加比PA/Ao比率更明显地与CT程度的增加相关,变异系数的差异较小。因此,与RA/Ao相比,更可取的方法是根据该指标单独评估RA的变化。
不良事件
胸部非对比计算机断层扫描患者中未观察到不良事件。这些研究是根据诊断胸部器官疾病的标准非对比方案进行的。
使用Airo-TruCT移动式计算机断层扫描没有相关的不良事件。辐射照射量未超过固定式计算机断层摄影的典型值。
讨论
主要研究成果总结
研究过程中,研究了肺动脉和主动脉直径之间的关系以及它们之间的关系,研究对象为不同年龄组的不同程度的新冠肺炎患者。COVID-19中肺干直径与肺实质损伤体积之间存在可靠的正相关关系。随着年龄的增长,肺干的直径无明显增加。老年组主动脉显著增大,与疾病严重程度的增加无关。
主要研究成果的讨论
图示肺动脉干直径随年龄均匀但不可靠的增大(图4)。最长50年的年龄间隔值;50-69岁;70岁以上为27.0±3.6岁;27.6 ± 3.8; 分别为28.2±4.1 毫米(平均值±标准偏差)。然而,在新冠病毒-19相关病毒性肺炎中,肺动脉直径的显著增加与肺实质损伤的严重程度有关(图4)。对于CT 1-4级,确定了以下平均PA值:26.7±3.4; 26.9±3.4; 28.8±4.1; 分别为 30.4 ± 4.4 毫米。 主动脉直径显示了相反的模式。 随着年龄的增长,主动脉直径有显着变化(增加)—31.2±3.7; 34.6±3.9; 34.8 ± 5.6 毫米适用于上述定义的年龄范围。 随着肺损伤严重程度的增加,主动脉直径无显着变化(增加)(CT 1-4):33.3 ± 4.9; 33.7±4.2; 34.2±3.9; 34.6 ± 4.3 毫米。 导出的参数 - PA / Ao 的比率 - 显示出随着年龄的显着变化(减少)(0.87 ± 0.11; 0.80±0.12; 0.82 ± 0.15 相对。 单位 分别),因为 Ao 的直径随着年龄的增长而显着增加,肺动脉的直径略有增加。 PA/Ao指数的变化(增加)与肺组织损伤程度(CT 1-4)的增加也具有显著性:0.81±0.13;0.81 ± 0.11; 0.85 ± 0.14; 相对单位分别为0.88±0.12。
CT-1组最小病变体积(26.7±3.4;0.81±0.13)的PA直径和PA/Ao比率的平均值略高于Framingham心脏病研究[14]中确定的标准值,其中平均PA大小为-25.1±2.8毫米,平均PA/Ao比值为-0.77±0.09。也许这是由于方法上的特殊性:我们的测量是在没有心脏同步的情况下进行的,这可能导致测量的血管直径增加,并且研究组按性别进行不成比例的划分。50岁以下患者组的平均测量主动脉直径(31.2±3.7 毫米)与专门用于主动脉年龄测量的综述[15]中的结果(31.1±4 毫米)具有很好的可比性,在该综述中,由于血管壁弹性降低,主动脉直径也随年龄增加而增加。
严重冠状病毒感染(CT 3-4)(图2、b、d、f、h)组的所有年龄段肺动脉直径增大超过29 毫米的患者比例均有统计学显著增加(表2)。平均而言,这组患者为60.6%是轻度新冠病毒-19(CT 1-2)组PA增大大于29毫米患者平均数量的两倍。
我们获得的数据与之前获得的结果非常一致[9],其中可靠地显示,与疾病前相比,新冠肺炎相关肺炎患者的肺动脉扩张,PA/Ao比率也显著增加,数据指标与肺炎病程严重程度之间的关系轻微,报错笔记拼音 双语对照
PA直径的阈值是不同的,超过该阈值可以可靠地判断肺动脉高压的形成。例如,患者出现呼吸困难的PA直径上限男性为29毫米,女性为27毫米,临界PA/Ao比率为0.9[13, 16]。另一项研究中,提出了29毫米的PA值和PA/Ao比率作为诊断肺动脉高压的标准,尽管这些值显示出较高的敏感性,但特异性不足[14]。另一个提议的阈值为31.5毫米,高于该阈值记录肺动脉高压,也显示出低特异性[14]。肺动脉高压诊断和治疗指南中注意到阈值水平为29毫米[17]。
因此,选择的29毫米阈值是合理的,但当获得额外数据以评估肺动脉内的压力时,例如在超声测量期间,可以对其进行调整[18]。我们关于严重病程患者组中PA直径大于2毫米的患者数量的统计显著性数据(表2)表明肺动脉高压的形成可能对更严重的病程有贡献。
我们研究的PA/Ao指数没有超过0.9和1的阈值[9]在CT-4肺病灶组中达到最大值0.88±0.12。 该指标的显着增加对应于 P. Spagnolo和合著者的工作中获得的结果[9]。 强调 PA 扩大的临床意义,作者提供了与恢复患者相比,具有致命结果的患者PA直径和PA/Ao直径比增加的可靠数据。 该出版物中注意到肺损伤程度(也除以严重程度 1-4)与PA直径的增加之间存在微弱的正相关。 与肺炎发生前的状态相比,受检患者的 PA 直径显着扩大,但样本量很小(45 名患者)。 具有小病灶体积(高达 50%)的队列中,PA 扩张患者的数量明显较少,但数量相当多,这证实了需要根据 PA / Ao 比值的定义来纠正 PA 扩张;表. 2. 建议应用此标准来排除受宪法约束的宽PA。 但是,如果患者年龄超过 50 岁且患有高血压,则此辅助比较标准无效,因为主动脉也会因壁的结缔组织框架受损而扩张 [15]。
测量肺动脉作为肺动脉高压的预后标志和严重程度的附加标志的有效性得到了主要的双侧肺组织损伤过程的证实 [9]。 肺动脉在小圆圈中积累越来越多的血流动力学窘迫,这是 COVID-19 相关病毒性肺炎病程严重程度的额外预测指标。 PA 的扩张被认为与实质病变的体积有可靠的关系,可能是由于肺动脉高压的增加。
众所周知,肺部自身免疫性疾病表现为间质性肺炎的迹象,例如,在因大量间质性肺病变导致特发性肺纤维化进展的背景下,会出现肺动脉高压[19]。 肺血管的正常结构由于肺间质的大量炎症而变形。 毛细血管变窄和内皮完整性破坏会导致小血管的微血栓形成和硬化,从而导致液压阻力增加,从而形成肺动脉高压 [20]。 COVID-19 相关病毒性肺炎的发展是由于肺中 II 型肺泡细胞中血管紧张素转换酶 2 (ACE2) 的高水平表达,这是 SARS-CoV-2 病毒突刺的目标抗原,这是间质性肺损伤发展的原因 [11, 12]。 由于血管内皮细胞中 ACE2 受体的表达,导致微血栓形成的破坏因素可能是对血管内皮细胞的直接损害 [15, 20, 21], 以及可能对血管床造成继发性免疫损伤和水肿和渗出的发展。 这是由于补体成分在肺泡壁中大量积累而促进的,这会导致肺毛细血管内皮细胞的损伤和随后的凝血激活 [20]。 肺血管床中 ACE2 受体系统的耗竭可导致内皮功能障碍和炎症,并加剧动脉粥样硬化和糖尿病性血管病的进程 [15, 20],在 COVID-19 中会导致延迟性阴性反应动脉粥样硬化血管病变进展的形式。
已经报道了 VES(vascular enlargement sign)现象,这是 COVID-19 肺炎中血管扩张的征兆,但这种现象尚未得到深入研究,现有的几项研究报告了其患病率不一致的情况。 值得注意的是,76.9% 的有病毒性肺炎迹象的患者会出现这种症状 [7, 10]。
肺动脉高压的存在,无论是什么原因引起的,对病毒性肺炎的病程都有继发性的负面影响,尤其是在肺大面积病变的情况下。
肺干的扩张表现在肺实质损害的严重程度,使我们可以认为肺动脉高压的形成是COVID-19相关肺炎严重程度的重要标志之一。既定的规律性将允许采用更具差异性的方法来预测这种传染病的结果,开发有效的治疗方法,并确定需要临床医生更多关注的严重疾病过程的人群风险群体。
研究的局限性
这项研究没有回答肺动脉高压,即肺动脉扩张,是一种初始状态,还是在冠状病毒感染过程中发展的问题。这项工作的框架内没有对没有病毒性肺炎迹象的不同年龄患者的PA直径进行测量,以评估肺动脉高压(肺动脉扩张)的人群发病率。肺动脉高压和 PA 扩张的人口流行率数据见 [20]。
结论
工作过程中,在所有年龄组的COVID-19相关性肺炎中,肺动脉扩张与肺损伤严重程度之间显示出统计学上显着的正相关关系; 肺动脉扩张超过29毫米(肺动脉高压的迹象)和肺实质严重病变(CT 3-4)的患者数量在统计学上显着增加。 获得的模式需要进一步研究,这将允许采用更加差异化的方法来预测这种传染病的结果,开发有效的治疗方法并确定需要临床医生更多关注的重症患者的风险组。
附加信息
资金来源。作者声称这项研究没有资金支持。
利益冲突。作者声明没有明显的和潜在的利益冲突相关的发表这篇文章。
作者贡献。A.F. Aliyev—研究思路和设计,数据收集、处理和分析; N.D. Kudryavtsev - 研究设计、数据收集、处理和分析; А.V. Petryaikin - 研究设计、数据处理和分析; Z.R. Artyukova - 数据处理; A.S. Shkoda, S.P. Morozov - 研究设计,数据分析。 所有作者都确认其作者符合国际ICMJE标准(所有作者为文章的概念,研究和准备工作做出了重大贡献,并在发表前阅读并批准了最终版本)。
谢意的表示。我们向物理和数学科学博士 F.K. Aliyevu 和教育科学候选人 T.I. Aliyeva 在统计数据处理、患者群体的主要关注点和研究设计建议方面的帮助。
作者简介
Alexander F. Aliev
L.A. Vorokhobov Municipal Clinical Hospital No 67 of the Moscow Health Department; The Moscow Research and Clinical Center for Tuberculosis Control of the Moscow Health Department
Email: alijealex83@gmail.com
ORCID iD: 0000-0003-3282-0567
SPIN 代码: 7891-9314
MD, Cand. Sci. (Med.)
俄罗斯联邦, 2/44, Salyama Adilya street, 123423 Moscow; 10 c1, Stromynka Street, 107014 MoscowNikita D. Kudryavtsev
L.A. Vorokhobov Municipal Clinical Hospital No 67 of the Moscow Health Department; Moscow Center for Diagnostics and Telemedicine
Email: n.kudryavtsev@npcmr.ru
ORCID iD: 0000-0003-4203-0630
SPIN 代码: 1125-8637
diagnostic radiologist, junior researcher
俄罗斯联邦, 2/44, Salyama Adilya street, 123423 Moscow; 24 с1, Petrovka street, 127051 MoscowAlexey V. Petraikin
Moscow Center for Diagnostics and Telemedicine
Email: alexeypetraikin@gmail.com
ORCID iD: 0000-0003-1694-4682
SPIN 代码: 6193-1656
MD, Cand. Sci. (Med.), Associate Professor, leading researcher, diagnostic radiologist
俄罗斯联邦, 24 с1, Petrovka street, 127051 MoscowZlata R. Artyukova
Moscow Center for Diagnostics and Telemedicine
Email: z.artyukova@npcmr.ru
ORCID iD: 0000-0003-2960-9787
SPIN 代码: 7550-2441
MD, junior researcher, radiologist
俄罗斯联邦, 24 с1, Petrovka street, 127051 MoscowAndrey S. Shkoda
Vorokhobov City Clinical Hospital No. 67
Email: gkb67@zdrav.mos.ru
ORCID iD: 0000-0002-9783-1796
MD, Dr. Sci. (Med.), Professor, doctor of the highest qualification category in the specialty, chief physician
俄罗斯联邦, 2/44, Salama Adil street, 123423 MoscowSergey P. Morozov
Moscow Center for Diagnostics and Telemedicine
编辑信件的主要联系方式.
Email: morozov@npcmr.ru
ORCID iD: 0000-0001-6545-6170
SPIN 代码: 8542-1720
MD, Dr. Sci. (Med.), Professor
俄罗斯联邦, 24 с1, Petrovka street, 127051 Moscow参考
- Morozov SP, Protsenko DN, Smetanina SV, et al. Radiation diagnostics of coronavirus disease (COVID-19): organization, methodology, interpretation of results: preprint No. CDT-2020-II. Version 2 from 17.04.2020. The series "Best practices of radiation and instrumental diagnostics". Issue 65. Moscow: Scientific and Practical Clinical Center for Diagnostics and Telemedicine Technologies of the Department of Healthcare of the City of Moscow; 2020. 78 p. (In Russ).
- Prevention, diagnosis and treatment of a new coronavirus infection (COVID-19): Temporary methodological recommendations. Version 10 (08.02.2020). 2020. 261 p. (In Russ).
- Fomin VV, Ternovoy SK, Serova NS. Radiological guidelines in patients with COVID-19 (Sechenov University experience). REJR. 2020;10(2):8–13. (In Russ). doi: 21569/2222-7415-2020-10-2-8-13
- Henkel M, Weikert T, Marston K, et al. Lethal COVID-19: radiological-pathological correlation of the lungs. Radiol Cardiothorac Imaging. 2020;2(6):e200406. doi: 10.1148/ryct.2020200406
- Sun Z, Zhang N, Li Y, et al. A systematic review of chest imaging findings in COVID-19. Quant Imaging Med Surg. 2020;10(5): 1058–1079. doi: 10.21037/qims-20-564
- Salehi S, Abedi A, Balakrishnan S, et al. Coronavirus disease 2019 (COVID-19): A systematic review of imaging findings in 919 patients. AJR Am J Roentgenol. 2020;215(1):87–93. doi: 10.2214/AJR.20.23034
- Qanadli SD, Beigelman-Aubry C, Rotzinger DC. Vascular changes detected with thoracic CT in coronavirus disease (COVID-19) might be significant determinants for accurate diagnosis and optimal patient management. AJR Am J Roentgenol. 2020;215(1):15. doi: 10.2214/AJR.20.23185
- Li X, Ma X. Acute respiratory failure in COVID-19: Is it "typical" ARDS? Crit Care. 2020;24(1):198. doi: 10.1186/s13054-020-02911-9
- Spagnolo P, Cozzi A, Foà RA, et al. CT-derived pulmonary vascular metrics and clinical outcome in COVID-19 patients. Quant Imaging Med Surg. 2020;10(6):1325–1333. doi: 10.21037/qims-20-546
- Lv H, Chen T, Pan Y, et al. Pulmonary vascular enlargement on thoracic CT for diagnosis and differential diagnosis of COVID-19: a systematic review and meta-analysis. Ann Transl Med. 2020; 8(14):878–878. doi: 10.21037/atm-20-4955
- Chang YC, Yu CJ, Chang SC, et al. Pulmonary sequelae in convalescent patients after severe acute respiratory syndrome: Evaluation with thin-section CT. Radiology. 2005;236(3):1067–1075. doi: 10.1148/radiol.2363040958
- Prokop M, van Everdingen W, van Rees Vellinga T, et al. CO-RADS: A categorical CT assessment scheme for patients suspected of having COVID-19-definition and evaluation. Radiology. 2020;296(2):E97–E104. doi: 10.1148/radiol.2020201473
- Corson N, Armato SG, Labby ZE, et al. CT-based pulmonary artery measurements for the assessment of pulmonary hypertension. Acad Radiol. 2014;21(4):523–530. doi: 10.1016/j.acra.2013.12.015
- Truong QA, Massaro JM, Rogers IS, et al. Reference values for normal pulmonary artery dimensions by noncontrast cardiac computed tomography the framingham heart study. Circ Cardiovasc Imaging. 2012;5(1):147–154. doi: 10.1161/CIRCIMAGING.111.968610
- Collins JA, Munoz JV, Patel TR, et al. The anatomy of the aging aorta. Clin Anat. 2014;27(3):463–466. doi: 10.1002/ca.22384
- Compton GL, Florence J, MacDonald C, et al. Main pulmonary artery-to-ascending aorta diameter ratio in healthy children on MDCT. AJR Am J Roentgenol. 2015;205(6):1322–1325. doi: 10.2214/AJR.15.14301
- Galiè N, Humbert M, Vachiery JL, et al. 2015 ESC/ERS guidelines for the diagnosis and treatment of pulmonary hypertension: the joint task force for the diagnosis and treatment of pulmonary hypertension of the European society of cardiology (ESC) and the European Respiratory Society (ERS): Endorsed by: Association for European Paediatric and Congenital Cardiology (AEPC), International Society for Heart and Lung Transplantation (ISHLT). European Heart Journal. 2016;37(1):67–119. doi: 10.1093/eurheartj/ehv317
- Parasuraman S, Walker S, Loudon BL, et al. Assessment of pulmonary artery pressure by echocardiography — A comprehensive review. Int J Cardiol Heart Vasc. 2016;12:45–51. doi: 10.1016/j.ijcha.2016.05.011
- Chuchalin AG, Avdeev SN, Aysanov ZR, et al. Diagnosis and treatment of idiopathic pulmonary fibrosis federal clinical guidelines. Pulmonology. 2016;26(4):399–419. (In Russ). doi: 10.18093/0869-0189-2016-26-4-399-419
- Chernyaev AL, Samsonova MV. Pathological anatomy of the lungs. Atlas. 2nd ed., revised and updated. A series of monographs of the Russian Respiratory Society. Ed. by A.G. Chuchalin. Moscow: Atmosfera; 2011. 111 p. (In Russ).
- Dolhnikoff M, Duarte-Neto AN, de Almeida Monteiro RA, et al. Pathological evidence of pulmonary thrombotic phenomena in severe COVID-19. J Thromb Haemost. 2020;18(6):1517–1519. doi: 10.1111/jth.14844
补充文件

