

")


Bone mineral density radiopaque templates for cone beam computed tomography and multidetector computed tomography
- Authors: Hossain S.D.1, Petraikin A.V.2, Muraev A.A.1, Danaev A.B.3, Burenchev D.V.2, Dolgalev A.A.3, Vasilev Y.A.2, Sharova D.E.2, Ivanov S.Y.1,4
-
Affiliations:
- Peoples Friendship University of Russia
- Research and Practical Clinical Center for Diagnostics and Telemedicine Technologies
- Stavropol State Medical University
- The First Sechenov Moscow State Medical University (Sechenov University)
- Issue: Vol 4, No 3 (2023)
- Pages: 292-305
- Section: Original Study Articles
- Submitted: 21.06.2023
- Accepted: 22.08.2023
- Published: 26.09.2023
- URL: https://jdigitaldiagnostics.com/DD/article/view/501771
- DOI: https://doi.org/10.17816/DD501771
- ID: 501771

Cite item

Abstract
BACKGROUND: Cone beam computed tomography is widely applied for diagnostics and planning various manipulations in the maxillofacial region, for example, dental implantation. Its advantages include high spatial resolution, low radiation exposure, and cost-effectiveness. However, it has a significant drawback: the inability to determine the density of the jaw bone in Hounsfield Units (HU).
AIMS: This study aimed to develop radiopaque templates with sets of X-ray density based on potassium hydrophosphate and beta-tricalcium phosphate, to study templates on various cone beam computed tomography and multidetector computed tomography devices, and to determine a cross-calibration algorithm for assessing the bone mineral density of the jaw in HU.
MATERIALS AND METHODS: The bone mineral density template comprised microtubes (0.25 ml) with potassium hydrophosphate concentrations of 49.96, 99.98, 174.99, 349.99, and 549.98 mg/ml, and a suspension of beta-tricalcium phosphate with an equivalent concentration of potassium hydrophosphate 1,506 mg/ml, designed to simulate the types of bone density according to C. Mish. The study was carried out on two multidetector computed tomography and four cone beam computed tomography machines. Cross-calibration was referred on the “standard” multidetector computed tomography 1 mode 120 kV, 200 mA.
RESULTS: There was a significant scatter of the X-ray values (HU for multidetector computed tomography and GV for cone beam computed tomography) vs. bone mineral density, with varying slopes, bias, and curve shapes. After cross-calibration, good comparability corresponding to the multidetector computed tomography 1 mode was shown. The median of the differences before cross-calibration was 160 relative units (HU, GV), after decreased by 10 times and amounted to 16 rel. units (p=0.000). The mean difference for cone beam computed tomography was significantly higher (30 rel. units) than for multidetector computed tomography (8 rel. units) (p=0.024, Mann–Whitney U test).
CONCLUSION: The developed radiopaque template enables the standardization of densitometric indicators for cone beam computed tomography and various multidetector computed tomography modes. On average, the spread after cross-calibration is reduced by 10 times, which makes it possible to classify bone tissue in HU according to C. Mish.
Full Text
BACKGROUND
The discovery of computed tomography (CT) in 1972 enabled the visualization of various areas of the human body using three-dimensional (3D) images [1]. Computed tomography is used in many therapeutic areas, and with the development of dental implantation, it has been the most often used modality in dentistry [2]. One of the key standards for determining radiological densitometric parameters of bone tissue is the Hounsfield unit (HU), a relative quantitative measurement of radio density [3]. Misch [4] uses this scale as a basis for a dental bone density classification.
Because of the high ionizing radiation dose and high financial costs associated with multidetector computed tomography (MDCT), a safer and less expensive cone beam computed tomography (CBCT) was developed. However, this technology has some limitations, the most significant of which is the presence of specific artifacts and poor accuracy in determining the radiographic density [5–7]. Radiographic density in CBCT is defined as a relative mean gray value (GV) compared with Hounsfield units (HUs), which are stable radiographic density units used in MDCT. This makes it impossible to adequately identify individual anatomical and density characteristics of the patient’s bone structures, which are necessary for planning dental implantation. These limitations are determined by tissue X-ray absorption patterns, scanning parameters, and the CBCT reconstruction algorithm [8]. As a result, a universal calibration method is required to reduce CBCT errors, improve bone density measurement accuracy, and lower the risk of intraoperative and postoperative complications.
Radiopaque templates should be developed to complete this task. It is possible to use potassium hydrogen phosphate, which has X-ray absorption properties similar to calcium hydroxyapatite, the main mineral complex of normal bone. Previously, the use of potassium hydrogen phosphate to simulate phantom bone mineral density (BMD) was justified [9]. This approach enables the simulation of a wide range of BMD values in bone samples using a scan process as close as possible, using identical examination modes and simulating X-ray absorption by the patient’s tissues. This approach is used in quantitative CT [9].
Our experimental study aims to evaluate the effectiveness of BMD radiopaque templates and cross-calibration algorithms for a more accurate assessment of densitometric parameters of six computer tomographs (four CBCTs [CBCT 1, CBCT 2, CBCT 3, and CBCT 4] and two MDCTs [MDCT 1 and MDCT 2]), with abbreviations followed by serial numbers of test scanners).
The study aims to develop a set of radiopaque templates with a given radiographic density using potassium hydrogen phosphate and β-tricalcium phosphate and evaluate the results of scanning templates using various CBCTs and MDCTs to develop a cross-calibration algorithm for assessing mineral density of the jawbone using the Misch classification.
MATERIALS AND METHODS
General characteristics of a mineral density template
A specific mass concentration of potassium hydrogen phosphate was used for manufacturing the model BMD sample. Due to its high solubility, the exact concentration range to simulate the spongy substance and the low-density cortical layer (50–550 mg/mL) can be determined. The high-density cortical layer was modeled using a suspension of water-insoluble β-tricalcium phosphate, equivalent to bone hydroxyapatite. Concentrations were adjusted to obtain substances from all bone density classes (D1–D5) according to the Misch classification (Table 1) [4].
Table 1. Characteristics of the created bone mineral density template compared with Carl E. Misch’s classification
Tube number in the template (0.25 mL) | Values obtained in the study | Misch scale | |||
Specified BMD concentration (mg/mL) | Actual BMD concentration | Measured HU for MDCT 1 (line 5, Table 2) | Bone type | HU | |
1 | 0 | 0 | 1.5 | — | — |
2 | 50 | 49.96 | 78 | D5 | <150 |
3 | 100 | 99.98 | 161 | D4 | 150–350 |
4 | 175 | 174.99 | 281 | D4 | 150–350 |
5 | 350 | 349.99 | 540 | D3 | 350–850 |
6 | 550 | 549.98 | 816a | D2 | 850–1,250 |
7 | 1,500 | 1,506 | 2,165 | D1 | >1,250 |
Note. BMD, bone mineral density; MDCT, tested multidetector computed tomography scanner 1.
aSample below the appropriate Misch density range.
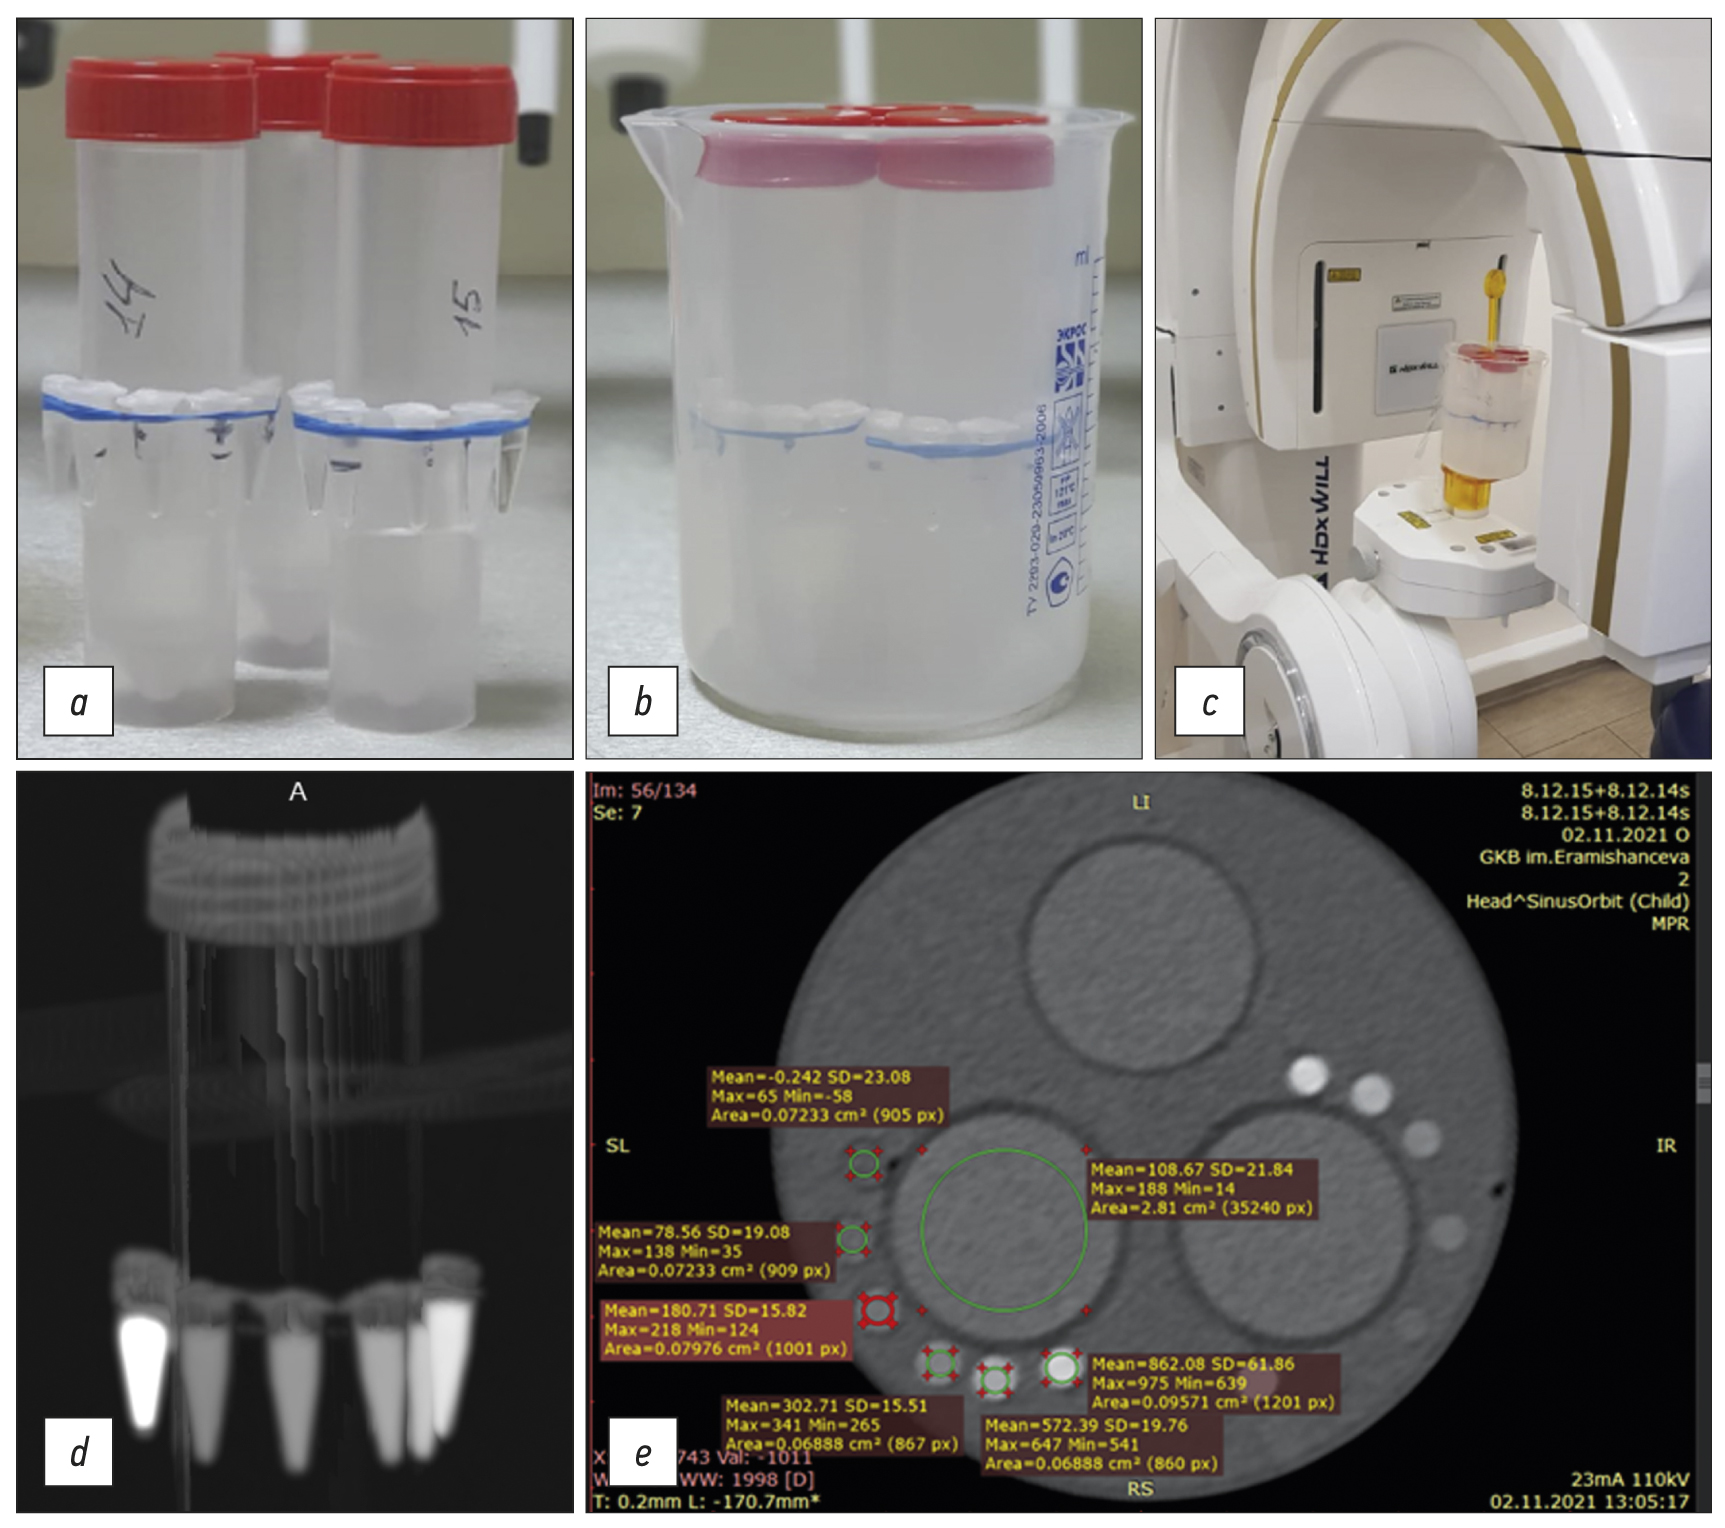
The calibration template consisted of two sets of 0.25-mL plastic tubes positioned around 50-mL tubes (Figure 1). Calibration tubes included (a) distilled water, (b–f) 50–550-mg/mL potassium hydrogen phosphate solutions, (g) 846-mg/mL β-tricalcium phosphate solution with a potassium hydrogen phosphate equivalent content of 1,500 mg/mL (see Table 1). Three 50-mL tubes with fixed templates were filled with 65.97- and 58.64-mg/mL potassium hydrogen phosphate solutions and water. These tubes were not used for calibration (see Figure 1).

Fig. 1. General sequence of the study steps: (a) original tubes with a radiopaque substance (radiopaque mineral density templates) in air; (b) original tubes with radiopaque substance in water; (c) example of fixing and examining templates using a cone-beam computed tomography scanner; (d) MIP reconstruction using multidetector computed tomography scanner; (e) example of viewing and processing original tube sections in DICOM format (Radiant) and evaluating their characteristics using the tested multidetector computed tomography scanner 3 (see Table 2, line 7).
A crystalline hydrate of potassium hydrogen phosphate with a content of the primary substance K2HPO4 × 3H2O >99% according to GOST 2493-75 (Pan Reac Applichem ITV Reagents) was used to prepare a solution of this substance. β-tricalcium phosphate was also used, with a Ca3 × (PO4)2 content of >98% (Sigma-Aldrich). OHAUS Pioneer analytical balances with accuracy class according to GOST OIML R 76-1-2011 I (special) were used for weighing. Potassium hydrogen phosphate samples were dissolved in degassed distilled water in a volumetric flask (49.89 mL; relative error for volume 0.06%).
Characteristics of the study
The templates were scanned using standard clinical maxillofacial imaging modes. Scanner characteristics and examination modes are summarized in Table 2. Results were analyzed for four CBCTs from three manufacturers (see Table 2, lines 1–4), two MDCTs from two manufacturers (see Table 2, lines 5–7), and two modes for one MDCT (line 5: normal [120 kV, 200 mA] and low dose [80 kV, 10 mA]). Two sets of BMD templates with identical potassium hydrogen phosphate dilutions (one with an added high-density sample of β-tricalcium phosphate) were fixed around 25-mm tubes (see Figure 1a and 1d), which were then placed in an 85-mm cylinder filled with distilled water (see Figure 1b and 1e), which was established in a scanner (see Figure 1c). The water environment is necessary to simulate the effect of beam hardening [10], making phantom study conditions closer to clinical settings.
Table 2. Scanner types and scanning modes evaluated in the study
No. | Scanner (company and country of origin); abbreviation used | Tube voltage (kV) | Tube current (mA) |
1 | Orthopantomograph OP 3D (Kavo, USA); CBCT 1 | 95 | 4 |
2 | HDX WILL (HDX Will Corp., Korea); CBCT 2 | 85 | 8 |
3 | Orthopantomograph OP300 (Kavo, USA); CBCT 3 | 90 | 3, 2 |
4 | Vatech PaX-Uni3D (Vatech Global, South Korea); CBCT 4 | 90 | 5 |
5 | GE Discovery NM/CT 670 (GE Healthcare, USA); MDCT 1a | 120 | 200 |
6 | GE Discovery LOW/CT 670 (GE Healthcare, USA); MDCT 2 | 80 | 10 |
7 | Siemens Somatom Perspective (Siemens, USA); MDCT 3 | 110 | 23 |
Note. MDCT 1, tested multidetector computed tomography scanner 1.
aMDCT 1 (line 5) is used as the standard for cross-calibration in further study steps.
Results
The results of a CT study of “in water” and “in air” patterns are expected to be compared to assess the influence of absorbing properties of the liquid medium, the oral cavity. Images were obtained in DICOM format (see Figures 1e and 2).
Statistical analysis
Mean values and standard deviations were calculated for BMD samples in templates. Radiographic density values were averaged for BMD samples of corresponding templates. The obtained data were processed in Excel and Statistica 10, and HU (for MDCT), GV (for CBCT), and BMD parameters were compared. Linear and quadratic lines of approximation were used. The MDCT mode of 120 kV and 200 mA was used as the internal standard for cross-calibration (see Table 1, column 4; Table 2, line 5). Considering the small sample size and heterogeneous conditions, nonparametric statistics (Mann–Whitney U test) were used to compare groups.
RESULTS
Radiographic density measurements of BMD templates are presented in HUs for MDCT and GVs for CBCT in Figures 1 and 2. There is a significant scatter for measured values, although for individual scanners, the measured radiographic density of water (negative GV values are reported for CBCT 2 and CBCT 4). Figure 2 compares the phantom obtained for MDCT using the same “window” visualization parameters for bone tissue (window level 100/window width). MDCT 3 (a) and CBCT 2 (b) have different contrasts. The measured values of the radiographic density of water are −0.85 HUs for MDCT and −360 GVs for CBCT.

Fig. 2. Radiopaque phantom with bone mineral density templates using the same visualization parameters of the “window” (window level 100/window width 1,500 for bone tissue) for (a) tested multidetector computed tomography scanner 3 and (b) cone-beam computed tomography scanner 2: different contrast intensity is visible, measured values of water density: 0,85 HU for multidetector scanner and 360 GV for cone beam scanner.
Slopes and shapes of radiographic density to BMD curves differ significantly (Figure 3).

Fig. 3. Dependence of measured radiographic densities (HU for MDCT and GV for CBCT) on preset bone mineral densities before cross-calibration: there is a significant scatter of HU values when using different modes and MDCT scanners and GV values when using other CBCT scanners. CBCT, cone beam computed tomography scanner; MDCT, multidetector computed tomography scanner.
Cross-calibration was proposed to unify the measurements performed, which is to determine formulas for recalculating each specific measurement for different scanners using a universal internal standard, that is, MDCT 1 (120 kV, 200 mA; see Table 2, line 5). For this purpose, dependences were initially constructed in reverse coordinates (Figure 4).

Fig. 4. Inverse dependencies compared with Figure 2: Mineral density versus radiographic density in GV and HU. The resulting lines of approximation were used to determine formulas for cross-calibration.
Figure 4 shows BMD dependences on HU or GV, inverse coordinates to Figure 3. Approximation lines were created using Excel, including linear lines for CBCT 1 and 3 and MDCT 1–3 and quadratic for CBCT 2 and 4 (the corresponding formulas are shown in Figure 4). The decision to apply the approximation law was based on a visual analysis of the dependence pattern. For CBCT 1, the dependence was divided into two ranges, and its dependent patterns were determined. This is related to artifacts identified during image analysis.
The resulting dependency formulas (see Figure 4) enable us to calculate cross-calibration formulas after simple transformations related to the “standard” MDCT mode of 120 kV and 200 mA (see Table 2, line 5). These formulas are presented in Table 3 (column 2). These formulas should be used according to the following algorithm: measured values of radiographic density of bone samples or templates, expressed in HU for MDCT and GV for CBCT, are substituted as a factor (x) on the right side of formulas; in this case, the calculated value (y) corresponds to the radiographic density of a given sample, expressed in HU, if scanned in MDCT 1 mode. These densities can be assessed using the Misch scale (see Table 1) to determine the appropriate type of bone tissue D1–5.
Table 3. Formulas for cross-calibration for each tested scanner
Abbreviated name of scanners (as in Table 1) | Formulas for cross-calibration relative to MDCT 1 |
CBCT 1 (0–350 mg/mL) CBCT 1_1 (350–1,506 mg/mL) | y = 0.819 × (x) − 164 y = 1.31 × (x) − 164 |
CBCT 2 | y = 4.4 × 10⁻⁵ × (x)2 + 0.771 × (x) + 234 |
CBCT 3 | y = 1.04 × (x) − 188 |
CBCT 4 | y = 1.04 × (x)2 + 0.335 × (x) + 120 |
MDCT 2 | y = 0.748 × (x) − 9.14 |
MDCT 3 | y = 0.937 × (x) − 51.5 |
Note. In formulas, x means the measured values of HU or GV using the corresponding CT scanner; y represents the calculated value for cross-calibration relative to CT 1 (i.e., bone tissue density in HU when using CT 1 from Table 1). CBCT 1–4 mean serial numbers of the tested cone-beam computed tomography scanners; MDCT 2 and 3 mean serial numbers of the tested multidetector computed tomography.
All radiographic densities for the corresponding scanning modes were recalculated using this cross-calibration algorithm. These data are presented in Figure 5. Compared with Figure 3, good data consistency is reported.

Fig. 5. Dependence of the recalculated radiographic densities (HU for MDCT and GV for CBCT) on preset bone mineral densities after cross-calibration. Good agreement is noted between the adjusted data. Cross-calibration was performed relative to the MDCT 1 scanner with 120 kV, 200-mA mode. CBCT, cone beam computed tomography scanner; MDCT 1, tested multidetector computed tomography scanner 1.
DISCUSSION
During the study, CT scanners revealed varying densitometric parameters for the same BMD values (see Figure 3). Radiographic densities of MDCT scanners for water were closest to 0, expressed in HUs: MDCT 1 (1.5), MDCT 2 (−9), and MSKT 3 (14). CBCT has more significant scatters than GVs: CBCT 1 (210), CBCT 2 (−305), CBCT 3 (171), and CBCT 4 (−400). The most reliable radiographic density of distilled water was achieved with MDCT 1 with a scanning mode of 120 kV and 200 mA, selected as an internal standard for cross-calibration. The subsequent dependency pattern in Figure 3 was also heterogeneous regarding curve slope and shapes (significant nonlinearity was reported for CBCT 2 and 3). Rearranging the results in reverse coordinates using approximation lines (see Figure 4) enabled us to determine algorithms for cross-calibration relative to MDCT 1 mode of 120 kV and 200 mA (see Table 2, line 5). These formulas are provided in Table 3. After cross-calibration, recalculated data showed good comparability with MDCT 1. The median difference between measured values and MDCT 1 value before cross-calibration was 160 relative units (HU and GV), and after recalculation, it was decreased by 10 times to 16 relative units (p = 0.000). Despite the cross-calibration, the average difference for CBCT was significantly higher (30 relative units) than for MDCT (eight relative units; p = 0.024). Values were compared using a Mann–Whitney U test. Moreover, the average relative difference in density units between the two templates was 17.69% for CBCT and 4.7% for MDCT.
Due to a significant scatter in relative differences between two templates with different spatial locations (see Figure 2) and a larger scatter relative to the average values of the standard mode of 120 kV and 200 mA after cross-calibration in CBCT, synchronous templates are required, that is, templates located in the oral cavity near the proposed implantation zone of the patient examined. An asynchronous technique effectively used in quantitative CT may be ineffective in CBCT due to several artifacts that cause signal heterogeneity [11]. Calibration is required for specific equipment, modes, and patients.
At present, relative units HU are used in the radiological classification by Misch (see Table 1, columns 5 and 6), which is the main stage of planning dental implantation and selecting a subsequent surgery protocol. In this experimental study, conditions were simulated when the densities of the radiopaque template correspond to the main types of bone tissue, according to Misch (see Table 1), which are D1–5. After cross-calibration, it was shown that it is possible to reliably estimate the HU of various MDCT modes and CBCT methods. This method is inexpensive and easy to use.
A radiopaque template saturated with potassium hydrogen phosphate has long been used in dosimetry as a cortical bone equivalent material [12]. This material was previously used for reference radiopaque phantoms in various dilutions [11, 13]. Moreover, composite materials based on water-insoluble hydroxyapatite or tricalcium phosphate can be considered radiopaque. As in bone tissue, the radiographic density of potassium hydrogen phosphate and tricalcium phosphate changes in concordance with radiographic energy changes [14, 15]. In this experimental study, several voltages were used. We selected scanning modes recommended by manufacturers ranging from 80 to 120 kV, depending on the type of equipment. Densitometric parameters of water correspond to 0 on the HU scale, which is set when calibrating MDCT [1]. MDCT scanners were the most similar to this value parameter.
Phantoms (radioopaque templates) based on potassium hydrogen phosphate were previously used to develop unified measurements and further classify calcifications of vessel walls and bone tissue [16, 17]. Lower accuracy was reported for scanners with low voltage and spatial resolution [18]. Errors in measuring BMD were associated with CT scanner voltage, the reconstruction algorithm used, characteristic scattering artifacts, and a lack of photons at detectors; the radiation power (mA) has a lesser effect [11]. All CT scans of radiopaque templates were performed in the water-immersed state, with dimensions comparable to the sizes of the oral cavity and surrounding soft tissues, making the model conditions closer to scanning real patients [19].
Our quantitative study using radiopaque templates yielded more comprehensive results than previous studies that assessed one type of CT scanner and one type of radiopaque template [20–23]. Because we used original templates with seven specified BMD values and compared six scanners, our study is more unique and evidential. Our study found that using radiopaque templates standardizes and compensates for shortcomings in densitometric classification using CBCT, significantly affecting planning and performing dental procedures [24, 25].
In the future, synchronous radiopaque templates will be used for various types of maxillofacial surgeries, including dental implantation. Using radiopaque templates for planning dental implantation will allow for the development a highly personalized surgery protocol [26–30]. A similar pattern of bone density dependences is observed when comparing CBCT and MDCT; however, individual measurements differ significantly [26]. Our cross-calibration algorithm significantly reduces these differences.
In addition to errors in determining BMD using CBCT, geometric distortions should be assessed [31–34]. Medelnik et al. [35] evaluated the reproducibility of anatomical landmarks and the accuracy of various CBCT and MDCT. Elshenawy et al. [36] reported that an increased area of interest parallel to voxel size may reduce the accuracy of linear CBCT measurements, particularly when assessing small distances. The authors stressed the need to appropriately evaluate object density in addition to determining geometric distortions.
CONCLUSION
When four CBCTs and two MDCTs are used to assess the same bone mineral density samples, the created radiopaque template shows a large scatter of radiographic densities. According to Misch, cross-calibration standardizes densitometric parameters for CBCT and various MDCT modes while reducing scatter by 10 times, allowing bone tissue to be classified. The most promising strategy is to use individual synchronous templates located directly near the area of the proposed dental intervention.
ADDITIONAL INFORMATION
Funding source. This article was prepared by the authors as part of the research and development work (EGISU number: 123031400007-7) in accordance with the Program of the Moscow Department of Health for 2023-2025.
Competing interests. The authors declare that they have no competing interests.
Authors’ contribution. All authors made a substantial contribution to the conception of the work, acquisition, analysis, interpretation of data for the work, drafting and revising the work, final approval of the version to be published and agree to be accountable for all aspects of the work. Sh.D. Hossain, A.B. Danaev, A.A. Dolgalev ― writing the text of the article, performing the experimental part of the research; A.A. Muraev, D.V. Burenchev, S.Yu. Ivanov ― study concept and design; A.V. Petraikin, Yu.A. Vasilev, D.E. Sharova ― data analysis.
About the authors
Shazmim D. Hossain
Peoples Friendship University of Russia
Email: shazmim@mail.ru
ORCID iD: 0000-0002-5410-1849
Assistant Lecturer
Russian Federation, MoscowAlexey V. Petraikin
Research and Practical Clinical Center for Diagnostics and Telemedicine Technologies
Author for correspondence.
Email: alexeypetraikin@gmail.com
ORCID iD: 0000-0003-1694-4682
SPIN-code: 6193-1656
MD, Dr. Sci. (Med.), Assistant Professor, Chief Researcher
Russian Federation, MoscowAlexandr A. Muraev
Peoples Friendship University of Russia
Email: muraev_aa@pfur.ru
ORCID iD: 0000-0003-3982-5512
SPIN-code: 1431-5936
MD, Dr. Sci. (Med.), Professor
Russian Federation, MoscowAslan B. Danaev
Stavropol State Medical University
Email: aslandanaev111@mail.ru
ORCID iD: 0000-0003-4754-3101
SPIN-code: 7266-7722
Assistant Lecturer
Russian Federation, StavropolDmitry V. Burenchev
Research and Practical Clinical Center for Diagnostics and Telemedicine Technologies
Email: BurenchevDV@zdrav.mos.ru
ORCID iD: 0000-0003-2894-6255
SPIN-code: 2411-3959
MD, Dr. Sci. (Med.), Chief Researcher
Russian Federation, MoscowAlexander A. Dolgalev
Stavropol State Medical University
Email: dolgalev@dolgalev.pro
ORCID iD: 0000-0002-6352-6750
SPIN-code: 5941-5771
MD, Dr. Sci. (Med.), Assistant Professor
Russian Federation, StavropolYuriy A. Vasilev
Research and Practical Clinical Center for Diagnostics and Telemedicine Technologies
Email: VasilevYA1@zdrav.mos.ru
ORCID iD: 0000-0002-0208-5218
SPIN-code: 4458-5608
MD, Cand. Sci. (Med.)
Russian Federation, MoscowDarya E. Sharova
Research and Practical Clinical Center for Diagnostics and Telemedicine Technologies
Email: SharovaDE@zdrav.mos.ru
ORCID iD: 0000-0001-5792-3912
SPIN-code: 1811-7595
Russian Federation, Moscow
Sergey Yu. Ivanov
Peoples Friendship University of Russia; The First Sechenov Moscow State Medical University (Sechenov University)
Email: syivanov@yandex.ru
ORCID iD: 0000-0001-5458-0192
SPIN-code: 2607-2679
MD, Dr. Sci. (Med.), Professor, Corresponding Member of the Russian Academy of Sciences
Russian Federation, Moscow; MoscowReferences
- Hounsfield GN. Computerized transverse axial scanning (tomography). Description of system. Br J Radiol. 1973;46(552): 1016–1022. doi: 10.1259/0007-1285-46-552-1016
- Bornstein MM, Scarfe WC, Vaughn VM, Jacobs R. Cone beam computed tomography in implant dentistry: A systematic review focusing on guidelines, indications, and radiation dose risks. Int J Oral Maxillofac Implants. 2014;29(Suppl):55–77. doi: 10.11607/jomi.2014suppl.g1.4
- DenOtter TD, Schubert J. Hounsfield Unit. In: StatPearls. Treasure Island (FL): StatPearls Publishing; 2022.
- Kim Y, Oh TJ, Misch CE, Wang HL. Occlusal considerations in implant therapy: Clinical guidelines with biomechanical rationale. Clin Oral Implants Res. 2005;16(1):26–35. doi: 10.1111/j.1600-0501.2004.01067.x
- Woelber JP, Fleiner J, Rau J, et al. Accuracy and usefulness of CBCT in periodontology: A systematic review of the literature. Int J Periodontics Restorative Dent. 2018;38(2):289–297. doi: 10.11607/prd.2751
- Song D, Shujaat S, de Faria Vasconcelos K, et al. Diagnostic accuracy of CBCT versus intraoral imaging for assessment of peri-implant bone defects. BMC Med Imaging. 2021;21(1):23. doi: 10.1186/s12880-021-00557-9
- Savoldi F, Yon MJ, Kwok VM, et al. Accuracy of CBCT in the identification of mental, lingual, and retromolar foramina: A comparison with visual inspection of human dry mandibles. Int J Periodontics Restorative Dent. 2021;41(6):e277–e286. doi: 10.11607/prd.4770
- Levi C, Gray JE, McCullough EC, Hattery RR. The unreliability of CT numbers as absolute values. AJR Am J Roentgenol. 1982;139(3): 443–447. doi: 10.2214/ajr.139.3.443
- Petraikin AV, Skripnikova IA. Quantitative computed tomography, modern data. Review. Medical Imaging. 2021;25(4):134–146. (In Russ). doi: 10.24835/1607-0763-1049
- Ivanov DV, Kirillova IV, Kossovich LY, et al. Influence of convolution kernel and beam-hardening effect on the assessment of trabecular bonemineral density using quantitative computed tomography. News Saratov University. 2020;20(2):205–219. (In Russ). doi: 10.18500/1816-9791-2020-20-2-205-219
- Petraikin AV, Smorchkova AK, Kudryavtsev ND, et al. Comparison of two asynchronous QCT methods. Medical Imaging. 2020;24(4): 108–118. (In Russ). doi: 10.24835/1607-0763-2020-4-108-118
- Witt RM, Cameron JR. Bone Standards. USAEC Progress Report No. COO-1422-42 US Atomic Energy Comission, Madison, Wisconsin; 1969.
- Cann CE, Genant HK. Precise measurement of vertebral mineral content using computed tomography. J Comput Assist Tomogr. 1980;4(4):493–500. doi: 10.1097/00004728-198008000-00018
- Hubbell JH. Photon cross sections, attenuation coefficients, and energy absorption coefficients from 10 keV to 100 GeV. National Institute of Standards and Technology, Gaithersburg, MD; 1969. doi: 10.6028/NBS.NSRDS.29
- International Commission on Radiation Units and Measurements (ICRU). Tissue Substitutes in Radiation Dosimetry and Measurement. ICRU Report.1989;(44):1–189.
- Nikolaev AE, Korkunova OA, Blokhin IA, et al. Calcification density oncomputed tomography depending on scanning parameters: Phantom study. (In Russ). Med Imaging. 2020;24(4):119–132. doi: 10.24835/1607-0763-2020-4-119-132
- Gaur A, Dhillon M, Puri N, et al. Questionable accuracy of CBCT in determining bone density: A comparative CBCT-CT in vitro study. Dent Med Probl. 2022;59(3):413–419. doi: 10.17219/dmp/143504
- Martinez C, de Molina C, Desco M, Abella M. Optimization of a calibration phantom for quantitative radiography. Med Phys. 2021;48(3):1039–1053. doi: 10.1002/mp.14638
- Hu Z, Wang T, Pan X, et al. Comparison of diagnosis of cracked tooth using contrast-enhanced CBCT and micro-CT. Dentomaxillofac Radiol. 2021;50(7):20210003. doi: 10.1259/dmfr.20210003
- Lehmann L, Alvarez R, Macovski A, et al. Generalized image combinations in dual KVP digital radiography. Med Phys. 1981;8(5):659–667. doi: 10.1118/1.595025
- Chuang KS, Huang H. Comparison of four dual energy image decomposition methods. Physics Med Biol. 1988;33(4):455. doi: 10.1088/0031-9155/33/4/005
- Gingold EL, Hasegawa BH. Systematic bias in basis material decomposition applied to quantitative dual-energy X-ray imaging. Med Phys. 1992;19(1):25–33. doi: 10.1088/0031-9155/33/4/005
- Cardinal HN, Fenster A. An accurate method for direct dual-energy calibration and decomposition. Med Phys. 1990;17(3):327–341. doi: 10.1118/1.596512
- Jacobs R, Salmon B, Codari M, et al. Cone beam computed tomography in implant dentistry: recommendations for clinical use. BMC Oral Health. 2018;18(1):88. doi: 10.1186/s12903-018-0523-5
- Dolgalev AA, Danaev AB, Yusupov RD, et al. Objective assessment of measurement error in significant cone-beam computed tomography in dental practice. Med Alphabet. 2022;(7):65–68. (In Russ). doi: 10.33667/2078-5631-2022-7-65-68
- Cassetta M, Stefanelli LV, Di Carlo S, et al. The accuracy of CBCT in measuring jaws bone density. Eur Rev Med Pharmacol Sci. 2012;16(10):1425–1429.
- Harvey S, Patel S. Guidelines and template for reporting on CBCT scans. Br Dent J. 2020;228(1):15–18. doi: 10.1038/s41415-019-1115-8
- Cassetta M, Stefanelli LV, Pacifici A, et al. How accurate is CBCT in measuring bone density? A comparative CBCT-CT in vitro study. Clin Implant Dent Relat Res. 2014;16(4):471–478. doi: 10.1111/cid.12027
- Parsa A, Ibrahim N, Hassan B, et al. Bone quality evaluation at dental implant site using multislice CT, micro-CT, and cone beam CT. Clin Oral Implants Res. 2015;26(1):e1–7. doi: 10.1111/clr.12315
- Van Dessel J, Nicolielo LF, Huang Y, et al. Accuracy and reliability of different cone beam computed tomography (CBCT) devices for structural analysis of alveolar bone in comparison with multislice CT and micro-CT. Eur J Oral Implantol. 2017;10(1):95–105.
- Dillenseger JP, Matern JF, Gros CI, et al. MSCT versus CBCT: Evaluation of high-resolution acquisition modes for dento-maxillary and skull-base imaging. Eur Radiol. 2015;25(2):505–515. doi: 10.1007/s00330-014-3439-8
- Schegerer AA, Lechel U, Ritter M, et al. Dose and image quality of cone-beam computed tomography as compared with conventional multislice computed tomography in abdominal imaging. Invest Radiol. 2014;49(10):675–684. doi: 10.1097/RLI.0000000000000069
- Veldhoen S, Schöllchen M, Hanken H, et al. Performance of cone-beam computed tomography and multidetector computed tomography in diagnostic imaging of the midface: A comparative study on Phantom and cadaver head scans. Eur Radiol. 2017;27(2):790–800. doi: 10.1007/s00330-016-4387-2
- Grunz JP, Weng AM, Gietzen CH, et al. Evaluation of ultra-high-resolution cone-beam CT prototype of twin robotic radiography system for cadaveric wrist imaging. Acad Radiol. 202;28(10):e314–e322. doi: 10.1016/j.acra.2020.06.018
- Medelnik J, Hertrich K, Steinhäuser-Andresen S, et al. Accuracy of anatomical landmark identification using different CBCT- and MSCT-based 3D images: An in vitro study. J Orofac Orthop. 2011;72(4):261–278. doi: 10.1007/s00056-011-0032-5
- Elshenawy H, Aly W, Salah N, et al. Influence of small, midi, medium and large fields of view on accuracy of linear measurements in CBCT imaging: Diagnostic accuracy study. Open Access Maced J Med Sci. 2019;7(6):1037–1041. doi: 10.3889/oamjms.2019.232
Supplementary files

