


Prospects of using computer vision technology to detect urinary stones and liver and kidney neoplasms on computed tomography images of the abdomen and retroperitoneal space
- Authors: Vasilev Y.A.1,2, Vladzymyrskyy A.V.1,3, Arzamasov K.M.1, Shikhmuradov D.U.1, Pankratov A.V.1, Ulyanov I.V.1, Nechaev N.B.1
-
Affiliations:
- Research and Practical Clinical Center for Diagnostics and Telemedicine Technologies
- National Medical and Surgical Center Named after N.I. Pirogov
- I.M. Sechenov First Moscow State Medical University
- Issue: Vol 5, No 1 (2024)
- Pages: 101-119
- Section: Reviews
- Submitted: 27.06.2023
- Accepted: 22.12.2023
- Published: 19.04.2024
- URL: https://jdigitaldiagnostics.com/DD/article/view/515814
- DOI: https://doi.org/10.17816/DD515814
- ID: 515814

Cite item

Abstract
The article presents a selective literature review on the use of computer vision algorithms for the diagnosis of liver and kidney neoplasms and urinary stones using computed tomography images of the abdomen and retroperitoneal space. The review included articles published between January 1, 2020, and April 24, 2023. Pixel-based algorithms showed the greatest diagnostic accuracy parameters for segmenting the liver and its neoplasms (accuracy, 99.6%; Dice similarity coefficient, 0.99). Voxel-based algorithms were superior at classifying liver neoplasms (accuracy, 82.5%). Pixel- and voxel-based algorithms fared equally well in segmenting kidneys and their neoplasms, as well as classifying kidney tumors (accuracy, 99.3%; Dice similarity coefficient, 0.97). Computer vision algorithms can detect urinary stones measuring 3 mm or larger with a high degree of accuracy of up to 93.0%. Thus, existing computer vision algorithms not only effectively detect liver and kidney neoplasms and urinary stones but also accurately determine their quantitative and qualitative characteristics. Evaluating voxel data improves the accuracy of neoplasm type determination since the algorithm analyzes the neoplasm in three dimensions rather than only the plane of one slice.
Full Text
INTRODUCTION
X-ray diagnosis has greatly evolved in recent years. In particular, computer vision technology has been actively employed for the interpretation of computed tomography (CT) scans for more accurate and timely diagnosis and reduction of the burden on medical personnel [1–3]. Several artificial intelligence algorithms for the analysis of chest CT scans have already demonstrated high accuracy in specific disease areas (with the area under the receiver operating characteristic curve reaching 0.88) [3].
Moreover, computer vision technology is extensively used in the diagnosis of abdominal pathologies. In the last 5 years, the number of PubMed publications on this topic has increased 12 times, i.e., from 34 in 2018 to 411 in 2022. The dramatic increase in the number of studies could be attributed to increased CT availability to the general population, a relatively broad and growing list of diagnosed disorders, and the high accuracy of their verification using CT scans.
Currently, ready-made computer vision-based solutions are capable of detecting common pathologies such as liver and kidney neoplasms and urinary stones using abdominal and retroperitoneal CT scans [4].
These solutions are based on algorithms that can be classified into two types based on their function:
- Algorithms identifying (segmenting) organs and their pathologies
- Algorithms classifying the pathology
The described solutions offer variable levels of diagnostic accuracy, which could be attributed to the architecture of deep-learning networks and computer vision algorithms. Deep machine-learning architectures based on convolutional neural networks are currently most commonly used for classification [5].
This review aimed to assess the diagnostic accuracy and architecture of computer vision algorithms for detecting liver and kidney neoplasms and urinary stones on CT scans, depending on the algorithm function (segmentation or classification).
SEARCH METHODOLOGY
An analytical study was performed: it was a selective literature review of algorithms intended for primary diagnosis of common conditions such as liver and kidney neoplasms and urinary stone disease.
Other common neoplasms, such as pancreatic tumors, can be detected on abdominal and retroperitoneal CT. However, this review focused on liver and kidney neoplasms and urinary stones. If any, few studies have used computer vision technology to detect neoplasms of other organs in these anatomical areas.
The literature search was performed in PubMed (accessed on April 30, 2023) using the following keyword combinations: [“Deep Learning,” “Neural Network,” “Artificial Intelligence”] + [“Liver Tumor,” “Kidney Tumor,” “Hepatocellular Carcinoma,” “Kidney Stone”] + “Computed Tomography”.
A search was also performed in eLibrary, the Russian electronic research library and information analysis system for science citation index (accessed on April 30, 2023), from 2019 to the present using the keywords “Artificial intelligence” + “Computed Tomography”. However, the search failed to identify publications on deep-learning algorithms for detecting abdominal and retroperitoneal organ disorders.
The analysis included studies identified in PubMed that used computer vision algorithms for segmentation and classification of pathologies of interest on abdominal and retroperitoneal CT scans, described the deep-learning algorithm architecture, and presented the results of the algorithm performance using one of the following parameters: Dice coefficient for segmentation and accuracy and F1-score or area under the ROC curve (AUC) for classification [6].
The search covered the period from January 1, 2020, to April 24, 2023.
RESULTS
The review included 21 studies, and their findings are presented in Appendix 1. The architecture was analyzed, and diagnostic metrics were assessed in the selected studies. Moreover, these studies were compared with other publicly available articles not included in the analysis.
Liver neoplasms
Contrast-enhanced CT and magnetic resonance imaging (MRI) are currently the most informative methods for the diagnosis of liver neoplasms [7]. CT offers various advantages over MRI, such as equipment availability, expert qualification, testing time, and cost-effectiveness [8]. Contrast enhancement is a common strategy when a liver neoplasm is suspected because non-contrasted scans are less informative. However, in some other diseases, noncontrasted abdominal CT is often performed. The ability of computer vision algorithms to detect liver neoplasms on non-contrasted СT scans may be used for screening for this pathology [9–11].
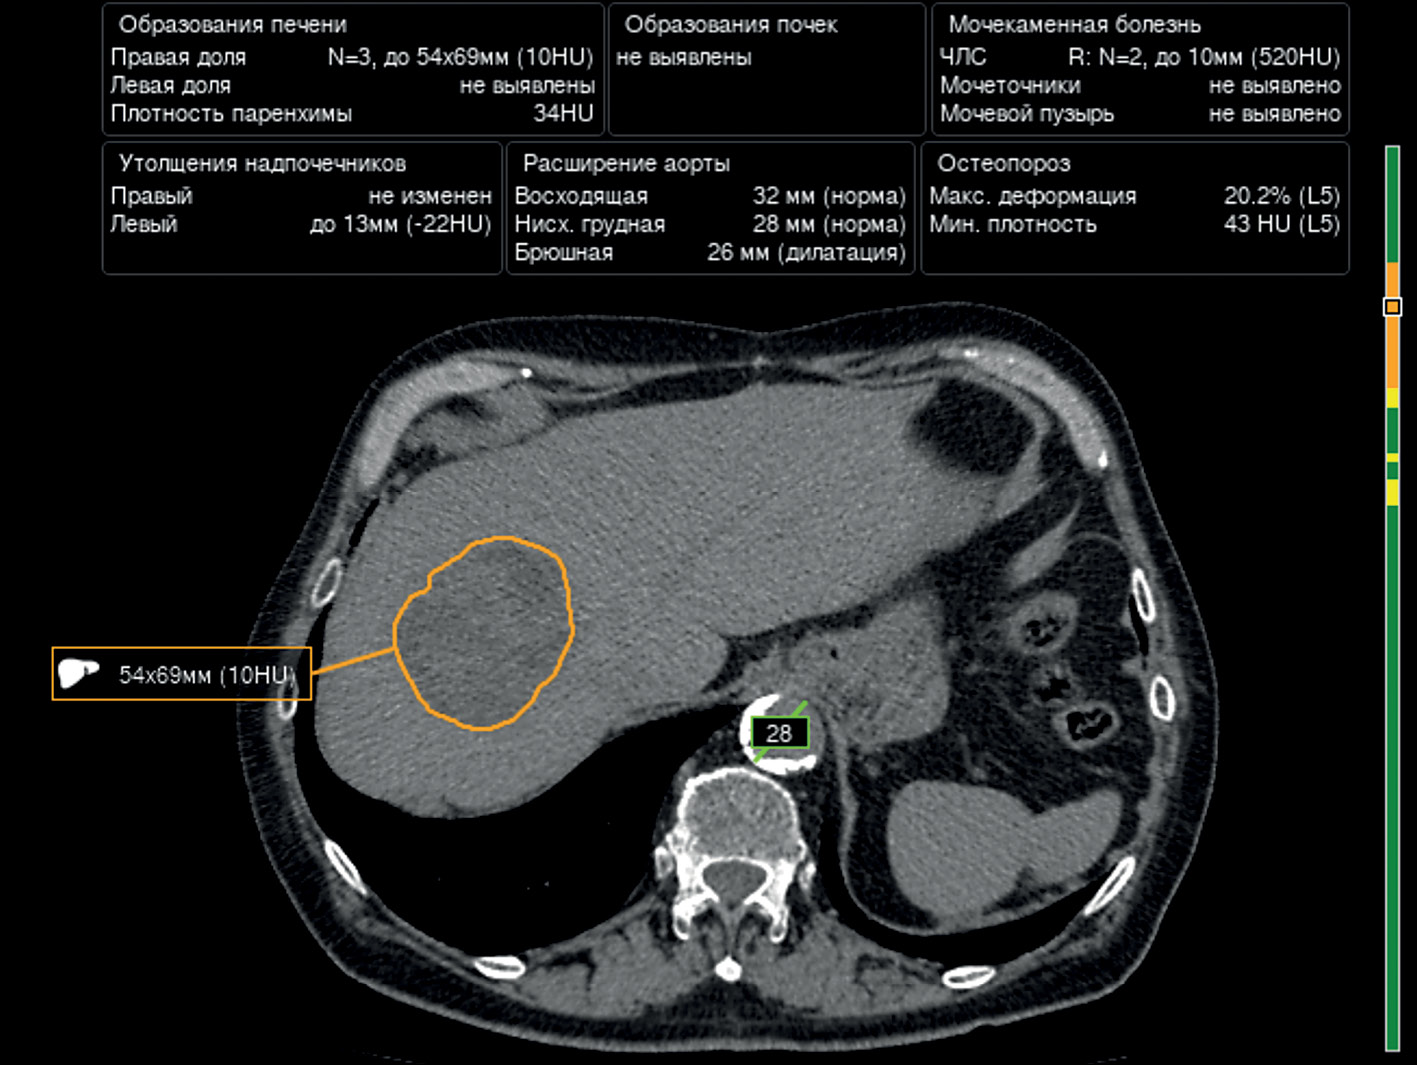
The U-Net architecture and its modifications (i.e., ResNet blocks) are most widely used for segmentation of the liver and liver neoplasms, with acceptable diagnostic accuracy. H. Rahman et al. demonstrated the best results for the segmentation of the liver and liver neoplasms using ResUNet, with a Dice coefficient of 0.09 and an accuracy of 99.6% [12]. An example of liver neoplasm segmentation is presented in Fig. 1.

Fig. 1. An example of liver neoplasm segmentation using one of the algorithms.
Pixel-based (2D image) segmentation algorithms had better diagnostic metrics than voxel-based (3D image) segmentation algorithms [12–18].
In turn, voxel-based algorithms show better diagnostic metrics in liver neoplasm classification. These algorithms demonstrate high reliability in distinguishing benign tumors from malignancies (accuracy up to 85.5%). The accuracy of determining a specific type of malignant neoplasms is currently lower at only 73.4% [19, 20].
Despite the development and widespread use of deep machine-learning, some classic machine-learning algorithms (e.g., support vector machine [SVM]) also demonstrate high diagnostic metrics in liver neoplasm classification, with an accuracy of up to 84.6% [19, 21].
The Center for Diagnostics and Telemedicine (Moscow) is currently developing a computer vision algorithm using contrast enhancement for within-class segmentation and differentiation of liver masses. An example is presented in Fig. 2.

Fig. 2. An example of liver neoplasm segmentation by an algorithm based on a contrast-enhanced CT scan.
Kidney neoplasms
In 27%–50% of cases, kidney neoplasms are asymptomatic and represent random findings [22]. CT allows for the assessment of the tumor location and size and the relationship between the tumor and renal pelvis and large vessels.
In the analyzed studies, the U-Net architecture and its modifications are most widely employed for the segmentation of the kidneys and kidney neoplasms. The Dice coefficient for kidney segmentation currently reaches 0.97 with the U-Net 3D architecture [23]. The same architecture provided the highest Dice coefficient for kidney tumor and kidney cyst segmentation (0.84 and 0.54, respectively). Thus, the accuracy of kidney neoplasm segmentation is currently inferior to that of kidney segmentation. Moreover, voxel-based architectures demonstrated diagnostic accuracy metrics for the segmentation of the kidneys and kidney neoplasms on CT scans noninferior to those of classic pixel-based algorithms [23–26].
Other architectures (e.g., EffectiveNet) also demonstrate a high Dice coefficient for the segmentation of the kidneys and kidney neoplasms (up to 0.95) [27, 28]. An example of kidney neoplasm segmentation is presented in Fig. 3.

Fig. 3. An example of right kidney neoplasm segmentation.
Both classic machine-learning algorithms and deep-learning algorithms are used for the classification of kidney neoplasms [24, 26, 29–31]. Swin transformers architectures have the greatest accuracy (99.3%) [29].
When data are limited, classic machine-learning algorithms and feedforward architectures prove effective [26]. Similarly to the segmentation of the kidneys and kidney neoplasms, the classification performance of voxel-based architectures is noninferior to that of pixel-based architectures [31].
Urinary stone disease
Urinary stone disease is the second most commonly detected urological condition [32]. The incidence and prevalence of urinary stone disease in adults are steadily increasing throughout the Russian Federation. According to N. Gadzhiev et al., the prevalence of urinary stone disease has increased by 35.4% in 15 years, whereas the incidence has reached 16.2% [33].
Retroperitoneal CT is the gold standard for the diagnosis of urinary stone diseases. It allows for the assessment of the location, size, and number of radiopaque urinary stones with sensitivity and specificity of up to 96% and 100%, respectively [34].
The articles showed a direct association between the accuracy of urinary stone detection and the size of urinary stones. The accuracy of convolutional neural network-based algorithms increases with the size of urinary stones [35, 36]. To illustrate, the accuracy rates of detecting urinary stones <1 , 1–2 , and >2 cm were 85%, 89%, and 93%, respectively.
The Swin transformers algorithm has currently the greatest accuracy in urinary stone detection (98%) [29]. An example of urinary stone detection using one of the algorithms is presented in Fig. 4.

Fig. 4. An example of urinary stone detection using one of the algorithms.
The use of computer vision algorithms for the diagnosis of urinary stone diseases can be challenging if small atherosclerotic plaques are present in renal artery walls because their densities are similar to those of urinary stones [36].
Modern deep machine-learning and computer vision technologies allow for the detection of urinary stones measuring ≥3 mm with low radiation exposure, and urinary stones measuring ≥5 mm are considered clinically significant [37].
Determining the urinary stone type is one of the most important factors for the future treatment strategy [35, 37]. Numerous CT-based parameters have been employed in assessing postoperative prognosis (such as relapse-free disease) and determining the urinary stone type using machine-learning technology [38–41]. Several studies of dual-energy CT confirm that this imaging technique can also be used for assessing the chemical composition of urinary stones [42, 43]. However, this method has several limitations, most notably, its low applicability in routine clinical practice [44].
According to Y. Cui et al., narrowly specialized convolutional neural networks allow for the assessment of urinary stones using the STONE nephrolithometry score, and results were comparable to radiologist opinions [45]. This approach also allows for the assessment of prognossis [46].
DISCUSSION
Several studies have used publicly available datasets, such as LiTS, KiTS’19, and 3D-IRCADb, and most of them include contrast-enhanced CT findings. The datasets of studies using their CT scans mostly included contrast-enhanced CT findings or mixed data.
The analysis revealed that modern deep-learning algorithms provide high accuracy liver segmentation (maximum Dice coefficient, 0.99; mean Dice coefficient, 0.92±0.09) and kidney segmentation (maximum Dice coefficient, 0.97; mean Dice coefficient, 0.94±0.02) on CT scans (Appendix 1).
Pixel-based algorithms show better diagnostic accuracy metrics for liver segmentation (maximum Dice coefficient, 0.99; mean Dice coefficient, 0.97±0.01), whereas voxel-based algorithms are noninferior to pixel-based algorithms for kidney segmentation. This could be attributed to differences in the size and density of these solid organs and the history of algorithm development. Voxel-based algorithms have higher performance requirements. Such computer-based systems have only recently become widely available. Currently, improved pixel-based algorithms are being developed in research centers.
Liver and kidney neoplasm segmentation is less accurate than liver and kidney segmentation, which is primarily due to incomplete neoplasm segmentation. The correct determination of neoplasm borders depends on their growth type and structure; thus, the best segmentation is observed for exophytic heterogeneous neoplasms [23]. This is also why isodense cysts and hemangiomas are segmented with low accuracy [20].
Data preprocessing before using a segmentation algorithm resolves this issue to some extent [27, 28]. K. Yildirim et al. found that analyzing alternative CT slices, such as sagittal or coronal, using deep machine-learning algorithms also contributes to the accuracy of pathology detection [47].
According to the literature review, voxel-based algorithms are more suitable for neoplasm classification than pixel-based algorithms because the structure of the tumor is indicative of its nature [19, 26, 31]. Deep-learning technology provides highly accurate classification of benign and malignant abdominal neoplasms [19, 20, 31].
The completeness of segmentation is critical for the accuracy of subsequent classification. Currently, a combination of two-dimensional algorithms can be used for segmentation and a combination of three-dimensional (3D) algorithms for classification [19, 24]. Moreover, a combination of deep- and classic machine-learning algorithms (including gradient boosting) can improve diagnostic metrics [19]. The studies analyzed used two types of combinations of these algorithms. L. Yang et al. and M. Shehata et al. proposed creating features by algorithmic methods and using them in a feedforward network [30, 31]. Meanwhile, E. Trivizakis et al. and X.L. Zhu et al. proposed creating features using deep-learning networks and classifying them using classic machine-learning algorithms [19, 26].
Equally important is using a transformer architecture for neoplasm classification; however, its application is limited by the availability of training data. Obtaining high metrics when using transformer architectures requires significantly more training data than with high accuracy neural networks [29].
The studies analyzed used conventional quality assessment metrics for deep machine-learning algorithms. However, the research methodology varied among studies, making comparative assessment of diagnostic accuracy difficult. Most authors did not provide the 95% confidence interval for diagnostic accuracy parameters, which was an additional limitation and prevented assessment of the significance of differences between metrics obtained using different neural network architectures and approaches. A standardized assessment can be useful in determining algorithms with the best results [48]. Some of the analyzed studies also had small samples.
Another possible use of deep machine-learning algorithms is to improve the quality of low-dose CT scans. For example, F.R. Schwartz et al. proposed using deep machine-learning algorithms for data interpolation and reconstruction in DECT [49–51]. This approach allows for the acquisition of high-energy CT scans with a low radiation exposure.
Thus, computer vision algorithms have already demonstrated good diagnostic accuracy parameters in detecting urinary stones and liver and kidney neoplasms on CT scans. The next goal is to implement computer vision technology in healthcare facilities for more accurate and timely diagnosis and reduction of the burden on medical personnel. More large-scale, well-designed prospective studies are warranted to assess the efficacy of artificial intelligence-based software in detecting abdominal neoplasms during screening and for their qualitative and quantitative assessment with subsequent verification of the results.
CONCLUSION
Existing computer vision systems for assessing abdominal and retroperitoneal CT scans effectively detect liver and kidney neoplasms and urinary stones. Moreover, these systems allow for the accurate determination of their quantitative and qualitative parameters. Further technological advancements will improve 3D deep-learning algorithms and their diagnostic accuracy, ensuring more accurate results, particularly for multiclass classification. Voxel data can provide a more accurate determination of the pathology type because, in this case, algorithms ensure the 3D analysis of neoplasms rather than a single-slice analysis.
A more thorough analysis of data obtained using computer vision technology can be used to determine the effectiveness of contrast-enhanced CT scans. Methods for improving CT scan quality will make it possible to take scans only during specific phases (e.g., arterial and excretory phases) depending on the study purposes, reducing the effective radiation dose.
ADDITIONAL INFORMATION
Funding source. This article was prepared by a group of authors as a part of the research and development effort titled “Evidence-based methodologies for sustainable development of artificial intelligence in medical imaging” (USIS No. 123031500004-5) in accordance with Order No. 1196 dated December 21, 2022 “On Approval of State Assignments Funded by means of Allocations from the Budget of the City of Moscow to the State Budgetary (Autonomous) Institutions Subordinate to the Moscow Health Care Department, for 2023 and the Planned Period of 2024 and 2025” issued by the Moscow Health Care Department.
Competing interests. The authors declare that they have no competing interests.
Authors’ contribution. All authors made a substantial contribution to the conception of the work, acquisition, analysis, interpretation of data for the work, drafting and revising the work, final approval of the version to be published and agree to be accountable for all aspects of the work. Yu.A. Vasiliev, A.V. Vladzimirsky, K.M. Arzamasov — research concept; N.B. Nechaev — writing the text of the article; D.W. Shikhmuradov, A.V. Pankratov, I.V. Ulyanov — data analysis.
Appendix 1
Table 1. Architectures and diagnostic metrics of deep machine-learning algorithms for detecting abdominal pathologies by imaging
1 | 2 | 3 | 4 | 5 |
Purpose | Authors, year | Sample size | Architecture | Claimed diagnostic accuracy parameters |
Segmentation of the liver and its structures | M. Maqsood et al., 2021 [13] | 4 studies | ResUNet with multiscale parallel convolution blocks after Res blocks | Segmentation of the liver – Dice coefficient: 0.77 – Accuracy: 93% |
R.Z. Khan et al., 2022 [14] | 3 studies (Dircadb) 19 studies (LiTS) 4 studies (Silver07) 1 study (Chaos) | ResUNet basic block: three sequential Conv2D layers with kernel-based convolution expansion (three expansion rates: 1, 2, and 4) | 1) Segmentation of the liver Dice’s coefficients: – 0.97 for the Dircadb dataset – 0.97 for the LiTS dataset – 0.97 for the Sliver07 dataset – 0.95 for the Chaos dataset 2) Segmentation of liver neoplasms Dice coefficients: – 0.92 for the Dircadb dataset – 0.87 for the LiTS dataset | |
H. Rahman et al., 2022 [12] | 4 studies | Sequential use of ResUNet for liver segmentation, with subsequent use of the findings in another ResUNet for neoplasm segmentation | Segmentation of the liver and liver neoplasms: – Dice coefficient: 0.99 – Accuracy: 99.6% | |
A. Affane et al., 2021 [15] | 1 study | Three 3D U-Net modifications: 1) 3D U-Net and classic network 2) 3D MultiRes U-Net. The resolution path block is used before skip connection. Inside the Conv block: three linked 3D convolutions, 3×3×3 (first, 32 filters; remainder, 16 filters each), which are pooled, normalized, and summed up with input data processed using Сonv3D (1 × 1 × 1, 64 filters). This is followed by sigmoid activation. 3) 3D Dense U-Net: with residual pooling after each Conv layer | Segmentation of the liver Dice coefficients: – 0.86 for the 3D MultiRes U-Net – 0.84 for the 3D Dense U-Net – 0.73 for the 3D U-Net | |
J. Wang et al., 2023 [17] | 8 studies (Dircadb) 15 studies (LiTS) | 3D MAD-UNet: Long-short skip connection (LSSC) and attention module are used for all decoder levels. | Segmentation of liver neoplasms Dice coefficients: – 0.96 for the 3D U-Net + LSSC + MA with the LiTS dataset – 0.96 for the 3D U-Net + LSSC + MA with the Dircadb dataset – 0.92 for the 3D U-Net with the LiTS dataset – 0.89 for the 3D U-Net with the Dircadb dataset |
Table 1. Continued
1 | 2 | 3 | 4 | 5 |
Classification of liver neoplasms by nosological entities | K.G. Kashala et al., 2020 [18] | 250 studies | Modified SqeezeNet model with a bypass after blocks 2, 4, 6, and 8, and Conv2D (1 × 1) before pooling expand blocks | – Accuracy: 81.8% – F1-score: 0.80 |
J. Zhou et al., 2021 [20] | 154 studies | 2.5D Faster R-CNN was used for segmentation. 3D ResNet-18 (Conv3D-based modification) was used for classification. | – Accuracy: 82.5% for distinguishing between benign/malignant neoplasms – Accuracy: 73.4% for detecting one of the six conditions (hepatocellular carcinoma, cholangiocarcinoma, metastasis, hemangioma, hyperplasia, and cyst) | |
M. Rela et al., 2022 [21] | 14 studies | Support vectors method, k-nearest neighbors method | 1) Support vectors method – Accuracy: 84.6% – F1-score: 0.80 2) k-nearest neighbors method – Accuracy: 76.92% – F1-score: 0.76 | |
Segmentation of the kidneys and kidney neoplasms | Y. Ding et al., 2022 [25] | 30 studies | – U-Net – V-Net, a modification using ResNet blocks for 3D images | Segmentation of the kidneys: 1) Dice coefficient for the left kidney – 0.93 for U-Net – 0.92 for V-Net 2) Dice coefficient for the right kidney – 0.91 for U-Net – 0.92 for V-Net |
Z. Lin et al., 2021 [23] | 66 studies | 3D U-Net | 1) Segmentation of the kidneys – Dice coefficient: 0.97 2) Segmentation of kidney neoplasms – Dice coefficient: 0.84 3) Segmentation of kidney cysts – Dice coefficient: 0.54 |
Table 1. Continued
1 | 2 | 3 | 4 | 5 |
Segmentation of the kidneys and kidney neoplasms | C.H. Hsiao et al., 2022 [27] | 90 studies | U-Net with ResNet-41 or EffectiveNet architectures used as encoder blocks | Segmentation of the kidneys 1) Dice coefficient (data with preprocessing and U-Net with an encoder) – 0.96 for EfficientNet-B7 – 0.95 for ResNet-41 – 0.95 for EfficientNet-B4 – 0.95 for EfficientNet-B4, fine-tuning 2) Dice coefficient (data without preprocessing and U-Net with an encoder) – 0.95 for EfficientNet-B4, fine-tuning – 0.93 for ResNet-41 – 0.29 for EfficientNet-B4 – 0,27 for EfficientNet-B7 3) Segmentation of kidney neoplasms Dice coefficient: 0.41 (EfficientNet-B5) |
C.H. Hsiao et al., 2022 [28] | 56 studies (KiTS19) | EffectiveNet-B5 (encoder); Feature pyramid network (decoder) | Segmentation of the kidneys and kidney neoplasms Dice coefficient: 0.95 | |
Segmentation and classification of kidney neoplasms by nosological entities | M.H. Islam et al., 2022 [29] | ~1,000 scans | Six architectures – Modified VGG16 – Inception v3 – ResNet50 – EANet – Swin Transformers – CCT | Classification of kidney neoplasms 1) VGG16 architecture – Accuracy: 98.2% – Mean F1-score: 0.98 – Mean AUC: 0.99 2) Inception v3 architecture – Accuracy: 61.6% – Mean F1-score: 0.59 – Mean AUC: 0.85 3) ResNet50 architecture – Accuracy: 73.8% – Mean F1-score: 0.74 – Mean AUC: 0.93 4) EANet architecture: – Accuracy: 77.0% – Mean F1-score: 0.77 – Mean AUC: 0.96 5) Swin Transformers architecture – Accuracy: 99.3% – Mean F1-score: 0.99 – Mean AUC: 0.99 6) CCT architecture – Accuracy: 96.5% – Mean F1-score: 0.97 – Mean AUC: 0.99 |
Table 1. Continued
1 | 2 | 3 | 4 | 5 |
Segmentation and classification of kidney neoplasms by nosological entities | Toda N. et al., 2022 [24] | 132 studies | 2D U-Net for kidney segmentation 3D U-Net for neoplasm segmentation and classification | Classification of kidney neoplasms – Accuracy: 87.5% – AUC: 0.93 |
Zhu X.L. et al., 2022 [26] | 20 studies | FS-net: source data were entered into a fine-tuned 3D U-Net. The resulting mask was pooled with the source data and entered into the fine-tuned 3D U-Net. Segmented kidney and kidney area data were received from the resulting mask. A texture analysis of the segmented data was performed to create features. A fine-tuned 3D U-Net was used for the kidney area to create features. The resulting features were used in the support vectors method. | 1) Segmentation of the kidneys –Dice coefficient: 0.97 (KiTS19) – Dice coefficient: 0.97 (own dataset) 2) Segmentation of kidney neoplasms – Dice coefficient: 0.79 (KiTS19) – Dice coefficient: 0.77 (own dataset) | |
Classification of kidney neoplasms and their characteristics | L. Yang et al., 2022 [30] | 120 studies | Features were created for manually segmented kidneys using the Pyradiomiocs library. A feedforward network was used for the features. | Classification of kidney neoplasms: AUC: – 0.76 in the pre-contrast phase – 0.79 in the corticomedullary phase – 0.77 in the nephrographic phase |
M. Shehata et al., 2021 [31] | – | The following features were created for manually segmented kidneys with a neoplasm: morphological (shape assessment), textural, and functional. A feedforward network was used for the features to classify them as benign or malignant. A feedforward network was used for malignant features to distinguish between clear cell and nonclear cell cancer | Classification of benign vs. malignant kidney neoplasms – F1-score: 0.98 Classification of kidney cancer – Accuracy: 89.6% | |
Urinary stone detection by CT | A. Caglayan et al., 2022 [35] | – | xResNet50 | Urinary stones <1 cm – Accuracy: 85% – F1-score: 0.85 Urinary stones 1–2 cm – Accuracy: 89% – F1-score: 0.89 Urinary stones >2 cm – Accuracy: 93% – F1-score: 0.93 |
Table 1. End
1 | 2 | 3 | 4 | 5 |
Urinary stone detection by CT | C. Daniel et al., 2022 [36] | 90 studies | 3D U-Net for kidney segmentation, noise reduction, and cropping the area of interest; 13-layer 3D CNN for classification | – AUC: 0.95 – Specificity: 0.91 |
Y. Cui et al., 2021 [45] | 117 studies | Sequential use of 3D U-Net architectures for kidney segmentation. The obtained data were used in five 3D U-Net architectures, each intended to classify one STONE score parameter. | Segmentation of the kidneys and sinuses – Dice coefficient: 0.93 Urinary stone detection – Accuracy: 90.3% – AUC: 0.96 | |
K. Yildirim et al., 2021 [47] | 100 studies | xResNet50 | – Accuracy: 97% – F1-score: 0.97 |
About the authors
Yuriy A. Vasilev
Research and Practical Clinical Center for Diagnostics and Telemedicine Technologies; National Medical and Surgical Center Named after N.I. Pirogov
Email: npcmr@zdrav.mos.ru
ORCID iD: 0000-0002-0208-5218
SPIN-code: 4458-5608
MD, Cand. Sci. (Medicine)
Russian Federation, Moscow; MoscowAnton V. Vladzymyrskyy
Research and Practical Clinical Center for Diagnostics and Telemedicine Technologies; I.M. Sechenov First Moscow State Medical University
Email: VladzimirskijAV@zdrav.mos.ru
ORCID iD: 0000-0002-2990-7736
SPIN-code: 3602-7120
MD, Dr. Sci. (Medicine), Professor
Russian Federation, Moscow; MoscowKirill M. Arzamasov
Research and Practical Clinical Center for Diagnostics and Telemedicine Technologies
Email: ArzamasovKM@zdrav.mos.ru
ORCID iD: 0000-0001-7786-0349
SPIN-code: 3160-8062
MD, Cand. Sci. (Medicine)
Russian Federation, MoscowDavid U. Shikhmuradov
Research and Practical Clinical Center for Diagnostics and Telemedicine Technologies
Email: ShikhmuradovDU@zdrav.mos.ru
ORCID iD: 0000-0003-1597-5786
SPIN-code: 9641-0913
MD
Russian Federation, MoscowAndrey V. Pankratov
Research and Practical Clinical Center for Diagnostics and Telemedicine Technologies
Email: PankratovAV3@zdrav.mos.ru
ORCID iD: 0009-0008-4741-4530
MD
Russian Federation, MoscowIliya V. Ulyanov
Research and Practical Clinical Center for Diagnostics and Telemedicine Technologies
Email: UlyanovIV2@zdrav.mos.ru
ORCID iD: 0000-0002-8330-6069
SPIN-code: 5898-3242
MD
Russian Federation, MoscowNikolay B. Nechaev
Research and Practical Clinical Center for Diagnostics and Telemedicine Technologies
Author for correspondence.
Email: NechaevNB@zdrav.mos.ru
ORCID iD: 0009-0007-9219-7726
SPIN-code: 3232-1545
MD, Cand. Sci. (Medicine)
Russian Federation, MoscowReferences
- Iliashenko OY, Lukyanchenko EL. Possibilities of using computer vision for data analytics in medicine. Izvestiya of Saratov University. Mathematics. Mechanics. Informatics. 2022;22(2):224–232. EDN: MCSLKQ doi: 10.18500/1816-9791-2022-22-2-224-232
- Alekseeva MG, Zubov AI, Novikov MYu. Artificial intelligence in medicine. Meždunarodnyj naučno-issledovatelʹskij žurnal. 2022;7(121):10–13. EDN: JMMMDF doi: 10.23670/IRJ.2022.121.7.038
- Gusev AV, Vladzymyrskyy AV, Sharova DE, Arzamasov KM, Khramov AE. Evolution of research and development in the field of artificial intelligence technologies for healthcare in the Russian Federation: results of 2021. Digital Diagnostics. 2022;3(3):178–194. EDN: KHWQWZ doi: 10.17816/DD107367
- Wang L, Wang H, Huang Y, et al. Trends in the application of deep learning networks in medical image analysis: Evolution between 2012 and 2020. Eur J Radiol. 2022;146:110069. doi: 10.1016/j.ejrad.2021.110069
- Alrefai N, Ibrahim O. AI Deep learning-based cancer classification for microarray data: A systematic review. Journal of Theoretical and Applied Information Technology. 2021;99:2312–2332. doi: 10.5281/zenodo.6126510
- Clinical trials of artificial intelligence systems (radiation diagnostics). Vasil’ev YuA, Vladzymyrskyy AV, Sharova DE, editors. Moscow: GBUZ «NPKTs DiT DZM»; 2023. EDN: PUIJLD
- Lee J, Kim KW, Kim SY, et al. Automatic detection method of hepatocellular carcinomas using the non-rigid registration method of multi-phase liver CT images. J Xray Sci Technol. 2015;23(3):275–288. doi: 10.3233/XST-150487
- Patel BN, Boltyenkov AT, Martinez MG, et al. Cost-effectiveness of dual-energy CT versus multiphasic single-energy CT and MRI for characterization of incidental indeterminate renal lesions. Abdom Radiol (NY). 2020;45(6):1896–1906. doi: 10.1007/s00261-019-02380-x
- Marrero JA, Kulik LM, Sirlin CB, et al. Diagnosis, Staging, and Management of Hepatocellular Carcinoma: 2018 Practice Guidance by the American Association for the Study of Liver Diseases. Hepatology. 2018;68(2):723–750. doi: 10.1002/hep.29913
- Ayuso C, Rimola J, Vilana R, et al. Diagnosis and staging of hepatocellular carcinoma (HCC): current guidelines. Eur J Radiol. 2018;101:72–81. doi: 10.1016/j.ejrad.2018.01.025
- Liver cancer (hepatocellular). Clinical guidelines. ID 1. Approved by the Scientific and Practical Council of the Ministry of Health of the Russian Federation. 2022. Available from: https://cr.minzdrav.gov.ru/schema/1_3 (In Russ)
- Rahman H, Bukht TFN, Imran A, et al. A Deep Learning Approach for Liver and Tumor Segmentation in CT Images Using ResUNet. Bioengineering (Basel). 2022;9(8):368. doi: 10.3390/bioengineering9080368
- Maqsood M, Bukhari M, Ali Z, et al. A Residual-Learning-Based Multi-Scale Parallel-Convolutions- Assisted Efficient CAD System for Liver Tumor Detection. Mathematics. 2021;9(10):1133. doi: 10.3390/math9101133
- Khan RA, Luo Y, Wu FX. RMS-UNet: Residual multi-scale UNet for liver and lesion segmentation. Artif Intell Med. 2022;124:102231. doi: 10.1016/j.artmed.2021.102231
- Affane A, Kucharski A, Chapuis P, et al. Segmentation of Liver Anatomy by Combining 3D U-Net Approaches. Applied Sciences. 2021;11(11):4895. doi: 10.3390/app11114895
- Han X, Wu X, Wang S, et al. Automated segmentation of liver segment on portal venous phase MR images using a 3D convolutional neural network. Insights Imaging. 2022;13(1):26. doi: 10.1186/s13244-022-01163-1
- Wang J, Zhang X, Guo L, et al. Multi-scale attention and deep supervision-based 3D UNet for automatic liver segmentation from CT. Math Biosci Eng. 2023;20(1):1297–1316. doi: 10.3934/mbe.2023059
- Kashala KG, Song Y, Liu Z. Optimization of FireNet for Liver Lesion Classification. Electronics. 2020;9(8):1237. doi: 10.3390/electronics9081237
- Trivizakis E, Manikis GC, Nikiforaki K, et al. Extending 2-D Convolutional Neural Networks to 3-D for Advancing Deep Learning Cancer Classification With Application to MRI Liver Tumor Differentiation. IEEE J Biomed Health Inform. 2019;23(3):923–930. doi: 10.1109/JBHI.2018.2886276
- Zhou J, Wang W, Lei B, et al. Automatic Detection and Classification of Focal Liver Lesions Based on Deep Convolutional Neural Networks: A Preliminary Study. Front Oncol. 2021;10:581210. doi: 10.3389/fonc.2020.581210
- Rela M, Rao SN, Patil RR. Performance analysis of liver tumor classification using machine learning algorithms. International Journal of Advanced Technology and Engineering Exploration. 2022;9(86):143–154. doi: 10.19101/IJATEE.2021.87465
- Oberai A, Varghese B, Cen S, et al. Deep learning based classification of solid lipid-poor contrast enhancing renal masses using contrast enhanced CT. Br J Radiol. 2020;93(1111):20200002. doi: 10.1259/bjr.20200002
- Lin Z, Cui Y, Liu J, et al. Automated segmentation of kidney and renal mass and automated detection of renal mass in CT urography using 3D U-Net-based deep convolutional neural network. Eur Radiol. 2021;31(7):5021–5031. doi: 10.1007/s00330-020-07608-9
- Toda N, Hashimoto M, Arita Y, et al. Deep Learning Algorithm for Fully Automated Detection of Small (≤4 cm) Renal Cell Carcinoma in Contrast-Enhanced Computed Tomography Using a Multicenter Database. Invest Radiol. 2022;57(5):327–333. doi: 10.1097/RLI.0000000000000842
- Ding Y, Chen Z, Wang Z, et al. Three-dimensional deep neural network for automatic delineation of cervical cancer in planning computed tomography images. J Appl Clin Med Phys. 2022;23(4):e13566. doi: 10.1002/acm2.13566
- Zhu XL, Shen HB, Sun H, et al. Improving segmentation and classification of renal tumors in small sample 3D CT images using transfer learning with convolutional neural networks. Int J Comput Assist Radiol Surg. 2022;17(7):1303–1311. doi: 10.1007/s11548-022-02587-2
- Hsiao CH, Sun TL, Lin PC, et al. A deep learning-based precision volume calculation approach for kidney and tumor segmentation on computed tomography images. Comput Methods Programs Biomed. 2022;221:106861. doi: 10.1016/j.cmpb.2022.106861
- Hsiao CH, Lin PC, Chung LA, et al. A deep learning-based precision and automatic kidney segmentation system using efficient feature pyramid networks in computed tomography images. Comput Methods Programs Biomed. 2022;221:106854. doi: 10.1016/j.cmpb.2022.106854
- Islam MN, Hasan M, Hossain MK, et al. Vision transformer and explainable transfer learning models for auto detection of kidney cyst, stone and tumor from CT-radiography. Sci Rep. 2022;12(1):11440. doi: 10.1038/s41598-022-15634-4
- Yang L, Gao L, Arefan D, et al. A CT-based radiomics model for predicting renal capsule invasion in renal cell carcinoma. BMC Med Imaging. 2022;22(1):15. doi: 10.1186/s12880-022-00741-5
- Shehata M, Alksas A, Abouelkheir RT, et al. A Comprehensive Computer-Assisted Diagnosis System for Early Assessment of Renal Cancer Tumors. Sensors (Basel). 2021;21(14):4928. doi: 10.3390/s21144928
- Kulikovskiy VF, Shkodkin SV, Batishchev SA, et al. Modern research and thinking about the epidemiology and pathogenesis of urolithiasis. Nauchnyi rezul’tat. Meditsina i farmatsiya. 2016;2(4):4–12. EDN: NSGAXL doi: 10.18413/2313-8955-2016-2-4-4-12
- Gadzhiev N, Prosyannikov M, Malkhasyan V, et al. Urolithiasis prevalence in the Russian Federation: analysis of trends over a 15-year period. World J Urol. 2021.Vol. 39(10):3939–3944. doi: 10.1007/s00345-021-03729-y
- Urology. Russian Clinical Recommendations. Alyaev YuG, Glybochko PV, Pushkar’ DYu, editors. Moscow: GEOTARMedia; 2016. (In Russ).
- Caglayan A, Horsanali MO, Kocadurdu K, et al. Deep learning model-assisted detection of kidney stones on computed tomography. Int Braz J Urol. 2022;48(5):830–839. doi: 10.1590/S1677-5538.IBJU.2022.0132
- Elton DC, Turkbey EB, Pickhardt PJ, Summers RM. A deep learning system for automated kidney stone detection and volumetric segmentation on noncontrast CT scans. Med Phys. 2022;49(4):2545–2554. doi: 10.1002/mp.15518
- He Z, An L, Chang Z, Wu W. Comment on “Deep learning computer vision algorithm for detecting kidney stone composition”. World J Urol. 2021;39(1):291. doi: 10.1007/s00345-020-03181-4
- Doyle PW, Kavoussi NL. Machine learning applications to enhance patient specific care for urologic surgery. World J Urol. 2022;40(3):679–686. doi: 10.1007/s00345-021-03738-x
- Neymark AI, Neymark BA, Ershov AV, et al. The use of intelligent analysis (IA) in determining the tactics of treating patients with nephrolithiasis. Urologia Journal. 2023;(3915603231162881). doi: 10.1177/03915603231162881
- Kadlec AO, Ohlander S, Hotaling J, et al. Nonlinear logistic regression model for outcomes after endourologic procedures: a novel predictor. Urolithiasis. 2014;42(4):323–330. doi: 10.1007/s00240-014-0656-1
- Black KM, Law H, Aldoukhi A, et al. Deep learning computer vision algorithm for detecting kidney stone composition. BJU Int. 2020;125(6):920–924. doi: 10.1111/bju.15035
- Zhang GM, Sun H, Xue HD, et al. Prospective prediction of the major component of urinary stone composition with dual-source dual-energy CT in vivo. Clin Radiol. 2016;71(11):1178–1183. doi: 10.1016/j.crad.2016.07.012
- Chaytor RJ, Rajbabu K, Jones PA, McKnight L. Determining the composition of urinary tract calculi using stone-targeted dual-energy CT: evaluation of a low-dose scanning protocol in a clinical environment. Br J Radiol. 2016;89(1067):20160408. doi: 10.1259/bjr.20160408
- Kapanadze LB, Serova NS, Rudenko VI. Application of dual-energy computer tomography in diagnostics of urolithiasis. REJR. 2017;7(3):165–173. EDN: ZWBLYL doi: 10.21569/2222-7415-2017-7-3-165-173
- Cui Y, Sun Z, Ma S, et al. Automatic Detection and Scoring of Kidney Stones on Noncontrast CT Images Using S.T.O.N.E. Nephrolithometry: Combined Deep Learning and Thresholding Methods. Mol Imaging Biol. 2021;23(3):436–445. doi: 10.1007/s11307-020-01554-0
- Okhunov Z, Friedlander JI, George AK, et al. S.T.O.N.E. nephrolithometry: novel surgical classification system for kidney calculi. Urology. 2013;81(6):1154–1159. doi: 10.1016/j.urology.2012.10.083
- Yildirim K, Bozdag PG, Talo M, et al. Deep learning model for automated kidney stone detection using coronal CT images. Comput Biol Med. 2021;135:104569. doi: 10.1016/j.compbiomed.2021.104569
- Kodenko MR, Reshetnikov RV, Makarova TA. Modification of quality assessment tool for artificial intelligence diagnostic test accuracy studies (QUADAS-CAD). Digital Diagnostics. 2022;3(1S):4–5. EDN: KNBHOJ doi: 10.17816/DD105567
- Schwartz FR, Clark DP, Ding Y, Ramirez-Giraldo JC. Evaluating renal lesions using deep-learning based extension of dual-energy FoV in dual-source CT-A retrospective pilot study. Eur J Radiol. 2021;139:109734. doi: 10.1016/j.ejrad.2021.109734
- Li W, Diao K, Wen Y, et al. High-strength deep learning image reconstruction in coronary CT angiography at 70-kVp tube voltage significantly improves image quality and reduces both radiation and contrast doses. Eur Radiol. 2022;32(5):2912–2920. doi: 10.1007/s00330-021-08424-5
- Bae JS, Lee JM, Kim SW, et al. Low-contrast-dose liver CT using low monoenergetic images with deep learning-based denoising for assessing hepatocellular carcinoma: a randomized controlled noninferiority trial. Eur Radiol. 2023;33(6):4344–4354. doi: 10.1007/s00330-022-09298-x
Supplementary files

