

")


Machine-learning and artificial neural network technologies in the classification of postkeratotomic corneal deformity
- Authors: Tsyrenzhapova E.K.1, Rozanova O.I.1, Iureva T.N.1,2,3, Ivanov A.A.1, Rozanov I.S.4
-
Affiliations:
- The S. Fyodorov Eye Microsurgery Federal State Institution
- Irkutsk State Medical University
- Russian Medical Academy of Continuous Professional Education
- LLC Transneft Technology
- Issue: Vol 5, No 1 (2024)
- Pages: 64-74
- Section: Original Study Articles
- Submitted: 29.11.2023
- Accepted: 14.02.2024
- Published: 19.04.2024
- URL: https://jdigitaldiagnostics.com/DD/article/view/624022
- DOI: https://doi.org/10.17816/DD624022
- ID: 624022

Cite item

Abstract
BACKGROUND: A thorough analysis of both optical and anatomical properties of the cornea in patients after anterior radial keratotomy is important in choosing the optical power of an intraocular lens in the surgical treatment of cataracts and other types of optical correction. Improving the classification of postkeratotomic corneal deformity is crucial in modern ophthalmology due to its diverse clinical presentation.
AIM: To develop an automated classification system for postkeratotomic corneal deformity using machine learning and artificial neural networks based on the analysis of topographic maps of the cornea.
MATERIALS AND METHODS: Depersonalized data from medical records of 250 patients aged 46–76 (mean, 59.63±5.95) years were analyzed. Moreover, 500 topographic maps of the anterior and posterior surfaces of the cornea were analyzed, and three stages of machine learning for postkeratotomic corneal deformity classification were performed.
RESULTS: Stage I, which involved topography analysis of the anterior and posterior surfaces of the cornea, allowed for the measurement of anterior and posterior corneal elevation in three ring-shaped zones. At stage II, a direct distribution neural network was selected and created during deep machine learning. Eight auxiliary parameters describing the shape of the anterior and posterior surfaces of the cornea were established. In Stage III, classification algorithms for postkeratotomic corneal deformity were developed based on the test-to-training sample ratio, which ranged from 75% to 91%.
CONCLUSION: The proposed artificial neural network classifies postkeratotomic corneal deformity types with an accuracy of 91%. The potential for further improving the training quality of this artificial neural network has been established. Neural network algorithms can become a useful tool for the automatic classification of postkeratotomic corneal deformity in patients after radial keratotomy.
Full Text
BACKGROUND
More extensive ophthalmological examinations in the diagnosis of eye diseases have significantly increased the healthcare burden, particularly on ophthalmology clinics. Meanwhile, technologies such as deep machine learning and artificial neural networks (ANNs) allow automation of the analysis of the results, increasing the accuracy and speed of abnormality detection, and automating decision-making in clinical practice. In the diagnosis of eye diseases, machine-learning models are most commonly used when assessing fundus images, lens opacities, optic nerve changes in glaucoma, and tonometry data. In addition, machine learning and artificial intelligence are widely used for detecting corneal changes. Studies of corneal disorders have focused on the diagnosis of keratoconus [1–6]. Convolutional neural networks are particularly efficient at pattern recognition and image classification, making these algorithms a smart choice for the automated analysis of color-coded Scheimpflug camera images [7]. V.A. Dos Santos et al. developed and trained the CorneaNet neural network (Austria) for segmenting corneal optical coherence tomography (OCT) images [8]. In Taiwan, B.I. Kuo et al. retrospectively evaluated corneal topography results to develop a deep machine-learning algorithm for detecting keratoconus [9]. S. Shi et al. revealed excellent results in the differential diagnosis of subclinical keratoconus and healthy corneas using machine learning in combination with Scheimpflug camera images and ultrahigh resolution OCT [10]. Several recent studies have shown the effectiveness of methods involving convolutional neural networks in the automated detection of Fuchs’ dystrophy as part of an algorithm for classifying corneal endothelium images [11].
Moreover, the number of patients with age-related cataracts and myopia, for which radial keratotomy (RK) was previously performed, is steadily increasing. RK was the first mass-scale refractive surgery, addressing a significant problem at the time: correcting myopia in many patients worldwide. The refractive effect of RK is based on a change in the power of the cornea resulting from a change in the configuration of its central region, which is caused by a local weakening of the biomechanical properties of the cornea at the radial incision site under intraocular pressure. In RK development, it was assumed to result in the uniform flattening of both corneal surfaces, maintaining the ratio of the curvature radii of their circumferences. However, the corneal deformity is influenced by the initial parameters of the eye (biomechanical properties of the cornea, myopia grade, and intraocular pressure), surgical factors (number, depth, and length of incisions, and quality of the surgery), individual characteristics of regenerative processes and scarring, patient’s age at surgery, patient’s lifestyle, aging processes, etc. These factors explain why the cornea may demonstrate significant deformational changes in the long-term period after RK, which is of particular importance when planning for cataract surgery with intraocular lens (IOL) implantation.
In patients with a previously surgically modified cornea, errors in the analysis of the preoperative optical properties of the cornea may have serious consequences such as refractive errors and poor vision quality after cataract surgery. Therefore, a thorough analysis of the corneal elevation pattern after RK, development of criteria for classifying post-keratotomy corneal deformities (PKCDs), and creation of an automated system for their classification may become the basis for a personalized approach to cataract surgery and increased accuracy of calculating the IOL power in this patient population.
AIM
To develop an automated system for PKCD classification using machine learning and ANNs based on the analysis of numerical values in corneal topography maps.
MATERIALS AND METHODS
Anonymized medical record data of 250 patients aged 46–76 years (mean age, 59.63 ± 5.95 years) who presented to the Irkutsk branch of the S.N. Fyodorov Eye Microsurgery Complex of the Ministry of Health of the Russian Federation between 2020 and 2023 were analyzed. In addition to the standard ophthalmological examination, all patients underwent corneal elevation mapping using Pentacam® HR (Oculus, Germany). In total, 38 parameters of the elevation of the anterior and posterior corneal surfaces and 12 parameters related to the corneal thickness, refractive power, astigmatism, and asphericity values were recorded as characteristics of the optical properties of the cornea. The study was performed in three stages.
Stage I: Analysis of the elevation display maps of the anterior and posterior corneal surfaces
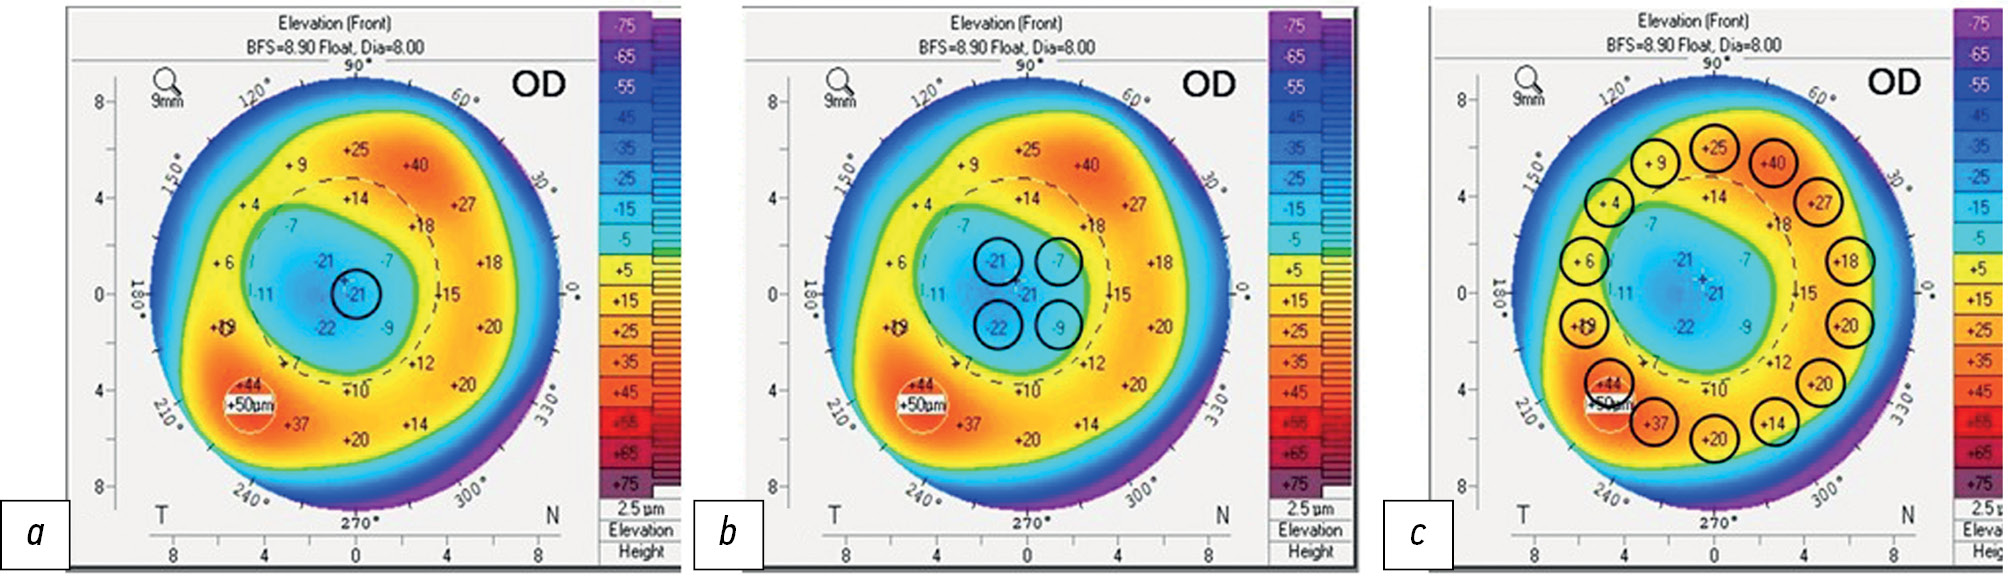
The dataset included 19 numerical values of elevation of both the anterior and posterior corneal surfaces from 500 elevation display maps (Pentacam® 4 Maps Refractive display). The elevation data were recorded in three ring-shaped zones: in the center, at 4 points in the paracentral zone, and at 14 points in the 6-mm peripheral zone. The study was conducted starting from the 90° point and then moving clockwise. A schematic arrangement of topographic points on the corneal elevation map is presented in Fig. 1.

Fig. 1. Corneal surface reference points: a — central area; b — paracentral area; c — 6 mm peripheral area.
Stage II: Deep-learning architecture and visualization
A personal computer with Windows 10 Operating System, AMD Ryzen™ 7 2700E CPU, and 16 GB RAM was used in the training and testing of the developed architecture. The GPU was not used for model training; all necessary calculations were performed with the CPU. For programming, Python 3.10 with the Anaconda distribution was used, particularly the tf.keras 2.12.0 library. The Keras API specification was implemented within the TensorFlow framework version 2.0. The key parameter in the dataset was type, which describes the elevation of the anterior and posterior corneal surfaces. The PKCD type was determined based on the elevation display map. Depending on the elevation pattern of the anterior and posterior corneal surfaces, six PKCD types were identified (Table 1) [14].
Table 1. Classification of postkeratotomic corneal deformities by the elevation pattern of the anterior and posterior corneal surfaces
Deformity type | Anterior corneal elevation pattern | Posterior corneal elevation pattern |
1 | “Open ring” * | “Open ring” * |
 |  | |
2 | “Closed ring” * | “Open ring” * |
 |  | |
3 | “Closed ring” * | “Closed ring” * |
 |  | |
4 | “Open ring” * | “Closed ring” * |
 |  | |
5 | Irregular | Irregular |
 |  | |
6 | “Closed ring” or “Open ring” | Irregular, with a significant shift of the posterior surface by height (> 80 μm) |
  |  |
* ≤80 μm elevation
At this stage, the dataset was optimized, that is, the nature of all parameters was investigated using correlation and regression analyses, and based on the results, uninformative features were excluded (Fig. 2). The type parameter was used solely to test the training of the neural network and was not used as an input parameter.

Fig. 2. Dataset processing scheme.
Stage III: Creation of an ANN
An ANN consists of the input, hidden, and output layers, which are sufficient for classifying an ANN. The number of neurons in the input layer was M = 12 (parameters), and the number of neurons in the output layer was 6 (classes). The number of neurons in the hidden layer was calculated using the following formula: M = 2⁄3 × N + K, where N is the number of input neurons and K is the number of output neurons. The objective of this stage was to create an ANN that would work with an input table of features. Fig. 3 presents a schematic of the ANN diagram.

Fig. 3. Diagram of the final-iteration artificial neural network.
RESULTS
During the neural network development, a simple console interface was created by automatic testing of the training using a test sample (Fig. 4). This interface was used to configure and select the optimal number of epochs. After creating the necessary modules, the cumbersome interface was replaced with a more minimalistic console output. This procedure allows for speeding up the training, reducing complexity, and improving model accuracy.

Fig. 4. Interface of the console application for working with the neural network (both the incorrect answer of the neural network and its correction are marked red).
To more objectively evaluate the effectiveness of neural network training, a model should be trained in batches, and the average performance at each training cycle (i.e., each epoch) was compared. Fig. 5 shows graphs plotted for the average training performance of neural networks before and after optimizing the dataset and excluding noninformative parameters after correlation and regression analyses. Training accelerated significantly after clearing the dataset of homogeneous variables and analyzing the regression estimates. Without the preparation stage, the same process took much longer; however, even the final version of the algorithm did not achieve high training accuracy and stability.

Fig. 5. Training performance vs. number of epochs: a, before dataset optimization; b, after dataset optimization.
The resulting prototype neural networks did not always determine the corneal deformity type, although they gradually learned to more effectively perform the classification task (Fig. 6).

Fig. 6. Gradual neural network training and further model test at reference points.
Frequent errors in PCDR types 4 and 5 are evident (Fig. 6). Because these types are the rarest in the dataset used, this may be indicative of a class imbalance problem. Although the difference between classes and errors in their identification practically disappears by the 200th epoch, errors in identifying types 4 and 5 often appear precisely during training because each new ANN is trained from a random baseline state of neurons. However, the general tendency for the majority of errors being often distributed between types 4 and 5 remains (Fig. 7).

Fig. 7. Distribution of errors in PKCD type identification.
On average, the final-iteration ANN showed 91% (11 out of 12) correct answers by the 200th epoch. However, the test sample was not quite large; as the test sample increased, training performance declined. Types 4 and 5 identification was affected by the limited available data. Reducing the sample by two records from each class leads to a 75% decrease in the mean integration rate by the 200th epoch.
DISCUSSION
The study highlights the potential of using ANNs for the diagnostic classification of surgically modified (post-RK) corneal profiles. The data obtained after 200 epochs suggest satisfactory results in the range of 75%–91% for various ratios of test and training samples. However, to reduce classification errors of PKCD types 4 and 5, a greater dataset is necessary. The classification accuracy to some extent correlates with the accuracy of calculations when constructing an ANN, as presented earlier.
For instance, M.C. Arbelaez et al. (2012) examined the effectiveness of support vector machines (SVM) in classifying keratotopographic data in patients with keratoconus. Their study demonstrated high sensitivity and specificity rates of 92.0% and 97.7%, respectively. Compared with analysis of the anterior surface alone, the inclusion of corneal thickness and its anterior and posterior surfaces would significantly improve the detection of subclinical keratoconus [15]. In the study by R. Hidalgo et al. (2016), multiparametric analysis of keratotopographic map data using SVMs demonstrated higher accuracy (i.e., greater area under the ROC curve) than monoparametric analysis (0.922 vs. 0.809). The mean sensitivity and specificity in the overall classification were 89.0% and 95.2%, respectively, and the area under the ROC curve was 0.922 [16].
Our results show that with proper training setup, input data preparation, a larger training sample, and optimal architecture, very high and stable performance in PKCD classification can be achieved. In addition, class imbalance problems must be eliminated because they may affect the quality of ANN training. Although the cross-entropy loss function used significantly minimizes this problem, PKCD types 4 and 5, as the least represented ones, are affected the most and contain the most errors.
The analysis of existing classes within a dataset with independent clustering of entries looks promising because it will eliminate the element of subjectivity in the primary division.
In addition, this study presents the results of ANN development based on an input table of features. However, the data obtained may serve as a basis for the subsequent development of an ANN that directly processes elevation display maps of the cornea.
CONCLUSION
Based on the analysis of numerical values of corneal topographic maps, an ANN that successfully classifies PKCD types with an accuracy of 91% was developed. The potential for further improvement of the training quality of this ANN has been established. Artificial intelligence algorithms may become a helpful tool for the automatic classification of patients with PKCD to ensure timely, high-quality diagnosis and determine further patient management techniques.
ADDITIONAL INFORMATION
Funding source. This study was not supported by any external sources of funding.
Competing interests. The authors declare that they have no competing interests.
Authors’ contribution. All authors made a substantial contribution to the conception of the work, acquisition, analysis, interpretation of data for the work, drafting and revising the work, final approval of the version to be published and agree to be accountable for all aspects of the work. O.I. Rozanova — development of the concept and design of the study, writing the text of the article and editing, development of methodology, head of the study; E.K. Tsyrenzhapova — conducting research, writing the text of the article and editing, literature review, preparation and collection of data, preparation of the draft of the article, conducting research, final preparation of the article for publication, statistical data processing and their interpretation; I.S. Rozanov — computer accompaniment of the study; T.N. Iurieva — conducting research, final preparation of the article for publication, statistical data processing and interpretation; A.A. Ivanov — conducting research, literature review, preparation and collection of data, preparation of a draft article.
About the authors
Ekaterina K. Tsyrenzhapova
The S. Fyodorov Eye Microsurgery Federal State Institution
Email: katyakel@mail.ru
ORCID iD: 0000-0002-6804-8268
SPIN-code: 1158-5233
MD
Russian Federation, IrkutskOlga I. Rozanova
The S. Fyodorov Eye Microsurgery Federal State Institution
Email: olgrozanova@gmail.com
ORCID iD: 0000-0003-3139-2409
SPIN-code: 6557-9123
MD, Dr. Sci. (Medicine)
Russian Federation, IrkutskTatiana N. Iureva
The S. Fyodorov Eye Microsurgery Federal State Institution; Irkutsk State Medical University; Russian Medical Academy of Continuous Professional Education
Email: tnyurieva@mail.ru
ORCID iD: 0000-0003-0547-7521
SPIN-code: 8457-5851
MD, Dr. Sci. (Medicine), Professor
Russian Federation, Irkutsk; Irkutsk; IrkutskAndrey A. Ivanov
The S. Fyodorov Eye Microsurgery Federal State Institution
Email: ivanov.andrei.med@yandex.ru
ORCID iD: 0009-0001-4235-9252
MD
Russian Federation, IrkutskIvan S. Rozanov
LLC Transneft Technology
Author for correspondence.
Email: nauka@mntk.irkutsk.ru
ORCID iD: 0009-0001-7202-0428
Russian Federation, Irkutsk
References
- Issarti I, Consejo A, Jiménez-García M, et al. Computer aided diagnosis for suspect keratoconus detection. Comput Biol Med. 2019;109:33–42. doi: 10.1016/j.compbiomed.2019.04.024
- Chen X, Zhao J, Iselin KC, et al. Keratoconus detection of changes using deep learning of colour-coded maps. BMJ Open Ophthalmol. 2021;6(1):e000824. doi: 10.1136/bmjophth-2021-000824
- Feng R, Xu Z, Zheng X, et al. KerNet: A novel deep learning approach for keratoconus and sub-clinical keratoconus detection based on raw data of the pentacam HR system. IEEE J Biomed Health Inform. 2021;25(10):3898–3910. doi: 10.1109/JBHI.2021.3079430
- Gatinel D. Screening for subclinical keratoconus and prevention of corneal ectasia with SCORE analyzer software. In: Febbraro J-L, Khan HN, Koch DD, editors. Surgical correction of astigmatism. Cham: Springer International Publishing; 2018. doi: 10.1007/978-3-319-56565-1_9
- Ruiz Hidalgo I, Rozema JJ, Saad A, et al. Validation of an objective keratoconus detection system implemented in a scheimpflug tomographer and comparison with other methods. Cornea. 2017;36(6):689–695. doi: 10.1097/ICO.0000000000001194
- Malyugin BE, Sakhnov SN, Axenova LE, Myasnikova VV. Application of artificial intelligence in diagnostics and surgery of keratoconus: a systematic overview. Fyodorov Journal of Ophthalmic Surgery. 2022;(1):77–96. EDN: PPQRWZ doi: 10.25276/0235-4160-2022-1-77-96
- Abdelmotaal H, Mostafa MM, Mostafa ANR, et al. Classification of Color-Coded Scheimpflug Camera Corneal Tomography Images Using Deep Learning. Transl Vis Sci Technol. 2020;9(13):30. doi: 10.1167/tvst.9.13.30
- Dos Santos VA, Schmetterer L, Stegmann H, et al. CorneaNet: fast segmentation of cornea OCT scans of healthy and keratoconic eyes using deep learning. Biomed Opt Express. 2019;10(2):622–641. doi: 10.1364/BOE.10.000622
- Kuo BI, Chang WY, Liao TS, et al. Keratoconus Screening Based on Deep Learning Approach of Corneal Topography. Transl Vis Sci Technol. 2020;9(2):53. doi: 10.1167/tvst.9.2.53
- Shi C, Wang M, Zhu T, et al. Machine learning helps improve diagnostic ability of subclinical keratoconus using Scheimpflug and OCT imaging modalities. Eye Vis (Lond). 2020;7:48. doi: 10.1186/s40662-020-00213-3
- Shukhaev SV, Mordovtseva EA, Pustozerov EA, Kudlakhmedov SS Application of convolutional neural networks to define Fuchs endothelial dystrophy. Fyodorov Journal of Ophthalmic Surgery. 2022;(S4):70–76. EDN: WEZTKV doi: 10.25276/0235-4160-2022-4S-70-76
- Obaid HS, Dheyab SA, Sabry SS. The impact of data pre-processing techniques and dimensionality reduction on the accuracy of machine learning. 2019 9th Annu. Inf. Technol. Electromechanical Eng. Microelectron. Conf. IEMECON. 2019:279–283. doi: 10.1109/IEMECONX.2019.8877011
- Valdés-Mas MA, Martín-Guerrero JD, Rupérez MJ, et al. A new approach based on Machine Learning for predicting corneal curvature (K1) and astigmatism in patients with keratoconus after intracorneal ring implantation. Comput Methods Programs Biomed. 2014;116:39–47. doi: 10.1016/j.cmpb.2014.04.003
- Patent RUS № RU 2793142 C1/ 29.03.2023. Rozanova OI, Tsyrenzhapova EK, Iureva TN, et al. A method of evaluating the relief of the anterior and posterior corneal surface. (In Russ).
- Arbelaez MC, Versaci F, Vestri G, et al. Use of a Support Vector Machine for Keratoconus and Subclinical Keratoconus Detection by Topographic and Tomographic Data. Ophthalmology. 2012;119(11):2231–2238. doi: 10.1016/j.ophtha.2012.06.005
- Ruiz Hidalgo I, Rodriguez P, Rozema JJ, et al. Evaluation of a Machine-Learning Classifier for Keratoconus Detection Based on Scheimpflug Tomography. Cornea. 2016;35(6):827–832. doi: 10.1097/ico.0000000000000834
Supplementary files

