


Liver function assessment based on hepatobiliary contrast agent-enhanced magnetic resonance imaging
- Authors: Ageeva S.F.1, Sinitsyn V.E.1, Mershina E.A.1, Rucheva N.A.2, Petrova E.I.3
-
Affiliations:
- Lomonosov Moscow State University
- V.I. Shumakov National Medical Research Center of Transplantology and Artificial Organs
- Industry Clinical Diagnostic Center of Gazprom PJSC
- Issue: Vol 5, No 2 (2024)
- Pages: 137-148
- Section: Original Study Articles
- Submitted: 21.12.2023
- Accepted: 06.02.2024
- Published: 20.09.2024
- URL: https://jdigitaldiagnostics.com/DD/article/view/624826
- DOI: https://doi.org/10.17816/DD624826
- ID: 624826

Cite item

Abstract
BACKGROUND: Liver function assessment is very important in clinical practice. The use of magnetic resonance imaging for the anatomical and functional evaluation of the liver is possible in actual clinical practice.
AIM: To examine the possibility of using hepatobiliary contrast-enhanced magnetic resonance imaging for the evaluation of liver function.
MATERIALS AND METHODS: Datasets of patients who underwent gadoxetic acid-enhanced magnetic resonance imaging were retrospectively reviewed. Patients were divided into two groups: group 1 included patients with impaired liver function, and group 2 included those with normal liver function. Based on magnetic resonance imaging in the hepatobiliary phase, the liver parenchyma signal intensity and its ratio to spleen signal intensity and portal vein signal intensity were estimated. Differences among these parameters were compared between groups. The correlation between liver parenchyma signal intensity and laboratory blood tests reflecting liver function (total bilirubin, albumen, aspartate aminotransferase, alanine aminotransferase, alkaline phosphatase, gamma glutamyl transpeptidase, and prothrombin time) were analyzed.
RESULTS: Datasets of 53 patients (25 men and 28 women, aged 24–84 years) were analyzed. Group 1 included 19 patients, whereas group 2 included 34. The median liver parenchyma signal intensity was 919.05 [669.65; 1258.35] in group 1 and 1525.13 [1460.5; 1631.4] in group 2 (p=0.0000001). The median ratio of liver parenchyma signal intensity to spleen signal intensity was 1.2 [1.04;1.7] in group 1 and 1.7 [1.46; 1.96] in group 2 (p=0.00076). The median ratio of liver parenchyma signal intensity to portal vein signal intensity was 1.44 [1.29; 1.83] in group 1 and 1.6 [1.43; 1.83] in group 2 (p=0.1). The estimated correlation values between liver parenchyma signal intensity and blood tests parameters were as follows: total bilirubin (r=–0.61; p=0.000001), albumen (r=0.13; p=0.61), aspartate aminotransferase (r=–0.57; p=0.000009), alanine aminotransferase (r=–0.44; p=0.001), alkaline phosphatase (r=–0.45; p=0.0007), gamma glutamyl transpeptidase (r=–0.5; p=0.0003), prothrombin time (r=–0.34; p=0.04).
CONCLUSION: The study reflects the ability to assess liver function using indices (liver parenchyma signal intensity and its ratio to spleen signal intensity) derived from gadoxetic acid-enhanced magnetic resonance imaging. However, this study did not confirm the assumed effectiveness of using the liver parenchyma signal intensity to portal vein signal intensity ratio as an index of liver function. A significant inverse correlation was identified between liver parenchyma signal intensity and blood test parameters in reflecting liver function, except for albumin. The results indicate the possibility of using magnetic resonance imaging to assess liver function.
Keywords
Full Text
BACKGROUND
The liver is a vital organ that performs several functions such as detoxification, metabolism (e.g., protein synthesis and fat and carbohydrate metabolism), and exocrine functions. Liver dysfunction can occur in several different conditions (e.g., infections, autoimmune diseases, and drug-induced injuries), and it may be asymptomatic in the early stages. Liver function should be assessed to determine the management strategy of patients with liver disease, especially when planning for surgery to avoid complications associated with post-resection liver failure. Existing laboratory tests and imaging modalities for the analysis of liver function have some advantages and disadvantages [1, 2].
Magnetic resonance imaging (MRI) with extracellular contrast enhancement is extensively used to evaluate the anatomy and characteristics of liver lesions. The development of hepatotropic contrast agents has expanded the diagnostic capabilities of the method with the introduction of a new hepato-specific phase (HSP).
Hepatobiliary-specific contrast agents include gadobenic acid (Gd-BOPTA, MultiHance; Bracco Diagnostics Inc.) and gadoxetic acid (Gd-EOB-DTPA, Eovist or Primovist; Bayer Healthcare) [3, 4]. These agents differ significantly. Approximately 5% of the administered dose of Gd-BOPTA is taken up by hepatocytes, and the HSP uptake is evaluated 1–3 h after contrast administration. When gadoxetic acid (GA) is used as a contrast agent, significantly more substance (up to 50%) enters the liver cells, and the HSP uptake is evaluated 15–25 min after contrast administration. Due to its characteristics, GA is more commonly used than Gd-BOPTA in clinical practice to evaluate HSP uptake [3].
Preliminary evidence suggests that MRI enhanced with hepatobiliary-specific contrast agents may aid in assessing liver function. The feasibility of using MRI to assess the liver anatomy and function is a relevant scientific and practical issue.
STUDY AIM
To evaluate the feasibility of the functional assessment of the liver using parameters of liver obtained from MRI enhanced with a hepatobiliary-specific contrast agent.
MATERIALS AND METHODS
Study Design
This is a retrospective, multicenter, selective study.
Eligibility Criteria
The data of patients aged ≥18 years who had undergone abdominal MRI enhanced with intravenous GA (Primovist; Bayer Healthcare) were evaluated. Laboratory blood test (complete blood count, blood biochemistry, and coagulation profile) results were also evaluated.
For subsequent statistical analysis, the patients were divided into two groups. Group 1 included patients with cirrhosis of various origins and clinical and laboratory evidence of liver dysfunction. Group 2 included patients with an intact liver parenchyma, benign liver tumors, or arteriovenous shunts without any clinical or laboratory evidence of liver dysfunction.
Study Setting
Data were collected from the following three institutions over from 2020 to 2023: Shumakov National Medical Research Center of Transplantology and Artificial Organs of the Russian Federation’s Ministry of Health, the Medical Research and Education Center of Lomonosov Moscow State University, and the Industrial Clinic and Diagnostic Center of PJSC Gazprom.
Magnetic Resonance Imaging Protocol
GA-enhanced MRIs were obtained using one of three models. The Shumakov National Medical Research Center of Transplantology and Artificial Organs used the 1.5 T Signa Voyager (GE Healthcare, USA), the Medical Research and Education Center of Lomonosov Moscow State University used the 3 T Magnetom Vida (Siemens Healthineers, Germany), and the Industrial Clinical and Diagnostic Center of PJSC Gazprom used the 1.5 T Ingenia (Philips, the Netherlands).
The contrast enhancement agent (Primovist; Bayer Healthcare, Germany) was administered intravenously at a rate of 0.025 mmol/kg of body weight. Table 1 shows the MRI protocol.
Table 1. Protocol of gadoxetic acid–enhanced magnetic resonance imaging of the liver.
Program | MRI sequence | TR, msec | TE, msec | FA, degrees | Slice thickness, mm | Number of slices |
Topography | HASTE | 2000 | 90 | 110 | 5 | 3 |
T2-WIs, transverse plane | TSE | 3000 | 90 | 140 | 5 | 20–30 |
T2-WIs with fat suppression, transverse and frontal planes | TSE | 3000 | 90 | 140 | 5 | 20–30 |
T2-WIs, transverse and frontal planes | VIBE | 9 | 4 | 10 | 3 | 25 |
T2-WIs with phase shift, transverse plane | VIBE | 9 | 2 and 5 | 10 | 3 | 25 |
DWIs (b-value, 0, 500, and 1,000), transverse plane | DWI | 6000 | 90 | – | 3 | 20 |
Т1-WIs for dynamic contrast enhancement (six phases), transverse plane | VIBE | 9 | 4 | 10 | 3 | 30 |
MR cholangiography, frontal plane | HASTE | 2500 | 110 | 130 | 3 | 35 |
T1-WIs in delayed phase, transverse plane | VIBE | 9 | 4 | 10 | 3 | 30 |
Note. WI, weighted image; MRI, magnetic resonance imaging; DWI, diffusion-weighted image; TR, repetition time; TE, echo time; FA, fractional anisotropy.
A series of T1-weighted images (WIs) of 3–6 mm slice thickness obtained before and 15–20 min after contrast administration were analyzed.
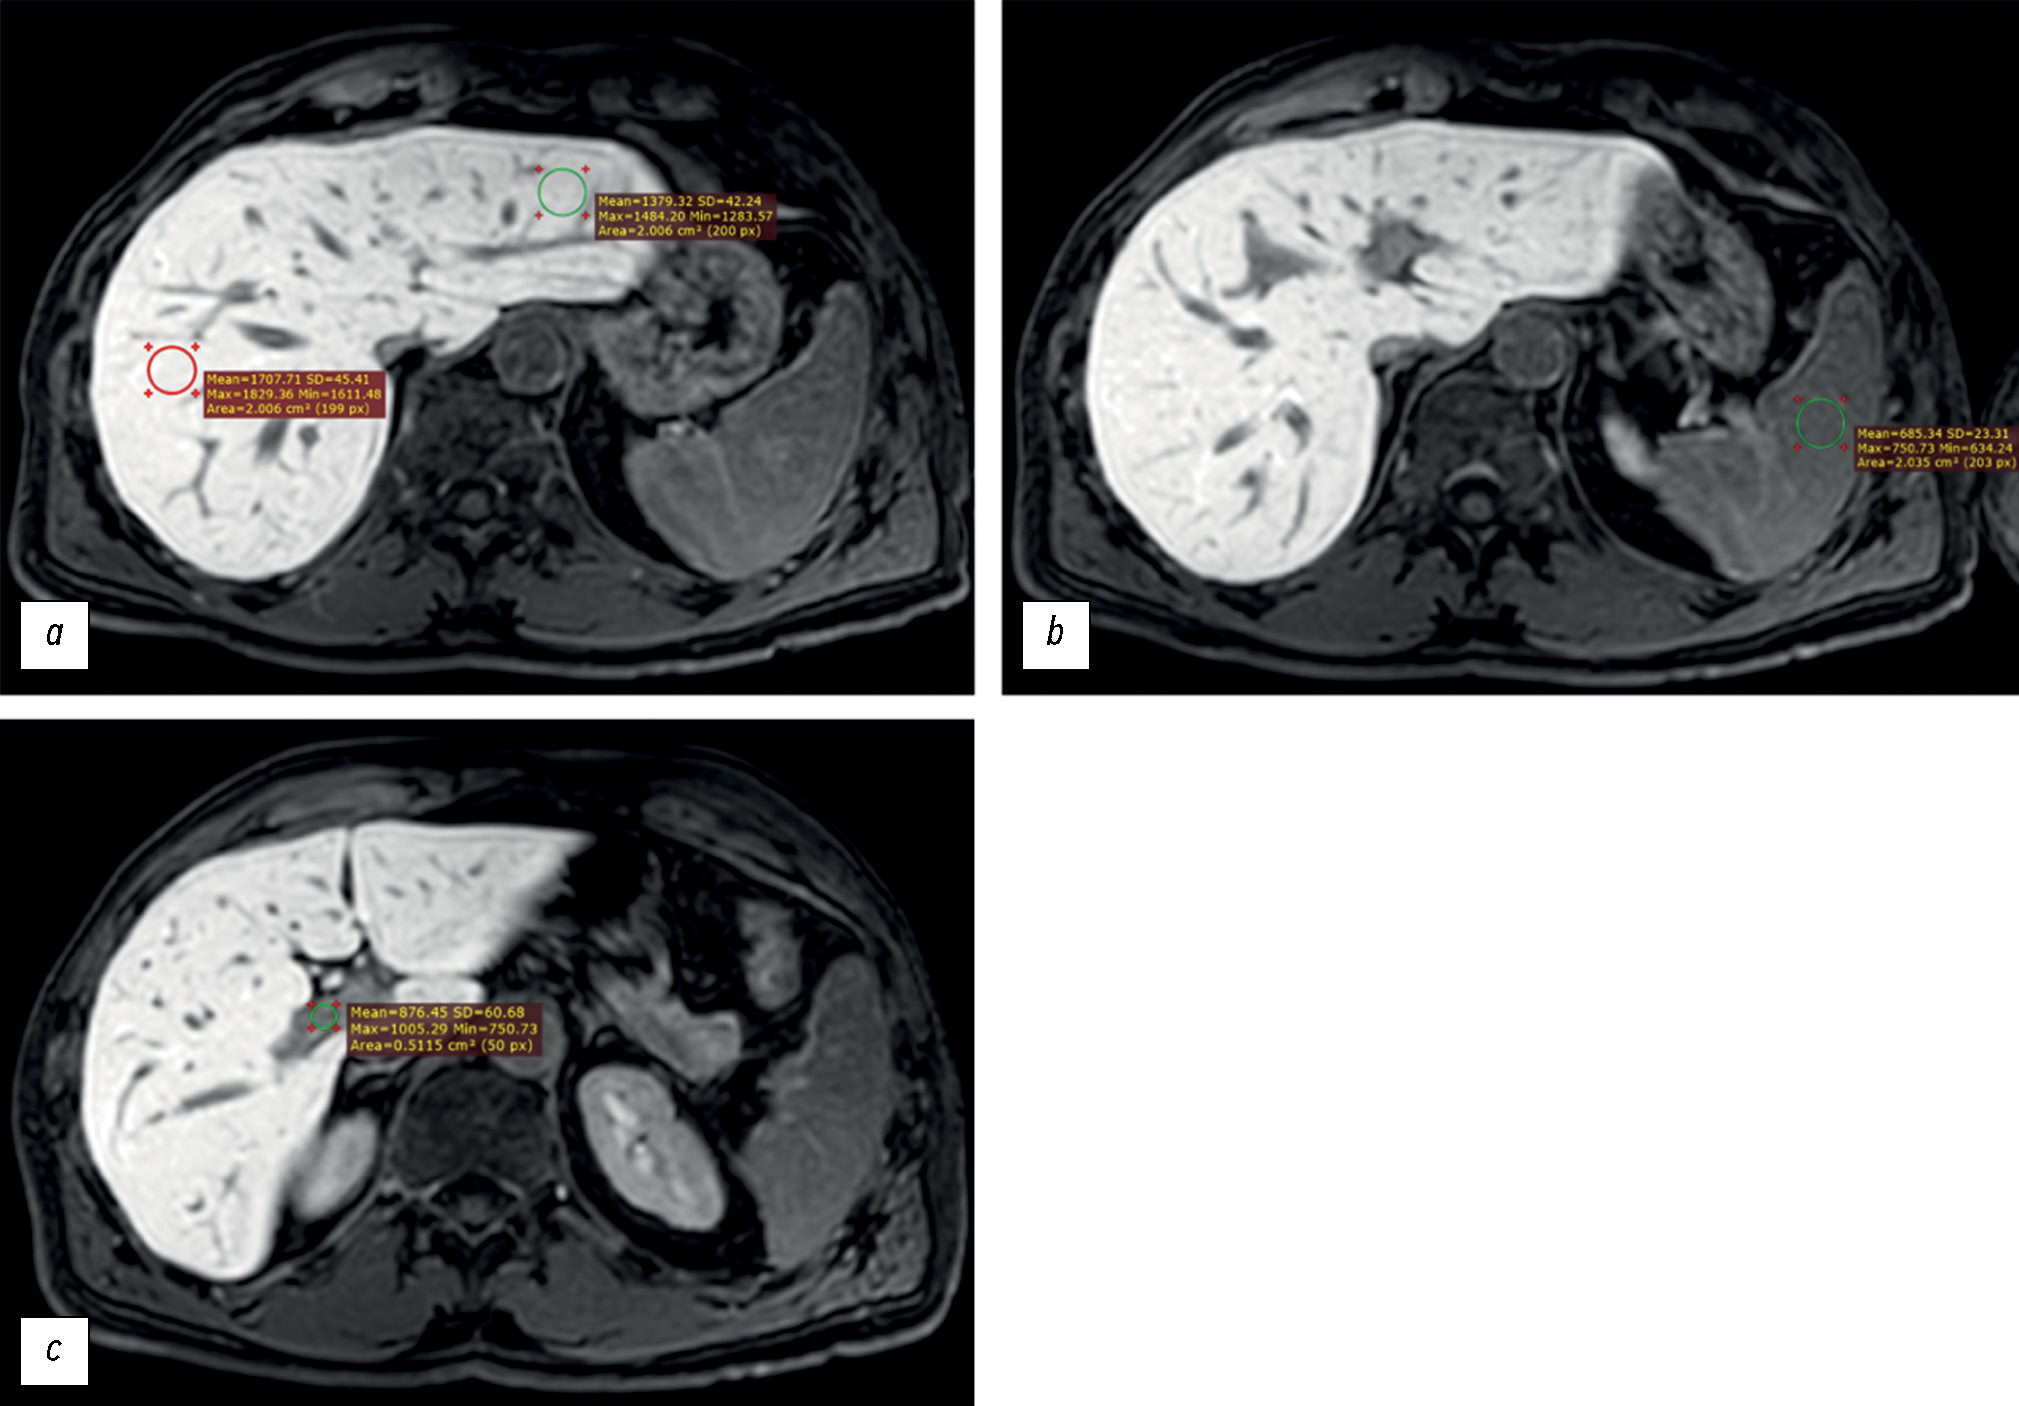
The signal intensity (in arbitrary units, au) was measured in the following regions of interest (ROIs, Fig. 1):
- Liver parenchyma (left and right lobes), outside the margins of the tumors, vessels, bile ducts and artifacts (if any) (ROI, at least 2 cm2 in diameter),
- Spleen parenchyma (ROI, at least 2 cm2 in diameter), and
- Lumen of the portal vein (ROI, at least 0.5 cm2 in diameter).

Fig. 1. Axial, T1-weighted, Gadoxetic acid–enhanced magnetic resonance imaging of the liver obtained 20 minutes after contrast administration. The signal intensity was measured in the following regions of interest: (a) right and left hepatic lobe parenchyma, (b) splenic parenchyma, and (c) portal vein lumen.
Using the GA-enhanced MRI, the following parameters were calculated:
- Liver Signal Intensity (LSI), which is the mean signal intensity (SI) of the left and right lobes of the liver: ,
- LSI to Spleen Signal Intensity (SSI) ratio: LSI/SSI, and
- LSI to Portal Vein Signal Intensity (PVSI) ratio: LSI/PVSI.
Additionally, the following laboratory blood test data obtained closest to the date of the GA-enhanced MRI were analyzed: levels of total bilirubin, albumin, alanine aminotransferase (ALT), aspartate aminotransferase (AST), gamma-glutamyl transferase (GGT), alkaline phosphatase (ALP), and prothrombin time (PT).
Statistical Analysis
STATISTICA (version 12.0; TIBCO Software, USA) was used for statistical processing of all the data. The statistical significance of the differences in LSI, LSI/SSI, LSI/PVSI between Groups 1 and 2 was evaluated using the Mann–Whitney U test. The Spearman’s rank correlation coefficient was used to determine the association between LSI and laboratory test results such as the levels of total bilirubin, albumin, AST, ALT, ALP, GGT, and PT.
RESULTS
Study Subjects
In this study, the data of 53 patients (25 men and 28 women) who underwent abdominal MRI with intravenous GA contrast enhancement were analyzed.
Group 1 included 19 patients, aged 34–71 years (mean age: 51.2 ± 9.8 years), who had liver cirrhosis of various origins (Table 2).
Table 2. Characteristics of the patients in Group 1 on the basis of the etiology of liver abnormalities
Etiology of liver abnormalities | Number of patients | Malignancy |
Hepatitis C | 8 | Four patients had histologically confirmed HCC. Two patients were diagnosed with HCC on the basis of GA-enhanced MRI; the diagnosis was not confirmed histologically |
Hepatitis B | 2 | One patient had histologically confirmed cholangiocellular carcinoma |
Alimentary origin | 2 | – |
Unspecified origin | 1 | – |
Toxic origin | 1 | – |
Nonalcoholic fatty liver disease | 1 | – |
Primary sclerosing cholangitis | 2 | – |
Budd–Chiari syndrome | 1 | – |
Wilson’s disease | 1 | – |
Note. GA, gadoxetic acid; HCC, hepatocellular carcinoma; MRI, magnetic resonance imaging.
Group 2 included 34 patients, aged 24–84 years (mean age: 57.6 ± 15.8 years), in whom the liver function was preserved (Table 3).
Table 3. Characteristics of the patients in Group 2 on the basis of the etiology of liver abnormalities
Etiology of liver abnormalities | Number of patients |
Intact liver parenchyma | 7 |
Benign hepatic tumors (liver adenomas, focal nodular hyperplasia, hemangiomas, and liver cysts) | 25 |
Arteriovenous shunts | 2 |
Primary Findings
Table 4 shows the statistical analysis of the differences in LSI, LSI/SSI, LSI/PVSI between the two groups. The LSI was statistically significantly higher in patients in Group 2 than in patients in Group 1 (P < 0.001). The LSI/SSI was also statistically significantly different between the groups; the median LSI/SSI value was significantly higher in Group 2 than in Group 1 (P < 0.001). There was no statistically significant difference in the LSI/PVSI between the groups (P > 0.05) (Fig. 2).
Table 4. Statistical differences between Groups 1 and 2
LSI | LSI/SSI | LSI/PVSI | |
Group 1 | 919.05 [669.65; 1258.35] | 1.2 [1.04; 1.7] | 1.44 [1.29; 1.83] |
Group 2 | 1525.13 [1460.5; 1631.4] | 1.7 [1.46; 1.96] | 1.6 [1.43; 1.83] |
P-value | 0.0000001 | 0.00076 | 0.1 |
Note. LSI, liver signal intensity; LSI/SSI, liver signal intensity to spleen signal intensity ratio; LSI/PVSI, liver signal intensity to portal vein signal intensity ratio.

Fig. 2. Box-and-whiskers plots of the (a) liver signal intensity, (b) liver signal intensity vs. spleen signal intensity, and (c) liver signal intensity vs. portal vein signal intensity for Groups 1 and 2. In a and b, the differences were statistically significant (P = 0.0000001 and P = 0.00076, respectively). In c, the difference was not statistically significant (P = 0.1).
Note. LSI, liver signal intensity; SSI, spleen signal intensity; PVSI, portal vein signal intensity.
The correlation analysis showed a statistically significant negative correlation between LSI and the following blood test results: total bilirubin level (r = –0.61; P = 0.000001), AST level (r = –0.57; P = 0.000009), ALT level (r = –0.44; P = 0.001), ALP level (r = –0.45; P = 0.0007), GGT level (r = –0.5; P = 0.0003), and PT (r = –0.34; P = 0.04) (Fig. 3). According to the Chaddock scale, there were significant correlations between the LSI and the total bilirubin and AST levels. Furthermore, there was a moderate correlation between the LSI and the levels of ALT, ALP, GGT, and PT.

Fig. 3. Scatter plots showing the correlation between liver signal intensity and the following parameters: (a) total bilirubin level (r = −0.61; P = 0.000001), (b) aspartate aminotransferase level (r = −0.57; P = 0.000009), (c) alanine aminotransferase level (r = −0.44; P = 0.001), (d) alkaline phosphatase level (r = −0.45; P = 0.0007); (e), gamma-glutamyl transferase level (r = −0.5; P = 0.0003), and (f) prothrombin time (r = −0.34; P = 0.04).
Note. LSI, liver signal intensity; AST, aspartate aminotransferase; ALT, alanine aminotransferase; ALP, alkaline phospatase; GGT, gamma-glutamyl transferase; PT, prothrombine time.
Because data regarding serum albumin levels in the patients in Group 2 was insufficient, the laboratory blood test results of patients in Group 1 were used in the correlation analysis. There was no statistically significant correlation between serum albumin levels and LSI (r = 0.13; P = 0.61) (Fig. 4).

Fig. 4. Scatter plot showing the correlation between liver signal intensity and serum albumin level (r = 0.13; P = 0.61).
Note. LSI, liver signal intensity.
DISCUSSION
Statistical analyses in our study revealed a significant difference in the LSI between the study groups. The high LSI in Group 2 may Be attributable to the active uptake of GA by the functional hepatocytes [5, 6]. In Group 1, the cellular uptake of the contrast agent may be attributed to the impaired liver function and decreased number of hepatocytes, resulting in a decreased signal intensity in the liver parenchymal on MRI [7, 8].
In the spleen, GA serves as an extracellular enhancing agent because the spleen cells do not contain proteins that can transport GA into the cells [9]. It has been proposed that the functional status of the liver is reflected by the LSI/ SSI ratio. In our study, there was a statistically significant difference in the LSI/SSI between the study groups, indicating that it may be an effective parameter to assess liver function.
Our finding that LSI and LSI/SSI may reflect liver function is consistent with that of previous studies. Yang et al. evaluated the laboratory test results and GA-enhanced MRI data of 120 patients with normal and impaired liver function. The following HSP parameters were evaluated: LSI, PVSI, SSI, LSI/PVSI, LSI, SSI, and PVSI/SSI. They found significant differences in the LSI, LSI/PVSI, and LSI/SSI between their study groups. Thus, they concluded that these parameters may be used to assess the liver function [9].
Bastati et al. evaluated the data of 128 patients and concluded that GA-enhanced MRI may be used to assess the liver engraftment potential in patients who have undergone orthotopic organ transplantation. The authors used a functional liver imaging score (FLIS) with the sum of three criteria (LSI, biliary excretion of GA, LSI/PVSI), each of which was scored from 0 to 2 points. Furthermore, the relative liver enhancement (RLE) was assessed using the following formula [10]:
.
Mnatsakanyan et al. compared the effectiveness of using MRI to assess the liver function in surgical candidates with that of the combined use of hepatobiliary scintigraphy (with 99mTc mebrofenin) and single-photon emission computed tomography (СТ). The MRI parameters used were future liver remnant function (FunctFLR) and the hepatocellular uptake index (HUI) in the HSP. A FLIS system was also used for the evaluation.
FunctFLR was calculated using the following formula:
,
where FLR is the future liver remnant assessed by CT- or MRI-volumetry, m is the weight of the patient, and RLE is the relative liver enhancement.
The RLE was calculated using the following formula:
,
where SIhb is the mean signal intensity of three ROIs in the HSP and SIpre is the mean signal intensity of three ROIs in the native phase.
The HUI was calculated using the following formula:
,
where VL is the volume of the liver, L20 is the mean LSI on contrast-enhanced T1-WIs with fat suppression, and S20 is the mean SSI on contrast-enhanced T1-WIs with fat suppression.
Mnatsakanyan et al. concluded that GA-enhanced MRI can be used as an alternative modality for the functional assessment of the liver when planning extensive resections [11].
Some studies have demonstrated the efficacy of the LSI/ PVSI in assessing liver function [9, 12]. Zhang et al. evaluated GA-enhanced MRIs of 92 patients with normal liver function or hepatitis B-related cirrhosis. They evaluated the following parameters: LSI/PVSI in the HSP and laboratory blood test results (total bilirubin level, albumin level, and platelet count). They found that the LSI/PVSI in the HSP was associated with the severity of functional impairment in patients with hepatitis B-related liver cirrhosis, which was consistent with their laboratory data. Thus, the authors concluded that LSI/PVSI in the HSP may be used as a biomarker of liver function [12].
However, in our study, there was no statistically significant difference in the LSI/PVSI between the study groups. This may be attributable to the significant hyperbilirubinemia reported in some patients in Group 1, particularly those with primary sclerosing cholangitis. Lee et al. demonstrated that in patients with significant hyperbilirubinemia, bilirubin competes with GA for uptake by the hepatocytes, resulting in delayed uptake and slowed GA clearance from the blood [13]. In our study, the etiology of liver cirrhosis in Group 1 was heterogeneous, and the median total bilirubin level was 43.25 [22.4–211.17] μmol/L. In some patients in Group 1, the significant hyperbilirubinemia may have affected the LSI/PVSI. However, given the small sample size, there was no statistically significant difference in the LSI/PVSI between the groups.
The correlation analysis also supports the hypothesis that MRI can be used to assess liver function, which is largely consistent with the results of the study by Yang et al. [9]. They found a statistically significant negative correlation between the LSI and the total bilirubin (r = −0.52; P < 0.001), albumin (r = 0.48; P < 0.001), AST (r = −0.5; P < 0.001), and ALT (r = −0.49; P < 0.001) levels as well as the PT (r = −0.52; P < 0.001) [9]. Contrary to the finding in the study by Yang et al., we did not observe a correlation between the LSI and the serum albumin level. This may be attributed to the small sample size. Furthermore, because serum albumin level is rarely included in the routine laboratory blood tests of patients in Group 2, the correlation analysis was performed using the data of patients in Group 1.
In our study, there was a significant correlation between the LSI and total bilirubin level (r = −0.61; P < 0.001). This specific marker has been used in some scales to assess the functional status of the liver. For example, liver dysfunction can be assessed using the Chronic Liver Failure Consortium scoring system and Sequential Organ Failure Assessment scale, which include the total bilirubin level as a criterion [14, 15]. The Asian Pacific Association for the Study of the Liver recommends that acute-on-chronic liver failure be defined on the basis of two laboratory blood parameters such as total bilirubin and international normalized ratio or prothrombin activity [15]. Therefore, the correlation obtained in our study demonstrated the potential of GA-enhanced MRI in the assessment of liver function.
Study Limitations
Insufficient data may explain the lack of correlation between the LSI and serum albumin level in our study. Thus, further studies with larger sample sizes are required. Furthermore, the heterogeneous etiology of cirrhosis in the patients in Group 1 may have resulted in the lack of a statistically significant difference in the LSI/PVSI between the study groups. Thus, further studies with larger sample sizes are required.
CONCLUSION
The correlation analysis in our study revealed statistically significant differences in MRI parameters such as LSI and LSI/ SSI between the patients with normal liver function and those with impaired liver function. The study’s findings validate the feasibility using GA-enhanced MRI for the assessment of liver function. The lack of a statistically significant difference in LSI/PVSI between the study groups may be attributed to the significant hyperbilirubinemia in some patients in Group 1.
The correlation analysis in our study also demonstrated a statistically significant negative correlation between the LSI and the total bilirubin, AST, ALT, GGT, ALP, and PT levels. These findings also support the use of GA-enhanced MRI to assess liver function. The lack of a statistically significant correlation between the serum albumin level and LSI in Group 1 may be attributable to the insufficient amount of data evaluated.
In conclusion, GA-enhanced MRI can be used for the functional assessment of the liver in addition to its main indications (diagnosis and characterization of lesions). Thus, it is a promising assessment modality that is based on the physiology of GA uptake by the hepatocytes.
ADDITIONAL INFORMATION
Funding source. This study was not supported by any external sources of funding.
Competing interests. The authors declare that they have no competing interests.
Authors’ contribution. All authors made a substantial contribution to the conception of the work, acquisition, analysis, interpretation of data for the work, drafting and revising the work, final approval of the version to be published and agree to be accountable for all aspects of the work. S.F. Ageeva — research conception and design, data acquisition, conduct of the study, literature search and processing, statistical analysis, manuscript preparation; V.E. Sinitsyn, E.A. Mershina — research conception and design, data acquisition, conduct of the study, editing and approval of the final manuscript; N.A. Rucheva, E.I. Petrova — data acquisition, advisory support.
About the authors
Sofiia F. Ageeva
Lomonosov Moscow State University
Author for correspondence.
Email: son.ageeva13@gmail.com
ORCID iD: 0009-0003-9563-6756
SPIN-code: 9695-3717
Russian Federation, Moscow
Valentin E. Sinitsyn
Lomonosov Moscow State University
Email: vsini@mail.ru
ORCID iD: 0000-0002-5649-2193
SPIN-code: 8449-6590
MD, Dr. Sci. (Medicine), Professor
Russian Federation, MoscowElena A. Mershina
Lomonosov Moscow State University
Email: elena_mershina@mail.ru
ORCID iD: 0000-0002-1266-4926
SPIN-code: 6897-9641
MD, Cand. Sci. (Medicine)
Russian Federation, MoscowNatalia A. Rucheva
V.I. Shumakov National Medical Research Center of Transplantology and Artificial Organs
Email: rna1969@yandex.ru
ORCID iD: 0000-0002-8063-4462
SPIN-code: 2196-8300
MD, Cand. Sci. (Medicine)
Russian Federation, MoscowEkaterina I. Petrova
Industry Clinical Diagnostic Center of Gazprom PJSC
Email: doc_mri@mail.ru
ORCID iD: 0009-0005-0355-8098
MD, Cand. Sci. (Medicine)
Russian Federation, MoscowReferences
- Peng Y, Qi X, Guo X. Child–Pugh Versus MELD Score for the Assessment of Prognosis in Liver Cirrhosis. Medicine. 2016;95(8):e2877. doi: 10.1097/MD.0000000000002877
- Likar YuN, Akhaladze DG, Rumyantsev AG. Hepatobiliary scintigraphy in the preoperative assessment of the future remnant liver function (literature review and own examples). The Russian Journal of Pediatric Hematology аnd Oncology. 2020;7(1):62–69. EDN: VWDZUW doi: 10.21682/2311-1267-2020-7-1-62-69
- Chernyak V, Fowler KJ, Heiken JP, Sirlin CB. Use of gadoxetate disodium in patients with chronic liver disease and its implications for liver imaging reporting and data system (LI-RADS). Journal of Magnetic Resonance Imaging. 2019;49(5):1236–1252. doi: 10.1002/jmri.26540
- Welle CL, Guglielmo FF, Venkatesh SK. MRI of the liver: choosing the right contrast agent. Abdominal Radiology. 2020;45(2):384–392. doi: 10.1007/s00261-019-02162-5
- Furlan A, Borhani AA, Heller MT, Yu RK, Tublin ME. Non-focal liver signal abnormalities on hepatobiliary phase of gadoxetate disodium-enhanced MR imaging: a review and differential diagnosis. Abdominal Radiology. 2016;41(7):1399–1410. doi: 10.1007/s00261-016-0685-z
- Cho SH, Kang UR, Kim JD, Han YS, Choi DL. The value of gadoxetate disodium-enhanced MR imaging for predicting posthepatectomy liver failure after major hepatic resection: A preliminary study. Eur J Radiol. 2011;80(2):e195–e200. doi: 10.1016/j.ejrad.2011.08.008
- Collettini F, Elkilany A, Seta MD, et al. MR imaging of hepatocellular carcinoma: prospective intraindividual head-to-head comparison of the contrast agents gadoxetic acid and gadoteric acid. Sci Rep. 2022;12(1):18583. doi: 10.1038/s41598-022-23397-1
- Galle PR, Forner A, Llovet JM, et al. EASL Clinical Practice Guidelines: Management of hepatocellular carcinoma. J Hepatol. 2018;69(1):182–236. doi: 10.1016/j.jhep.2018.03.019
- Yang M, Zhang Y, Zhao W, et al. Evaluation of liver function using liver parenchyma, spleen and portal vein signal intensities during the hepatobiliary phase in Gd-EOB-DTPA-enhanced MRI. BMC Med Imaging. 2020;20(1):119. doi: 10.1186/s12880-020-00519-7
- Bastati N, Wibmer A, Tamandl D, et al. Assessment of Orthotopic Liver Transplant Graft Survival on Gadoxetic Acid–Enhanced Magnetic Resonance Imaging Using Qualitative and Quantitative Parameters. Invest Radiol. 2016;51(11):728–734. doi: 10.1097/RLI.0000000000000286
- Mnatsakanyan MK, Rubtsova NA, Kabanov DO, et al. The role of magnetic resonance imaging with gadoxetic acid in the assessment of the functional reserve of the liver. Russian Electronic Journal of Radiology. 2022;12(1):43–55. EDN: GXFGZS doi: 10.21569/2222-7415-2022-12-1-43-55
- Zhang W, Wang X, Miao Y, Hu C, Zhao W. Liver function correlates with liver-to-portal vein contrast ratio during the hepatobiliary phase with Gd-EOB-DTPA-enhanced MR at 3 Tesla. Abdominal Radiology. 2018;43(9):2262–2269. doi: 10.1007/s00261-018-1462-y
- Lee NK, Kim S, Kim GH, et al. Significance of the “Delayed hyperintense portal vein sign” in the hepatobiliary phase MRI obtained with Gd-EOB-DTPA. Journal of Magnetic Resonance Imaging. 2012;36(3):678–685. doi: 10.1002/jmri.23700
- Vincent JL, Moreno R, Takala J, et al. The SOFA (Sepsis-related Organ Failure Assessment) score to describe organ dysfunction/failure. Intensive Care Med. 1996;22(7):707–710. doi: 10.1007/BF01709751
- Zaccherini G, Weiss E, Moreau R. Acute-on-chronic liver failure: Definitions, pathophysiology and principles of treatment. JHEP Reports. 2021;3(1):100176. doi: 10.1016/j.jhepr.2020.100176
Supplementary files

