


Radiomics in application to diseases of the musculoskeletal system: a review
- Authors: Pleshkov M.O.1, Zamyshevskaya M.A.1, Kuchinskii E.V.1, Jin X.2, Zhang J.2, Zavadovskaya V.D.1, Zorkaltsev M.A.1, Kim T.V.1, Pogonchenkova D.A.1, Udodov V.D.1, Tolmachev I.V.1
-
Affiliations:
- Siberian State Medical University
- 1st Affiliated Hospital of Wenzhou Medical University
- Issue: Vol 6, No 1 (2025)
- Pages: 78-96
- Section: Reviews
- Submitted: 01.07.2024
- Accepted: 24.10.2024
- Published: 25.03.2025
- URL: https://jdigitaldiagnostics.com/DD/article/view/633978
- DOI: https://doi.org/10.17816/DD633978
- ID: 633978

Cite item
Full Text

Abstract
Radiomics is a technique used to extract numerous quantitative features from digital medical images. A decade ago, this method was applied in oncology, but now it has expanded to non-oncological diseases, particularly those affecting the musculoskeletal system and connective tissues. This article provides an overview of the current advances in radiomics for diagnosing diseases of the musculoskeletal system.
In this review, we assessed 37 original research papers published in English between 2020 and 2023. The most commonly used imaging modalities were magnetic resonance imaging (54%) and computed tomography (32%), while dual-energy X-ray absorptiometry (14%), ultrasound (5%), and radiographs (5%) were less frequently used. The majority of the studies apply manual segmentation to identify the regions of interest. Various classification models have been developed that incorporate clinical, radiomics, and deep features, with combined clinical-radiomics models being the most prevalent one. The most commonly affected areas in diseases of the musculoskeletal system were the spine and large joints.
The prevalence of the multi-source input models (primarily clinical-radiomics) compared to that of single-source input models (clinical only, radiomics only) for diagnosing diseases of the musculoskeletal system can be explained by the higher classification performance, likely due to the inclusion of a larger number of independent information sources. Although the development of models or deep-learning features for automatic segmentation and classification holds promise, it requires significant efforts in creating image databases for deep model training. Thus, radiomics may be particularly beneficial for the early detection of diseases of the musculoskeletal system that cause pathological changes in the soft tissues, which may not be visible to the naked eye.
Full Text
ВВЕДЕНИЕ
Медицинская визуализация — ключевой инструмент в клинической практике, с помощью которого врачи могут принимать информированные медицинские решения. Существует множество методов визуализации, которые различают по уровню сложности, разрешающей способности и стоимости, а именно: ультразвуковое исследование (УЗИ), обзорная рентгенография, компьютерная томография (КТ), позитронно-эмиссионная томография (ПЭТ) и магнитно-резонансная томография (МРТ) [1].
При обработке медицинских изображений принято вручную извлекать качественные визуальные данные, включая форму, размер и интенсивность области интереса. Тем не менее такой подход может привести к поздней или неполной диагностике, поскольку видимые патологические изменения нередко наблюдают только на поздних стадиях заболеваний [2]. Кроме того, изображения могут демонстрировать изменения, характерные одновременно для разных патологических процессов [3]. Таким образом, для своевременной постановки диагноза необходимо выделить определённые количественные признаки радиологических изображений с целью надлежащей интерпретации полученных данных [4]. Результативность этого этапа можно существенно повысить с помощью радиомики.
Радиомика предусматривает извлечение большого объёма количественных характеристик (радиомиксных признаков) из медицинских изображений с помощью математических алгоритмов. Радиомика позволяет выявить характеристики изображений, которые в иных обстоятельствах, например при оценке невооружённым глазом, невозможно заметить, что обусловливает увеличение объёма информации, которую можно извлечь из каждого медицинского изображения [5]. Изначально радиомику использовали с целью дифференциальной диагностики опухолей различных локализаций [6]. Неоднородность микроструктуры опухолей и их микросреды имеет большое значение для прогнозирования течения заболевания, планирования лечения и оценки ответа на него. Таким образом, радиомика позволяет персонализировать медицинскую помощь посредством извлечения полезной информации из медицинских изображений [7]. Кроме того, данные радиомики потенциально можно использовать при разработке лекарственных средств и оценке эффективности лечения для более быстрой, простой и точной диагностики и принятия клинических решений, а также для наблюдения за течением заболевания.
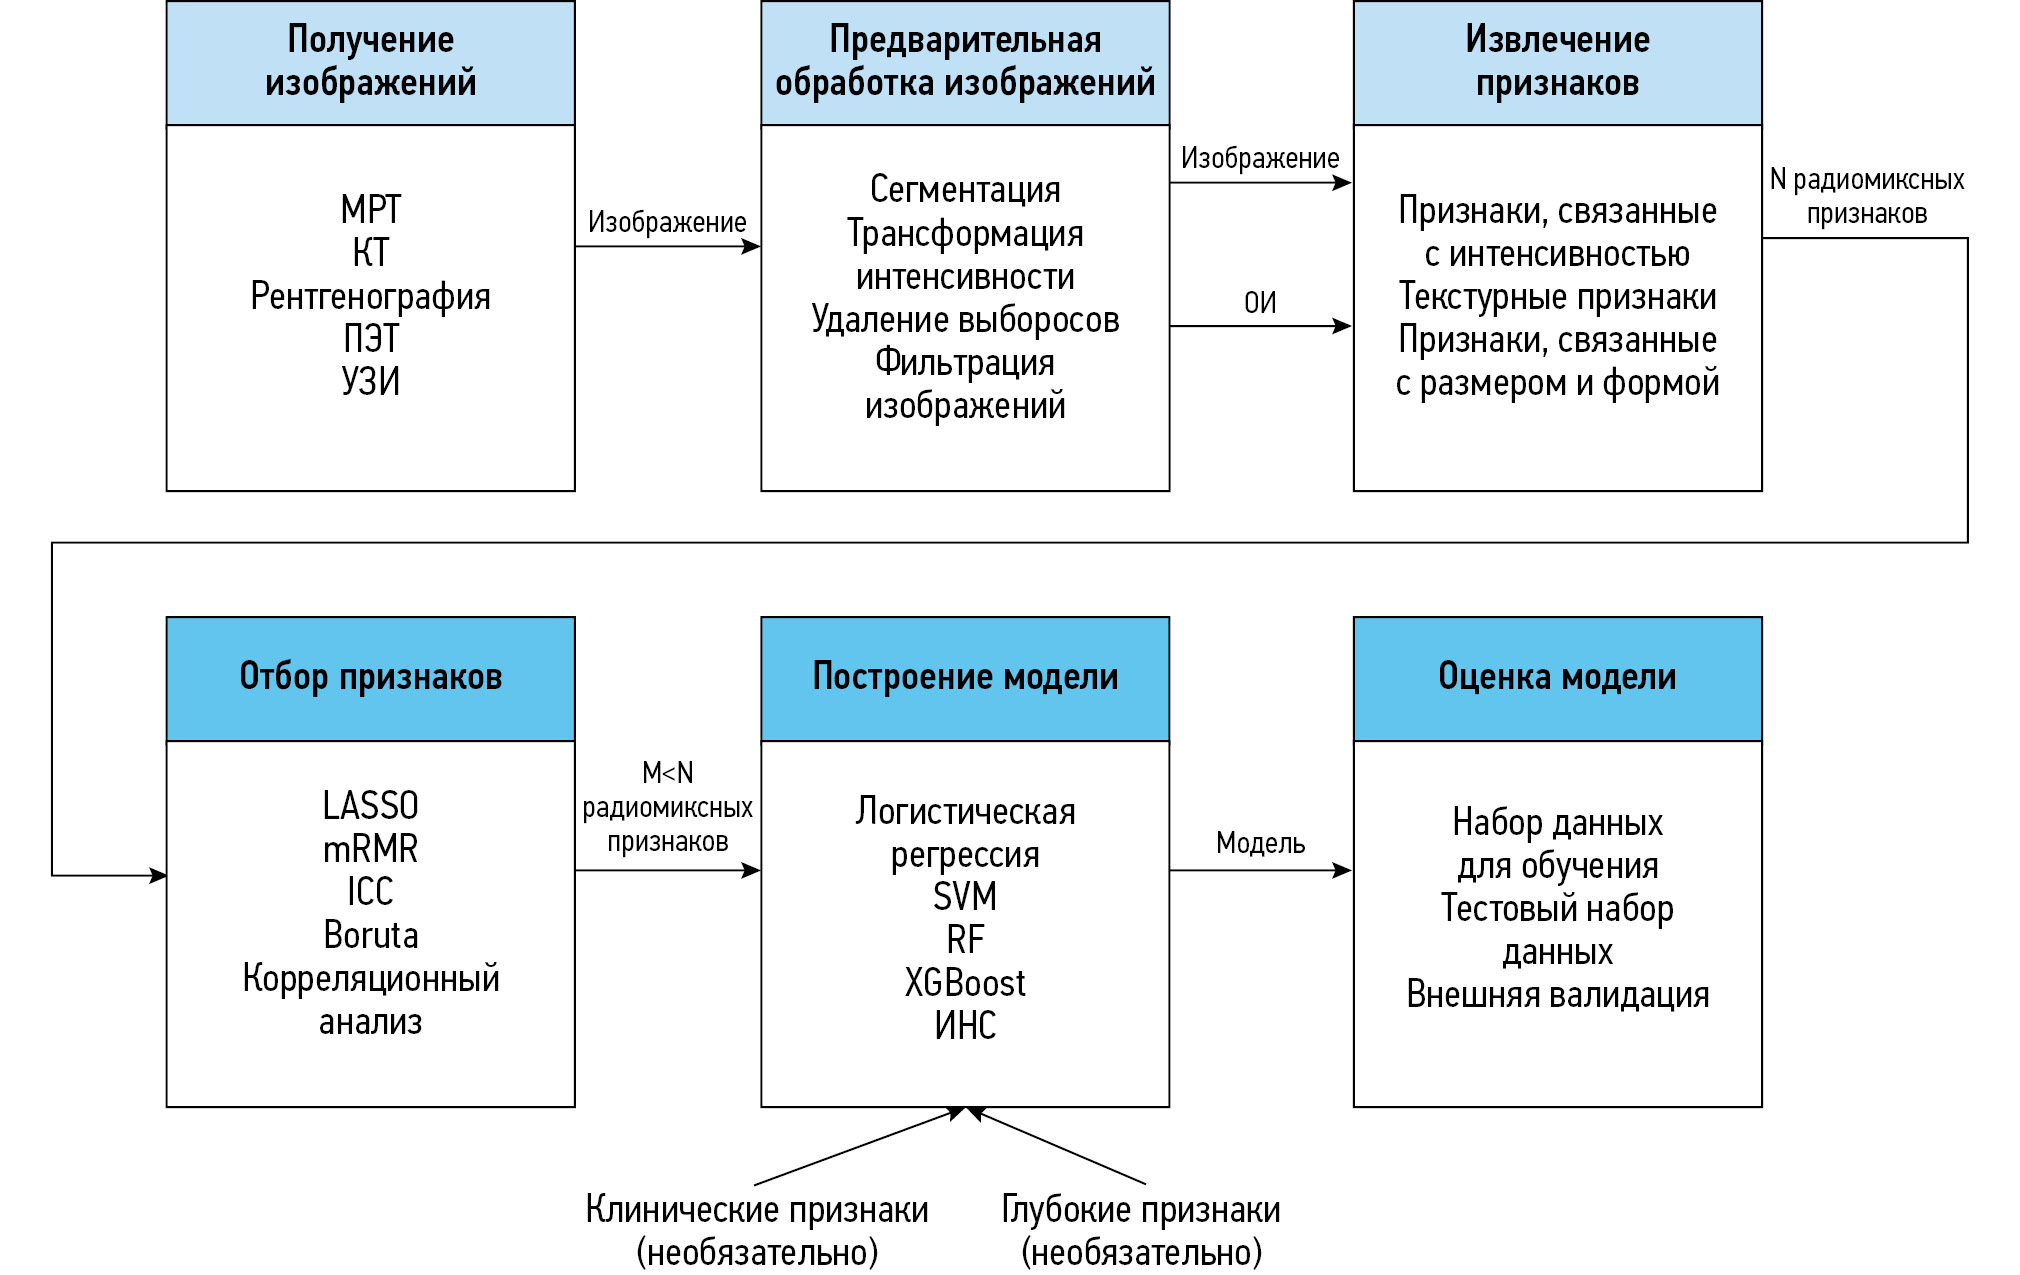
В процессе радиомиксного анализа разрабатывают классификационную модель для выявления патологии на основе сравнительно небольшого числа радиомиксных признаков, извлечённых из медицинских изображений. Радиомиксный анализ включает несколько этапов, а именно:
- получение и предварительную обработку изображений;
- отбор областей интереса;
- извлечение радиомиксных признаков;
- отбор значимых радиомиксных признаков;
- построение и валидацию классификационной модели (рис. 1) [8, 9].

Рис. 1. Этапы радиомиксного анализа. МРТ — магнитно-резонансная томография; КТ — компьютерная томография; ПЭТ — позитронно-эмиссионная томография; УЗИ — ультразвуковое исследование; ОИ — объём интереса; LASSO (Least Absolute Shrinkage and Selection Operator) — оператор наименьшего абсолютного сокращения и выбора; mRMR (Minimum Redundancy Maximum Relevance) — минимум избыточности и максимум значимости; ICC (Interclass Correlation Coefficient) — коэффициент межклассовой корреляции; SVM (Support Vector Machine) — метод опорных векторов; RF (Random Forest) — метод «случайного леса»; XGBoost (eXtreme Gradient Boosting) — экстремальный градиентный бустинг; ИНС — искусственная нейронная сеть.
Число извлекаемых радиомиксных признаков может превышать тысячу, поэтому для их анализа применяют алгоритмы машинного обучения (МО). Результаты разработки методов МО для анализа радиомиксных признаков обнадёживают, особенно в отношении раннего выявления патологии и прогнозирования течения заболевания [2]. Одну из подгрупп методов МО, глубокое обучение, успешно применяют для автоматической сегментации изображений (например, свёрточные нейронные сети, такие как U-net и W-net), а также для построения классификационных моделей на базе глубоких нейронных сетей [10, 11]. Тем не менее, согласно данным некоторых исследований, модели на основе глубоких признаков (предварительно обученные модели) не всегда оказываются результативнее моделей, основанных на аналитически установленных (радиомиксных) признаках [12].
Несмотря на то что радиомику изначально использовали только в онкологии, сейчас её применяют для изучения и диагностики широкого спектра неонкологических патологических процессов, а именно: заболеваний сердечно-сосудистой, нервной и дыхательной систем, желудочно-кишечного тракта и печени [13]. В последние годы опубликовано несколько статей, описывающих возможности применения радиомики в диагностике заболеваний костно-мышечной системы. Важное значение этот метод имеет для выявления заболеваний нетравматического генеза, поскольку не всегда возможно выявить их с помощью стандартных методов визуализации на ранних стадиях, когда изменения в биологических тканях ещё не заметны невооружённым глазом [14]. Радиомика позволяет решить эту задачу посредством быстрой, точной и неинвазивной диагностики патологии на ранних стадиях [7]. При её внедрении в клиническую практику с целью ранней диагностики возможно улучшить качество жизни и снизить социально-экономическую нагрузку на общество [15]. Таким образом, результаты, уже достигнутые в области радиомики, целесообразно рассмотреть с точки зрения вероятного применения в научных и практических целях.
В настоящей статье представлен обзор недавно проведённых исследований по оценке возможностей практического применения радиомики в диагностике неонкологических и нетравматических заболеваний костно-мышечной системы и соединительной ткани.
Алгоритм отбора публикаций
Поиск с использованием поисковой системы PubMed проведён 03.04.2023 с учётом следующих параметров:
- поиск по заголовкам и аннотациям;
- ключевое слово — «radiomics»;
- исключение терминов — «oncology», «сancer», «carcinoma», «glioma», «metastases», «tumor»;
- язык публикаций — английский.
Поле запроса в поисковой системе PubMed: (((((((radiomics[Title/Abstract]) AND (English[Language])) NOT (Oncology[Title/Abstract])) NOT (Cancer[Title/Abstract])) NOT (Carcinoma[Title/Abstract])) NOT (Glioma[Title/Abstract])) NOT (Metastases[Title/Abstract])) NOT (Tumor[Title/Abstract]).
В результате поиска выявлены полные библиографические записи 1564 статей с информацией по следующим полям:
- PMID (PubMed Identifier — уникальный идентификационный номер);
- заголовок;
- авторы;
- ссылка для цитирования;
- первый автор;
- журнал/том;
- год публикации;
- дата создания;
- PMCID (PubMed Central IDentifier — идентификатор PubMed Central);
- NIHMS ID (National Institutes of Health Manuscript Submission Identifier);
- DOI (Digital Object Identifier — цифровой идентификатор объекта).
Вся доступная информация сохранена в файле текстового формата для отображения табличных данных (CSV — Comma-Separated Values) с целью последующего анализа.
Затем по соглашению трёх авторов (М.О. Плешков, Е.В. Кучинский, Т.В. Ким) каждую статью классифицировали по заголовку и аннотации в соответствии с кодом Международной классификации болезней 10-го пересмотра (МКБ-10) с учётом исследуемого заболевания. Метод «снежного кома» для создания выборки не применяли. Сформировано в общей сложности 29 групп, из которых 26 назвали буквами латинского алфавита (A–Z), обозначающими категорию заболевания в соответствии с МКБ-10. В группу «Общая тематика» включены публикации, описывающие не какие-либо конкретные заболевания, а методологию и алгоритмы радиомики в целом. В группу «Обзоры» включены обзорные статьи, а в группу «Другое» — публикации, которые невозможно отнести к какой-либо из перечисленных выше групп, — статьи об исследованиях в ветеринарии. Таким образом, отобрано 37 статей, отнесённых к категории M по МКБ-10 «Болезни костно-мышечной системы и соединительной ткани», 30 из которых посвящены ретроспективным исследованиям с объёмом выборки от 36 до 7906 участников, а остальные 7 — проспективные, они проведены с участием от 25 до 731 человек.
ПРИМЕНЕНИЕ РАДИОМИКИ В ДИАГНОСТИКЕ ЗАБОЛЕВАНИЙ КОСТНО-МЫШЕЧНОЙ СИСТЕМЫ И СОЕДИНИТЕЛЬНОЙ ТКАНИ
В последние несколько лет публикуют всё больше исследований о применении радиомики с целью выявления неонкологических заболеваний различных локализаций [13]. Так, её используют для выявления и оценки заболеваний позвоночника и крупных суставов (коленного, крестцово-подвздошного и тазобедренного), реже — области височно-нижнечелюстного сустава (ВНЧС), сухожилия плечевого сустава, ахиллова сухожилия и икроножной мышцы. Для обследования предплечий, кистей рук и шейного отдела позвоночника радиомиксный анализ пока не применяли (рис. 2). Наиболее часто анализ проводится с целью оценки минеральной плотности костной ткани (МПКТ), а также диагностики таких заболеваний, как артрит и спондилит (табл. 1).

Рис. 2. Области применения радиомики при заболеваниях костно-мышечной системы и соединительной ткани с указанием соответствующих публикаций.
Таблица 1. Области клинического применения радиомики с целью диагностики болезней костно-мышечной системы неонкологического профиля
Условия | Области применения | Используемые методы и число их применений, n (%) | Источник |
Снижение минеральной плотности костной ткани / остеопороз, n=17 | · диагностика, прогнозирование и классификация показателей МПКТ; · прогнозирование остаточной боли в спине после аугментации позвонков; · выявление переломов позвонков | · КТ, 12 (71); · ДРА, 5 (29); · МРТ, 4 (24); · рентгенография, 1 (6) | |
Остеоартроз, n=6 | · выявление остеоартроза коленного сустава | · МРТ, 5; · рентгенография, 1 | |
Спондилоартрит и спондилит, n=4 | · выявление отёка костного мозга; · диагностика болей в пояснице; · сакроилиит — выявление воспалительной активности; · дифференциальная диагностика туберкулёзного и гнойного спондилита | · МРТ, 4 (100) | |
Заболевания ВНЧС, n=3 | · оценка стадии переднего смещения диска; · диагностика поражений латеральной крыловидной мышцы у пациентов с ревматоидным артритом и без него; · прогнозирование течения повреждения ВНЧС при ювенильном идиопатическом артрите | · МРТ, 3 (100) | [58–60] |
Заболевания мышц и сухожилий, n=3 | · выявление тендинопатии ахиллова сухожилия; · субакромиальный импинджмент-синдром плечевого сустава; · диагностика плече-лопаточно-лицевой мышечной дистрофии | · МРТ, 1 (33); · УЗИ, 2 (67) | |
Другое, n=3 | · диагностика межпозвонковой грыжи поясничного отдела; · диагностика болей в пояснице; · диагностика спондилогенной миелопатии | · МРТ, 3 (100) | |
Примечание. КТ — компьютерная томография; МРТ — магнитно-резонансная томография; ДРА — двухэнергетическая рентгеновская абсорбциометрия; ВНЧС — височно-нижнечелюстной сустав; УЗИ — ультразвуковое исследование; МПКТ — минеральная плотность костной ткани. | |||
Ручную сегментацию изображений проводили в ходе всех работ, за исключением 8 исследований: 2 — применяли полуавтоматические средства сегментации [16, 17]; 6 — автоматические средства сегментации на базе свёрточных нейронных сетей (U-net), панелей инструментов и атласов (рис. 3, a) [18–23].
С целью упрощения модели, предотвращения её переобучения, ускорения обучения и повышения качества интерпретации результатов с помощью итоговой модели использованы методы уменьшения размерности данных. В результате число прогностических параметров уменьшается с тысячи до десятка. Настоящий обзор не предусматривает подробное описание использованных алгоритмов. Ниже представлена классификация методов, применяемых в рассматриваемой литературе.
Методы уменьшения размерности
- Статистические критерии:
- t-критерий Стьюдента;
- U-критерий Манна–Уитни;
- критерий Уилкоксона.
- Отбор признаков.
- Вложенные методы:
- логистическая регрессия;
- оператор наименьшего абсолютного сокращения и выбора (LASSO);
- метод эластичной сети (Elastic Net).
- Методы фильтрации:
- минимум избыточности и максимум значимости (mRMR);
- коэффициент межклассовой корреляции (ICC);
- коэффициенты корреляции Спирмена и Пирсона.
- Обёрточные методы:
- Boruta;
- рекурсивное исключение признаков (RFE).
- Проецирование признаков:
- анализ по методу главных компонент (PCA).
- Вложенные методы:
В рассматриваемых публикациях наиболее часто применяли LASSO-регрессию (22 из 37), используя регуляризацию L1 для отбора значимых признаков (см. рис. 3, b).
Выбор классификационной модели в значительной степени зависит от таких условий, как вид и количество данных, возможность интерпретации и степень сложности модели. Преимущественно используют следующие классификационные модели:
- логистическая регрессия;
- метод опорных векторов;
- искусственные нейросети;
- метод k-ближайших соседей (см. рис. 3, c).

Рис. 3. Методы радиомики: a — распределение типов сегментации, использованных в рассматриваемой литературе; b — наиболее часто используемые методы уменьшения размерности (группа t-критерия включает его непараметрические аналоги: критерий Уилкоксона и U-критерий Манна–Уитни). LASSO (Least Absolute Shrinkage and Selection Operator) — оператор наименьшего абсолютного сокращения и выбора; mRMR (Minimum Redundancy Maximum Relevance) — минимум избыточности и максимум значимости; ICC (Intraclass Correlation Coefficient) — коэффициент межклассовой корреляции; Сorr coef — коэффициент корреляции (Пирсона или Спирмена); Log regr — логистическая регрессия; RFE (Recursive Feature Elimination) — рекурсивное исключение признаков; PCA (Principal Component Analysis) — анализ по методу главных компонент; c — наиболее часто используемые классификаторы. LR — логистическая регрессия, включая Rad-score и Elastic Net; SVM (Support Vector Machine) — метод опорных векторов; ANN (Artificial Neural Networks) — искусственная нейросеть; KNN (K-Nearest Neighbors) — метод k-ближайших соседей; d — наиболее часто используемые последовательности. МРТ — магнитно-резонансная томография; STIR (Short Tau Inversion Recovery) — последовательность инверсия–восстановление спинового эха; SPAIR (Spectral Attenuated Inversion Recovery) — предварительное спектральное насыщение с инверсией–восстановлением; PD (Proton Density) — взвешенные по протонной плотности.
Логистическая регрессия — один из самых простых бинарных классификаторов, который используют чаще других. В данном обзоре мы рассматривали радиомиксный индекс (radiomics score, Rad-score) и логистическую регрессию как единое целое, поскольку Rad-score, как правило, рассчитывают на основании остаточных регрессионных коэффициентов M после отбора признаков (см. рис. 1):
, (1)
где b0 — свободный член, bi — i-й регрессионный коэффициент, xi — i-й отобранный признак.
В качестве основных методов визуализации использовали КТ и МРТ, а при измерении МПКТ дополнительно использовали двухэнергетическую рентгеновскую абсорбциометрию (ДРА). Реже проводили УЗИ и рентгенографию. При проведении МРТ преимущественно использовали T2- и T1-последовательности, реже — STIR (Short Tau Inversion Recovery — инверсия–восстановление спинового эха), SPAIR (Spectral Attenuated Inversion Recovery — предварительное спектральное насыщение с инверсией–восстановлением) и PD (Proton Density — взвешенные по протонной плотности) (см. рис. 3, d). Её выполняли в основном с целью визуализации патологических процессов мышц, сухожилий и суставов.
В рассматриваемых ниже исследованиях представлены разные виды прогностических моделей:
- клинические;
- радиомиксные;
- глубокие;
- клинико-радиомиксные;
- радиомиксно-глубокие;
- клинико-радиомиксно-глубокие (рис. 4, a).
Основное различие между ними заключено в происхождении используемых в них признаков (прогностических параметров). Так, клиническая модель основана на демографических параметрах, таких как возраст, пол и масса тела, и (или) на результатах клинического обследования, например показателях МПКТ, активности щелочной фосфатазы и концентрации гомоцистеина. Для создания радиомиксных моделей такие признаки, как интенсивность, форма и текстура, извлекают из изображения с помощью специально разработанных математических алгоритмов. Глубокие модели включают в себя признаки, извлечённые из изображения с помощью искусственных нейронных сетей. В свою очередь, смешанные модели представляют собой различные комбинации указанных выше типов. Чаще всего применяли радиомиксные и клинико-радиомиксные модели (см. рис. 4, b). Выявлено около 20 исследований с их использованием. Реже применяли модели на основе глубоких признаков. Нейросети в той или иной степени использовали в разработке моделей только в 6 исследованиях.

Рис. 4. Разные источники входных данных для классификационных моделей (a) и их типы с указанием частоты использования (b).
Для подтверждения результативности модели учитывают, как правило, такой показатель, как площадь под кривой рабочей характеристики приёмника (AUC), которая при значении 0,5 указывает на абсолютно случайный характер предположения (шанс 50/50), а при значении 1 — на идеальную классификацию. Кроме того, приемлемым считают значение AUC >0,8, а превосходным — >0,9 [24].
ПАТОЛОГИЧЕСКИЕ НЕОНКОЛОГИЧЕСКИЕ ИЗМЕНЕНИЯ В ОБЛАСТИ ПОЗВОНОЧНИКА И КРЕСТЦОВО-ПОДВЗДОШНЫХ СУСТАВОВ
Снижение минеральной плотности костной ткани
Снижение МПКТ является одной из характеристик остеопороза. Для измерения показателя МПКТ осевого скелета, особенно в области позвонков и бедренной кости, преимущественно применяют ДРА [25]. Q. Yao и соавт. [26] разработали и валидировали радиомиксную номограмму для диагностики снижения МПКТ на основе изображений позвонков ThXI–LII, полученных с помощью двухэнергетической спектральной КТ с подавлением сигнала от жира и воды. Значение AUC для неё составило 0,98. H. Dai и соавт. [27] описали радиомиксную модель, созданную с помощью признаков, извлечённых из изображений КТ органов брюшной полости, для прогнозирования изменений МПКТ в поясничных позвонках. Таким образом, можно сделать вывод о перспективах применения метода радиомики для классификации заболеваний, сопровождающихся снижением МПКТ, на основании признаков, извлечённых из изображений ДРА. Так, S. Rastegar и соавт. [28] разработали радиомиксные прогностические модели для классификации пациентов с остеопорозом или остеопенией и здоровых добровольцев на основании изображений ДРА позвонков LI–IV и трёх областей бедренной кости. Модель для выявления остеопороза в области большого вертела бедренной кости обладала наибольшим значением AUC — 0,78. Кроме того, авторы выявили по одному из наиболее значимых радиомиксных признаков для каждой модели:
- норма или остеопороз;
- норма или остеопения;
- норма или остеопороз/остеопения;
- остеопения или остеопороз.
Остеопороз и остеопоротические переломы
Остеопороз — это процесс, характеризующийся снижением минеральной плотности костей, нарушением их микроархитектоники и усилением хрупкости по причине нарушения метаболизма костной ткани с преобладанием катаболизма над процессами костеобразования, снижением прочности кости. Он может привести к развитию таких осложнений, как переломы (например, позвонков, проксимального отдела бедренной и дистального отдела лучевой кости), поэтому для своевременного лечения необходимо регулярное обследование на наличие признаков этого заболевания. Однако зачастую остеопороз не сопровождается какими-либо симптомами или болевыми ощущениями вплоть до момента перелома, поэтому у пациентов могут отсутствовать показания для проведения ДРА [29].
В ряде публикаций представлены радиомиксные модели, созданные с использованием признаков, извлечённых из изображений КТ поясничных позвонков, для диагностики остеопороза [16, 30–32]. В этих исследованиях продемонстрирована результативность радиомиксного анализа данных КТ поясничного отдела позвоночника с целью выявления у пациентов остеопороза перед выполнением операции. Этот метод можно использовать в качестве альтернативы для скрининга состояния костных структур. Радиомиксный анализ представляет собой сложную процедуру, однако последние разработки в области автоматической сегментации могут ускорить появление программного обеспечения с функцией извлечения и расчёта признаков. Тем не менее этот подход не может заменить ДРА, которая, согласно рекомендациям Международного общества клинической денситометрии, остаётся стандартным методом обследования. Z. Xue и соавт. [18], в отличие от указанных выше работ, для выявления остеопороза использовали автоматическую сегментацию с помощью нейросетей изображений КТ поясничных позвонков, извлечённые радиомиксные признаки легли в основу модели со значением AUC — 0,994. Следует отметить исследование L. He и соавт. [33], в котором с помощью трёх последовательностей МРТ (T1, T2, T1+T2) получили изображения поясничных позвонков для классификации следующих состояний:
- норма и остеопения;
- норма и остеопороз;
- остеопения и остеопороз.
Почти все модели продемонстрировали высокую результативность (AUC >0,7), однако наилучший показатель имела модель, созданная с использованием признаков, извлечённых из Т1+Т2-взвешенных изображений, и классифицирующая норму и остеопению. В своём исследовании Y. Zhao и соавт. [34] использовали комбинацию методов визуализации (КТ+МРТ) и ручную сегментацию с целью разработки автоматических моделей для выявления остеопении и остеопороза, а также прогнозирования остеопороза с высокой результативностью при значении AUC — 0,925 и 0,899 соответственно. Кроме того, проведена ручная сегментация изображений позвонков LI–LIII для обучения сети U-net с целью последующей автоматической сегментации. В большинстве упомянутых выше исследований, кроме работ L. He и соавт. [33] и Y. Zhao и соавт. [34], использовали снимки КТ поясничного отдела позвоночника, полученные в ходе планового обследования перед операцией, с помощью которых построены радиомиксные модели для будущего скрининга остеопороза.
Остеопоротический перелом — тяжёлое осложнение остеопороза, требующее своевременной диагностики и профилактики [35]. Существуют исследования, в которых определяли возможности радиомики в отношении прогнозирования остеопоротических переломов по данным КТ. Так, M. Wang и соавт. [36] оценивали результативность радиомиксной модели, разработанной с помощью признаков, извлечённых из изображений КТ, в прогнозировании остеопоротических переломов позвонков в динамике, её значение AUC >0,7. C. Ge и соавт. [37] разработали номограмму на основе радиомиксного индекса (Rad-score) с использованием результатов рентгенографии, КТ и МРТ с целью предоперационного прогнозирования остаточной боли в спине у пациентов с остепоротическим компрессионным переломом позвонков. H. Yang и соавт. [38] создали радиомиксную модель с использованием признаков, извлечённых из изображений КТ, для дифференциальной диагностики острого и хронического остеопоротического перелома позвонков. E. Biamonte и соавт. [39] разработали радиомиксную модель выявления переломов позвонков, связанных с повышенной хрупкостью, используя данные КТ поясничного отдела позвоночника, её значение AUC составило 0,784.
Спондилоартрит и спондилит
Спондилоартриты — группа хронических воспалительных заболеваний позвоночника, суставов и сухожильно-связочного аппарата с общими клиническими, радиологическими, магнитно-резонансными и генетическими признаками [40, 41]. Во всех рассмотренных ниже исследованиях использовали радиомиксный анализ с целью диагностики спондилоартрита по данным МРТ крестцово-подвздошного сустава. L. Ye и соавт. [42] предложили радиомиксно-клиническую номограмму для классификации аксиального и неаксиального спондилоартрита у пациентов с болью в пояснице, её значение AUC составило 0,9. В работе A.P.M. Tenório и соавт. [43] продемонстрировано потенциальное применение радиомики в качестве неинвазивного метода дифференциальной диагностики сакроилиита и спондилоартрита. M. Zheng и соавт. [44] с помощью радиомиксного анализа разработали модель для оценки отёка костного мозга у пациентов с аксиальным спондилоартритом, её значение AUC достигало 0,9. Авторы рассматривали радиомиксную модель как альтернативу применения индекса энтезита SPARCC (Spondyloarthritis Research Consortium of Canada) [45] для количественной оценки отёка костного мозга крестцово-подвздошного сустава при аксиальном спондилоартрите. Rad-score считают очень надёжным и объективным инструментом количественной оценки данного состояния, который в перспективе можно применять для контроля изменений после лечения. A.P.M. Tenório и соавт. [29] установили, что радиомиксные признаки можно использовать для клинической оценки спондилоартрита по данным МРТ, полученным с помощью последовательностей SPAIR и STIR. Кроме того, авторы разработали радиомиксно-глубокую модель для выявления сакроилиита, которая продемонстрировала диагностическую результативность, сравнимую с показателями опытных радиологов.
Туберкулёзный спондилит — одна из самых распространённых и тяжёлых форм туберкулёза костей и суставов. Несвоевременное или неправильное лечение данной патологии может привести к различным осложнениям. В тяжёлых случаях формируются деформации позвоночника, нарушения функций мочеполовой системы и кишечника, неврологические заболевания, что является причиной инвалидизации. Тем не менее течение туберкулёзного спондилита не имеет специфических клинических симптомов, лабораторных и визуальных признаков [46]. S. Wu и соавт. [47] разработали клинико-радиомиксную номограмму (AUC составляет 0,83), позволяющую осуществлять дифференциальную диагностику туберкулёзного и гнойного спондилита по данным КТ позвонков с учётом клинических факторов риска.
Другие заболевания позвоночника
G. Yu и соавт. [48] разработали номограмму с использованием признаков, извлечённых из Т2-взвешенных изображений МРТ наиболее выступающих межпозвонковых дисков (AUC cоставляет 0,93), для количественной оценки эффективности консервативного лечения. Данная модель предоставляет возможность предотвратить назначение избыточной или недостаточной терапии пациентам с межпозвонковой грыжей поясничного отдела.
M.X. Song и соавт. [49] разработали клинико-радиомиксную номограмму (AUC составляет 0,84) на основе признаков, извлечённых из T2-взвешенных изображений МРТ мягких тканей поясницы в аксиальной плоскости, с целью анализа изменений пояснично-грудной фасции у пациентов с болью в пояснице. Сегментацию выполняли в срединной точке T2-взвешенного изображения дисков LIV–LV в аксиальной плоскости, включая мышцу, выпрямляющую позвоночник, и многораздельную мышцу на этом уровне, а также часть жирового слоя под мышцей, которую окружает фасция. Предлагаемая модель позволяла дифференцировать ранние изменения в поверхностной и глубокой фасциях у пациентов с болью в пояснице, трудно выявляемые с помощью других методов.
Несмотря на широкое применение данных МРТ шейного отдела позвоночника для прогнозирования функциональных неврологических нарушений в послеоперационном периоде, их не используют с целью диагностики миелопатии. По этой причине M.Z. Zhang и соавт. [23] на основе признаков, извлечённых из T2-взвешенных изображений МРТ участка максимальной компрессии позвоночника, разработали радиомиксную модель (AUC составляет 0,74) для прогнозирования миелопатии шейного отдела позвоночника (компрессии спинного мозга).
ПАТОЛОГИЧЕСКИЕ НЕОНКОЛОГИЧЕСКИЕ ИЗМЕНЕНИЯ В КРУПНЫХ ПЕРИФЕРИЧЕСКИХ СУСТАВАХ
Транзиторный остеопороз
Транзиторный остеопороз тазобедренного сустава — редкое заболевание неустановленной этиологии, при котором наблюдаются транзиторные нейрососудистые нарушения, запускающие процессы, приводящие к локальному снижению МПКТ, что в свою очередь повышает вероятность перелома при приложении небольшой травмирующей силы или патологического перелома проксимального отдела бедренной кости. Следует отметить, что этот процесс имеет локализованный характер и топографически отграничен проксимальным отделом бедренной кости, что отличает его от генерализованного остеопороза, характеризующегося нарушением микроархитектуры и снижением минеральной плотности во всех костях скелета. Кроме того, при транзиторном остеопорозе тазобедренного сустава возможны самостоятельное разрешение патологического процесса без применения лекарственных препаратов или выраженный ответ на консервативное лечение, что позволяет отличить его от аваскулярного некроза головки бедренной кости, требующего хирургического вмешательства [29]. МРТ — ключевой инструмент дифференциальной диагностики указанных заболеваний, однако в некоторых случаях возникают трудности в отношении определения характера отёка костного мозга. Таким образом, неправильный диагноз влияет на выбор тактики лечения и способен привести к проведению необоснованного хирургического вмешательства. M.E. Klontzas и соавт. [50] при осуществлении радиомиксного анализа извлекли признаки из изображений МРТ тазобедренного сустава и с помощью методов машинного обучения разработали модель, позволяющую точно дифференцировать аваскулярный некроз и транзиторный остеопороз тазобедренного сустава. Результативность итоговой радиомиксной модели достигала уровня показателей специалистов в области радиологии костно-мышечной системы при значении AUC 0,937 и существенно превосходила показатели радиологов без указанной узкой специализации. S. Kim и соавт. [51] предложили применять радиомиксную модель на основе данных обзорной рентгенографии тазобедренного сустава в комбинации с глубокой нейронной сетью для диагностики остеопороза с высокой результативностью, что подтверждено значением AUC — 0,95. Глубокие признаки извлечены с помощью двух версий моделей глубокого обучения. Модель с использованием обрезанных изображений включала обрезанную область проксимальных отделов обеих бедренных костей. Она создана на основе рентгенограмм всех органов таза и тазобедренного сустава. С помощью такого подхода можно выявлять пациентов из группы риска развития остеопороза для назначения дополнительных диагностических исследований, в том числе ДРА.
H.K. Lim и соавт. [17] создали радиомиксную модель на основе признаков, извлечённых из данных КТ органов брюшной полости и таза с использованием полуавтоматической сегментации (алгоритма наращивания областей при редактировании изображений), для выявления остеопороза бедренной кости со значением AUC — 0,96.
Остеоартроз
Остеоартроз — это неоднородная группа заболеваний, которые имеют разную этиологию, но обладают схожими биологическими, морфологическими и клиническими признаками, а также исходами. При развитии данной патологии наблюдают поражение всех элементов сустава:
- хрящей;
- субхондральной кости;
- синовиальной оболочки;
- связок;
- капсулы;
- околосуставных мышц [29].
В процессе развития остеоартроза изменения в субхондральной области сопровождаются повреждением хрящевой ткани. Лечение, направленное на область поражения в субхондральной кости, замедляет его прогрессирование и улучшает качество жизни пациента [52]. Таким образом, при остеоартрозе очень важно своевременно выявлять даже самые незначительные изменения в костях.
Во всех исследованиях в области диагностики остеоартроза с применением радиомики использовали данные МРТ коленного сустава. Например, Z. Xue и соавт. [19] разработали радиомиксную модель обследования субхондральной кости для диагностики остеоартроза коленного сустава. Точность диагностики с помощью радиомиксной модели выше, чем у модели на основе морфологических параметров трабекул, а её значение AUC составило 0,961. Радиомиксная модель, разработанная T. Lin и соавт. [53] на основе признаков, извлечённых из изображений МРТ, и данных клинического обследования, показала высокую прогностическую ценность (AUC составляет 0,78) в выявлении боли в коленном суставе и остеоартроза. Y. Xiе и соавт. [54] предложили применять радиомику для обследования хряща и субхондральной кости в области коленного сустава, в обоих случаях зафиксированы высокие значения AUC — 0,982 и 0,939 соответственно. Радиомиксная модель оказалась эффективнее классической модели на основе паттернов T2-взвешенных изображений в диагностике предрасположенности к развитию посттравматического остеоартроза коленного сустава после реконструкции передней крестообразной связки.
Существует несколько методов количественной оценки менисков и суставного хряща, а также полуколичественные методы — структурных нарушений в тканях при остеоартрозе с использованием данных МРТ. Поскольку при остеоартрозе отмечают поражения субхондральной кости, для его выявления, контроля и прогнозирования очень важно выполнять количественную оценку изображений костей. J. Hirvasniemi и соавт. [20] установили высокую результативность (AUC составляет 0,8) применения радиомиксных признаков, извлечённых полуавтоматически из снимков субхондрального отдела большеберцовой кости, для выявления остеоартроза коленного сустава при выполнении сегментации на основе автоматического атласа.
Поднадколенниковое жировое тело (Гоффа) — это жировая ткань под надколенником, которая влияет на развитие остеоартроза. Таким образом, полуавтоматический анализ изменений в поднадколенниковом жировом теле можно выполнять с целью прогнозирования, выявления и оценки прогрессирования остеоартроза коленного сустава [55]. K. Yu и соавт. [21] оценивали значимость радиомиксных признаков, извлечённых из изображений МРТ поднадколенникового жирового тела с помощью автоматической сегментации с использованием свёрточных нейронных сетей 2,5D U-net, для прогнозирования впервые выявленного по данным рентгенографии остеоартроза коленного сустава за год до его манифестации. Исследователи создали и сравнили клинические, радиомиксные и смешанные (клинико-радиомиксные) модели. Клинико-радиомиксные и радиомиксные модели имели более высокую точность, чем соответствующие клинические модели (AUC составляет 0,702).
Только в одном из опубликованных исследований, проведённом W. Li и соавт. [56], использовали обзорные рентгенограммы с целью создания радиомиксной модели для диагностики остеоартроза коленного сустава. Отмечена результативность клинико-радиомиксной номограммы на основе рентгенограмм в переднезадней и боковой проекциях с учётом возраста в диагностике остеоартроза коленного сустава (AUC составляет 0,843).
ЗАБОЛЕВАНИЯ ВИСОЧНО-НИЖНЕЧЕЛЮСТНОГО СУСТАВА
Нарушения функции ВНЧС встречают часто — почти у трети взрослого населения [57]. Для диагностики заболеваний ВНЧС широко применяют МРТ, которая позволяет обследовать суставной диск ВНЧС. При обследовании ВНЧС используют стандартные T1-, T2- и взвешенные по протонной плотности импульсные последовательности МРТ. Тем не менее выявить воспалительные изменения в ВНЧС на ранней стадии сложно, что связано с небольшим размером этой структуры. K. Orhan и соавт. [58] разработали радиомиксную модель для выявления переднего смещения диска с редукцией и без неё на основе двусторонних изображений мыщелков и дисков, полученных с помощью МРТ, при этом её показатель AUC составил 0,77. H. Muraoka и соавт. [59] проанализировали текстуру латеральной крыловидной мышцы с целью выявления радиомиксных признаков для дифференцирования ревматоидного артрита и нормы по данным МРТ. A.L.F. Ricardo и соавт. [60] изучили радиомиксные признаки для диагностики поражения ВНЧС при ювенильном идиопатическом артрите по данным МРТ мыщелка нижней челюсти, а также проанализировали установленные корреляции извлечённых биомаркёров с возрастом и полом пациента и возрастом начала заболевания.
ЗАБОЛЕВАНИЯ МЫШЦ И СУХОЖИЛИЙ
Тендинопатия ахиллова сухожилия чаще всего возникает в результате спортивной травмы. Проведение УЗИ позволяет выявлять утолщение апоневроза ахиллова сухожилия, ослабление эхосигнала, утолщение ахиллова сухожилия, гиперплазию кровеносных сосудов, повышенную эхогенность жировой прослойки, локализованный кальциноз и другие изменения. L. Wang и соавт. [61] выполнили радиомиксный анализ изображений, полученных с помощью УЗИ, для выявления изменений в тканях ахиллова сухожилия. Авторы обнаружили коннотативные характеристики тендинопатии ахиллова сухожилия при значении AUC 0,99, свидетельствующем об очень высокой точности модели. С целью предотвращения анизотропного эффекта ультразвуковой датчик всегда помещали перпендикулярно длинной оси сухожилия. Для извлечения радиомиксных признаков из изображений области ахиллова сухожилия использовали красный, зелёный, синий и серошкальные каналы.
Количественная МРТ позволяет создать количественную карту тканей для многочисленных измерений в соответствии с анатомическими картами [62]. G. Colelli и соавт. [22] оценили возможность использования традиционной последовательности STIR для измерения параметров результатов количественной МРТ (прогнозирование T2-карт фракции жира и воды) с помощью радиомиксного алгоритма у пациентов с плече-лопаточно-лицевой мышечной дистрофией. Центром области интереса была голень, а последний полученный срез располагался на 6 см проксимальнее верхней границы надколенника. С помощью глубоких нейронных сетей выполнили автоматическую сегментацию изображений камбаловидной, медиальной и латеральной головок икроножной мышцы, передней большеберцовой, длинного разгибателя пальцев и длинной малоберцовой мышцы. Сообщают, что применение алгоритма, основанного на двух новых радиомиксных признаках, извлечённых из изображений, полученных с помощью последовательности STIR, и метода k-ближайших соседей в качестве классификатора, является наилучшим подходом (с наименьшей средней абсолютной ошибкой) для прогнозирования времени релаксации жировой фракции и воды.
H. Jiang и соавт. [63] разработали ультрасомиксную модель, основанную на анализе ультразвуковых сигналов [64], со значением AUC 0,789 для установления стадии субакромиального импиджмент-синдрома (по наличию воспаления и раздражения сухожилия плечевого сустава) с целью упрощения предварительного скрининга пациентов с болью в плече.
Таким образом, мы установили, что область применения радиомики в диагностике болезней костно-мышечной системы ограничена выявлением травм, тяжёлых воспалительных заболеваний позвоночника и периферических суставов, а также потенциального снижения МПКТ. Во всех рассмотренных выше исследованиях представлены модели с высокой прогностической ценностью, что подтверждено высокими значениями AUC в диапазоне от 0,70 до 0,99 (среднее значение 0,87). Мы считаем, что радиомиксные модели могут упростить принятие клинических решений на ранних стадиях болезней костно-мышечной системы и ускорить назначение подходящей терапии, особенно в случаях, когда выявление значимых изменений на изображениях представляет сложность.
АСПЕКТЫ РАДИОМИКСНОГО АНАЛИЗА
Универсальность радиомики обусловлена возможностью обработки любых цифровых изображений (двух- или трёхмерных) в качестве числовых данных. Таким образом, радиомиксный анализ применим ко всем существующим методам медицинской визуализации. Чаще всего используют изображения, полученные с помощью трёхмерной МРТ, ПЭТ и КТ, реже — рентгенографии и УЗИ [63]. В некоторых исследованиях для получения более подробной информации использовали комбинацию методов, например, МРТ и КТ [33, 34, 38]. Результаты УЗИ имеют дополнительный источник погрешности, который связан с расположением датчика относительно исследуемого объекта [61]. По этой причине УЗИ реже всего использовали в рассматриваемых исследованиях о возможностях применения радиомики. Ни в одном из рассмотренных исследований не обнаружено информации о применении ПЭТ.
Несмотря на успехи в использовании нейросетей для сегментации биомедицинских изображений [11, 65], для проведения радиомиксного анализа с целью диагностики заболеваний костно-мышечной системы, как правило, применяют ручную сегментацию, что может быть связано с трудностями в обучении нейросетей и необходимостью использования обширного набора данных. Автоматическая сегментация позволяет обрабатывать большие наборы изображений быстрее, чем ручная. Для этого можно использовать свёрточные нейронные сети, например U-net или W-net, которые отличаются хорошо известной архитектурой и уже доказали свою эффективность в отношении сегментации медицинских изображений [11]. Появление машинного обучения открывает широкие перспективы для автоматической сегментации [66].
Модели с несколькими источниками входных данных (например, клинико-радиомиксные и клинико-радиомиксно-глубокие) используют чаще, вероятно, по причине более высокой результативности по сравнению с моделями с одним источником входных данных (только клиническими или радиомиксными). Причиной может быть включение в модель дополнительных независимых источников информации. Например, в исследовании S. Kim и соавт. [51] при сравнении разных моделей установлено, что наиболее высокую точность классификации демонстрирует модель, объединяющая все признаки (клинические, текстурные и глубокие). Тем не менее при классификации цифровых изображений модели глубокого обучения на базе только искусственных нейронных сетей можно использовать как альтернативу радиомике. У глубокого обучения есть некоторые ограничения:
- сложность интерпретации признаков и исходов;
- необходимость ручной сегментации;
- потребность в создании обширного набора данных для обучения нейросети [67].
Для диагностики заболеваний костно-мышечной системы широко используют модели, которые можно описать следующим образом: радиомиксная или клиникорадиомиксная модель на основе данных МРТ или КТ с ручной сегментацией при использовании LASSO для отбора значимых признаков и логистической регрессии в качестве классификатора.
С момента появления в 2012 году радиомику используют главным образом в онкологии. Тем не менее постоянно растёт число исследований, в которых рассматривают её применение в контексте неонкологической патологии [13]. Среди неонкологических заболеваний визуализация особенно важна для диагностики болезней костно-мышечной системы, однако радиомиксный анализ начали проводить в этой области сравнительно недавно. Применение радиомики в диагностике ревматологических заболеваний посредством выявления ранних изменений в мягких тканях, особенно при использовании стандартных одноэнергетических изображений КТ, считают перспективным направлением. Например, при различных видах микрокристаллической артропатии, в частности при подагрическом артрите, в мягких тканях происходят морфологические изменения, которые можно выявить на ранней стадии с помощью радиомиксного анализа.
БУДУЩИЕ НАПРАВЛЕНИЯ РАЗВИТИЯ МЕТОДА
Внедрение алгоритмов радиомики в клиническую практику требует объединения усилий специалистов различных областей: врачей, аналитиков данных и разработчиков программного обеспечения. Радиомика может быть эффективна в ранней диагностике и мониторинге заболеваний, а также прогнозировании ответа на лечение и риска развития рецидива некоторых патологий, включая заболевания костно-мышечной системы. В отличие от других сфер её применения (например, диагностики сердечно-сосудистых и неврологических заболеваний, COVID-19), радиомиксная диагностика неонкологической патологии костно-мышечной системы только начинает своё развитие [13], однако усовершенствование метода в этой области считают перспективным.
Вероятно, в будущем следует уделять больше внимания проведению обзорной рентгенографии, поскольку этот метод визуализации широко применяют в клинической практике. Кроме того, разработчики радиомиксных алгоритмов могут столкнуться с некоторыми трудностями, одна из которых — необходимость создания наборов медицинских изображений, получаемых с помощью разных методов визуализации. Указанные наборы данных будут использовать с целью обучения свёрточных нейронных сетей для автоматической сегментации, а также создания различных классификаторов, включая модели на основе машинного и глубокого обучения, при этом для последних необходимы особенно обширные наборы данных. С целью увеличения объёма данных возможно использовать методы аугментации, поскольку формирование датасетов представляет собой длительный и трудоёмкий процесс.
Результаты всех рассмотренных исследований могут помочь клиницистам принимать решения на основании даже небольших изменений в тканях в области интереса. Тем не менее у некоторых из рассмотренных публикаций есть несколько ограничений, а именно:
- ручная сегментация данных;
- небольшой объём выборки;
- отсутствие внешней валидации;
- непрозрачное описание проведённых исследований.
Все эти ограничения значительно снижают воспроизводимость разработанных радиомиксных моделей, что, в свою очередь, препятствует их использованию в клинической практике. Таким образом, перед внедрением в клиническую практику необходимо проводить перекрёстную валидацию разработанных моделей с использованием внешних наборов данных (из других учреждений, с других устройств и от других пациентов) [68].
В будущем целесообразно создать открытую платформу для обмена радиомиксными моделями наподобие платформы Open-WebUI1 для обширных языковых моделей. Это предоставит возможность исследователям и клиницистам получать доступ к предварительно обученным моделям и использовать их в клинических условиях с обратной связью о результатах, направленной разработчикам. Такая платформа существенно упростит валидацию радиомиксных моделей.
В условиях непрерывного и стремительного развития радиомики постоянно отмечают появление новых инструментов для оценки качества исследований с её применением. Одна из последних разработок — система методологической оценки радиомики (METhodological RadiomiICs Score, METRICS), опубликованная международным консорциумом профильных специалистов и одобренная Европейским обществом медицинской визуализации2 [69]. METRICS — это тщательно продуманный алгоритм оценки качества радиомиксных исследований с использованием гибкого формата, который подходит для всех методологических вариантов. Его внедрение упростит организацию и проведение качественных исследований в области радиомики [70].
ЗАКЛЮЧЕНИЕ
Таким образом, наблюдается стремительное расширение сфер применения радиомики, что подтверждено её использованием в диагностике заболеваний неонкологического профиля, в том числе болезней костно-мышечной системы. Наиболее широко в этой области применяют клинико-радиомиксные модели, поскольку они обладают более высокой результативностью по сравнению с моделями на основе одного источника входных данных (только клиническими или радиомиксными). Применение методов искусственного интеллекта в радиомиксном анализе с целью диагностики болезней костно-мышечной системы ограничено этапами сегментации и классификации. Тем не менее в будущем перспективно применение методов радиомики для ранней диагностики, мониторинга и лечения ревматологических и ортопедических заболеваний и травм.
ДОПОЛНИТЕЛЬНАЯ ИНФОРМАЦИЯ
Источник финансирования. Авторы заявляют об отсутствии внешнего финансирования при проведении поисково-аналитической работы.
Раскрытие интересов. Авторы заявляют об отсутствии отношений, деятельности и интересов (личных, профессиональных или финансовых), связанных с третьими лицами (коммерческими, некоммерческими, частными), интересы которых могут быть затронуты содержанием статьи, а также иных отношений, деятельности и интересов за последние три года, о которых необходимо сообщить.
Вклад авторов. М.О. Плешков — концепция работы, сбор и анализ литературных данных, написание текста рукописи; М.А. Замышевская, И.В. Толмачев — концепция работы, написание текста рукописи; Е.В. Кучинский, Т.В. Ким — сбор и анализ литературных данных; X. Jin — концепция работы, написание и редактирование рукописи; J. Zhang — написание текста рукописи; В.Д. Завадовская, М.А. Зоркальцев, Д.А. Погонченкова — редактирование рукописи; В.Д. Удодов — концепция работы. Все авторы одобрили рукопись (версию для публикации), а также согласились нести ответственность за все аспекты работы и гарантировали, что вопросы, связанные с точностью или добросовестностью любой части работы, будут должным образом рассмотрены и решены.
ADDITIONAL INFORMATION
Funding source. This article was not supported by any external sources of funding.
Disclosure of interests. The authors declare that they have no relationships, activities or interests (personal, professional or financial) with third parties (commercial, non-commercial, private) whose interests may be affected by the content of the article, as well as no other relationships, activities or interests over the past three years that must be reported.
Authors’ contribution. M.O. Pleshkov: concept of the work, collection and analysis of literature data, writing the manuscript; M.A. Zamyshevskaya, I.V. Tolmachev: concept of the work, writing the manuscript; E.V. Kuchinskii, T.V. Kim: collection and analysis of literature data; X.Jin: concept of the work, writing and editing the manuscript; J. Zhang writing the manuscript; V.D. Zavadovskaya, M.A. Zorkaltsev, D.A. Pogonchenkova editing the manuscript; V.D. Udodov: concept of the work. Thereby, all authors provided approval of the version to be published and agree to be accountable for all aspects of the work in ensuring that questions related to the accuracy or integrity of any part of the work are appropriately investigated and resolved.
1 Open-WebUI [Internet]. GitHub; 2022–2024. Режим доступа: https://github.com/open-webui/open-webui Дата обращение: 01.03.2024.
2 EuSoMII [Internet]. Vienna: Europen Society of Medical Imaging Informatics; 2020–2024. Режим доступа: https://www.eusomii.org/ Дата обращения: 01.03.2024.
About the authors
Maksim O. Pleshkov
Siberian State Medical University
Author for correspondence.
Email: maksim.o.pleshkov@gmail.com
ORCID iD: 0000-0002-4131-0115
SPIN-code: 8625-0940
Russian Federation, Tomsk
Maria A. Zamyshevskaya
Siberian State Medical University
Email: zamyshevskayamari@mail.ru
ORCID iD: 0000-0001-7582-3843
SPIN-code: 4434-1179
MD, Cand. Sci. (Medicine)
Russian Federation, TomskEgor V. Kuchinskii
Siberian State Medical University
Email: egorelsigich@gmail.com
ORCID iD: 0009-0002-5960-0935
Russian Federation, Tomsk
Xiance Jin
1st Affiliated Hospital of Wenzhou Medical University
Email: jinxc1979@hotmail.com
ORCID iD: 0000-0002-4117-5953
China, Wenzhou
Ji Zhang
1st Affiliated Hospital of Wenzhou Medical University
Email: jizhang1996@126.com
ORCID iD: 0000-0002-2718-6509
China, Wenzhou
Vera D. Zavadovskaya
Siberian State Medical University
Email: wdzav@mail.ru
ORCID iD: 0000-0001-6231-7650
SPIN-code: 7905-8363
MD, Dr. Sci. (Medicine)
Russian Federation, TomskMaxim A. Zorkaltsev
Siberian State Medical University
Email: zorkaltsev@mail.ru
ORCID iD: 0000-0003-0025-2147
SPIN-code: 3769-8560
MD, Dr. Sci. (Medicine)
Russian Federation, TomskTkhe V. Kim
Siberian State Medical University
Email: Pavel.kim.08@mail.ru
ORCID iD: 0009-0002-9766-6986
SPIN-code: 7834-9024
Russian Federation, Tomsk
Daria A. Pogonchenkova
Siberian State Medical University
Email: azarova_d_a@mail.ru
ORCID iD: 0000-0002-5903-3662
SPIN-code: 4141-9068
MD, Cand. Sci. (Medicine)
Russian Federation, TomskVladimir D. Udodov
Siberian State Medical University
Email: linx86rus@gmail.com
ORCID iD: 0000-0002-1321-7861
SPIN-code: 3619-0496
MD, Cand. Sci. (Medicine)
Russian Federation, TomskIvan V. Tolmachev
Siberian State Medical University
Email: ivantolm@mail.ru
ORCID iD: 0000-0002-2888-5539
SPIN-code: 1074-1268
MD, Cand. Sci. (Medicine)
Russian Federation, TomskReferences
- Wolbarst AB, Capasso P, Wyant AR. Medical imaging: essentials for physicians. New Jersey: John Wiley & Sons; 2013. doi: 10.1002/9781118480267
- Shaikh F, Franc B, Allen E, et al. Translational radiomics: defining the strategy pipeline and considerations for application — Part 1: from methodology to clinical implementation. Journal of the American College of Radiology. 2018;15(3):538–542. doi: 10.1016/j.jacr.2017.12.008
- Acharya UR, Hagiwara Y, Sudarshan VK, et al. Towards precision medicine: from quantitative imaging to radiomics. Journal of Zhejiang University-SCIENCE B. 2018;19(1):6–24. doi: 10.1631/jzus.B1700260 EDN: YEROEH
- Giardino A, Gupta S, Olson E, et al. Role of imaging in the era of precision medicine. Academic Radiology. 2017;24(5):639–649. doi: 10.1016/j.acra.2016.11.021 EDN: YXQFYH
- Hatt M, Le Rest CC, Tixier F, et al. Radiomics: Data Are Also Images. Journal of Nuclear Medicine. 2019;60(Suppl. 2):38S–44S. doi: 10.2967/jnumed.118.220582
- Lambin P, Rios-Velazquez E, Leijenaar R, et al. Radiomics: extracting more information from medical images using advanced feature analysis. European Journal of Cancer. 2012;48(4):441–446. doi: 10.1016/j.ejca.2011.11.036
- Keek SA, Leijenaar RTH, Jochems A, Woodruff HC. A review on radiomics and the future of theranostics for patient selection in precision medicine. The British Journal of Radiology. 2018;91(1091):20170926. doi: 10.1259/bjr.20170926
- Scapicchio C, Gabelloni M, Barucci A, et al. A deep look into radiomics. La radiologia medica. 2021;126(10):1296–1311. doi: 10.1007/s11547-021-01389-x EDN: CFTFXK
- Lambin P, Leijenaar RTH, Deist TM, et al. Radiomics: the bridge between medical imaging and personalized medicine. Nature Reviews Clinical Oncology. 2017;14(12):749–762. doi: 10.1038/nrclinonc.2017.141
- Zhang X, Zhang Y, Zhang G, et al. Deep learning with radiomics for disease diagnosis and treatment: challenges and potential. Frontiers in Oncology. 2022;12:773840. doi: 10.3389/fonc.2022.773840 EDN: HKEDBO
- Weng W, Zhu X. INet: convolutional networks for biomedical image segmentation. IEEE Access. 2021;9:16591–16603. doi: 10.1109/access.2021.3053408 EDN: TKNUNY
- Demircioğlu A. Are deep models in radiomics performing better than generic models? A systematic review. European Radiology Experimental. 2023;7(1):11. doi: 10.1186/s41747-023-00325-0
- McCague C, Ramlee S, Reinius M, et al. Introduction to radiomics for a clinical audience. Clinical Radiology. 2023;78(2):83–98. doi: 10.1016/j.crad.2022.08.149 EDN: FTQEEU
- Davis KW, Blankenbaker DG, Bernard S. Diagnostic imaging: musculoskeletal non-traumatic disease. 3rd ed. Amsterdam: Elsevier; 2022.
- Liu S, Wang B, Fan S, et al. Global burden of musculoskeletal disorders and attributable factors in 204 countries and territories: a secondary analysis of the Global Burden of Disease 2019 study. BMJ Open. 2022;12(6):e062183. doi: 10.1136/bmjopen-2022-062183 EDN: JPFMCK
- Jiang YW, Xu XJ, Wang R, Chen CM. Radiomics analysis based on lumbar spine CT to detect osteoporosis. European Radiology. 2022;32(11):8019–8026. doi: 10.1007/s00330-022-08805-4 EDN: FFIEJM
- Lim HK, Ha HI, Park SY, Han J. Prediction of femoral osteoporosis using machine-learning analysis with radiomics features and abdomen-pelvic CT: a retrospective single center preliminary study. PLOS ONE. 2021;16(3):e0247330. doi: 10.1371/journal.pone.0247330 EDN: BXSLMY
- Xue Z, Huo J, Sun X, et al. Using radiomic features of lumbar spine CT images to differentiate osteoporosis from normal bone density. BMC Musculoskeletal Disorders. 2022;23(1):1–9. doi: 10.1186/s12891-022-05309-6 EDN: QMPUNB
- Xue Z, Wang L, Sun Q, et al. Radiomics analysis using MR imaging of subchondral bone for identification of knee osteoarthritis. Journal of Orthopaedic Surgery and Research. 2022;17(1):1–11. doi: 10.1186/s13018-022-03314-y EDN: MUEEVI
- Hirvasniemi J, Klein S, Bierma-Zeinstra S, et al. A machine learning approach to distinguish between knees without and with osteoarthritis using MRI-based radiomic features from tibial bone. European Radiology. 2021;31(11):8513–8521. doi: 10.1007/s00330-021-07951-5 EDN: OQYJMS
- Yu K, Ying J, Zhao T, et al. Prediction model for knee osteoarthritis using magnetic resonance–based radiomic features from the infrapatellar fat pad: data from the osteoarthritis initiative. Quantitative Imaging in Medicine and Surgery. 2023;13(1):352–369. doi: 10.21037/qims-22-368 EDN: XMHHBS
- Colelli G, Barzaghi L, Paoletti M, et al. Radiomics and machine learning applied to STIR sequence for prediction of quantitative parameters in facioscapulohumeral disease. Frontiers in Neurology. 2023;14:1105276. doi: 10.3389/fneur.2023.1105276 EDN: TFSEOI
- Zhang MZ, Ou-Yang HQ, Jiang L, et al. Optimal machine learning methods for radiomic prediction models: clinical application for preoperative T2*-weighted images of cervical spondylotic myelopathy. JOR SPINE. 2021;4(4):e1178. doi: 10.1002/jsp2.1178 EDN: QCNMEY
- Çorbacıoğlu ŞK, Aksel G. Receiver operating characteristic curve analysis in diagnostic accuracy studies: a guide to interpreting the area under the curve value. Turkish Journal of Emergency Mededicine. 2023;23(4):195–198. doi: 10.4103/tjem.tjem_182_23
- Chun KJ. Bone densitometry. Seminars in Nuclear Medicine. 2011;41(3):220–228. doi: 10.1053/j.semnuclmed.2010.12.002 EDN: XZBHAJ
- Yao Q, Liu M, Yuan K, et al. Radiomics nomogram based on dual-energy spectral CT imaging to diagnose low bone mineral density. BMC Musculoskeletal Disorders. 2022;23(1):1–10. doi: 10.1186/s12891-022-05389-4 EDN: ZJCBIU
- Dai H, Wang Y, Fu R, et al. Radiomics and stacking regression model for measuring bone mineral density using abdominal computed tomography. Acta Radiologica. 2021;64(1):228–236. doi: 10.1177/02841851211068149 EDN: KCQOEI
- Rastegar S, Vaziri M, Qasempour Y, et al. Radiomics for classification of bone mineral loss: a machine learning study. Diagnostic and Interventional Imaging. 2020;101(9):599–610. doi: 10.1016/j.diii.2020.01.008 EDN: MXTTFU
- Tenório APM, Ferreira-Junior JR, Dalto VF, et al. Radiomic quantification for MRI assessment of sacroiliac joints of patients with spondyloarthritis. Journal of Digital Imaging. 2022;35(1):29–38. doi: 10.1007/s10278-021-00559-7 EDN: EDSNBE
- Xie Q, Chen Y, Hu Y, et al. Development and validation of a machine learning-derived radiomics model for diagnosis of osteoporosis and osteopenia using quantitative computed tomography. BMC Medical Imaging. 2022;22(1):1–9. doi: 10.1186/s12880-022-00868-5 EDN: TBGMNV
- Wang J, Zhou S, Chen S, et al. Prediction of osteoporosis using radiomics analysis derived from single source dual energy CT. BMC Musculoskeletal Disorders. 2023;24(1):100. doi: 10.1186/s12891-022-06096-w EDN: CSYYUO
- Huang CB, Hu JS, Tan K, et al. Application of machine learning model to predict osteoporosis based on abdominal computed tomography images of the psoas muscle: a retrospective study. BMC Geriatrics. 2022;22(1):796. doi: 10.1186/s12877-022-03502-9
- He L, Liu Z, Liu C, et al. Radiomics based on lumbar spine magnetic resonance imaging to detect osteoporosis. Academic Radiology. 2021;28(6):e165–e171. doi: 10.1016/j.acra.2020.03.046 EDN: UHSGDH
- Zhao Y, Zhao T, Chen S, et al. Fully automated radiomic screening pipeline for osteoporosis and abnormal bone density with a deep learning-based segmentation using a short lumbar mDixon sequence. Quantitative Imaging in Medicine and Surgery. 2022;12(2):1198–1213. doi: 10.21037/qims-21-587 EDN: NZYATO
- Kutsal FY, Ergin Ergani GO. Vertebral compression fractures: Still an unpredictable aspect of osteoporosis. Turkish Journal of Medical Sciences. 2021;51(2):393–399. doi: 10.3906/sag-2005-315 EDN: YTBYNY
- Wang M, Chen X, Cui W, et al. A computed tomography-based radiomics nomogram for predicting osteoporotic vertebral fractures: a longitudinal study. The Journal of Clinical Endocrinology and Metabolism. 2022;108(6):e283–e294. doi: 10.1210/clinem/dgac722 EDN: ZDBNTO
- Ge C, Chen Z, Lin Y, et al. Preoperative prediction of residual back pain after vertebral augmentation for osteoporotic vertebral compression fractures: initial application of a radiomics score based nomogram. Frontiers in Endocrinology. 2022;13:1093508. doi: 10.3389/fendo.2022.1093508 EDN: SHBOCJ
- Yang H, Yan S, Li J, et al. Prediction of acute versus chronic osteoporotic vertebral fracture using radiomics-clinical model on CT. European Journal of Radiology. 2022;149:110197. doi: 10.1016/j.ejrad.2022.110197 EDN: HVGSBS
- Biamonte E, Levi R, Carrone F, et al. Artificial intelligence-based radiomics on computed tomography of lumbar spine in subjects with fragility vertebral fractures. Journal of Endocrinological Investigation. 2022;45(10):2007–2017. doi: 10.1007/s40618-022-01837-z EDN: EAIWLD
- Erdes ShF, Badokin VV, Bochkova AG, et al. On the terminology of spondyloarthritis. Rheumatology Science and Practice. 2015;53(6):657–660. doi: 10.14412/1995-4484-2015-657-660 EDN: WYDFJB
- Ramiro S, Nikiphorou E, Sepriano A, et al. ASAS-EULAR recommendations for the management of axial spondyloarthritis: 2022 update. Annals of the Rheumatic Diseases. 2023;82(1):19–34. doi: 10.1136/ard-2022-223296 EDN: DLBUZY
- Ye L, Miao S, Xiao Q, et al. A predictive clinical-radiomics nomogram for diagnosing of axial spondyloarthritis using MRI and clinical risk factors. Rheumatology. 2021;61(4):1440–1447. doi: 10.1093/rheumatology/keab542 EDN: FELRLG
- Tenório APM, Faleiros MC, Junior JRF, et al. A study of MRI-based radiomics biomarkers for sacroiliitis and spondyloarthritis. International Journal of Computer Assisted Radiology and Surgery. 2020;15(10):1737–1748. doi: 10.1007/s11548-020-02219-7 EDN: RLWIQG
- Zheng M, Miao S, Chen D, et al. Can radiomics replace the SPARCC scoring system in evaluating bone marrow edema of sacroiliac joints in patients with axial spondyloarthritis? Clinical Rheumatology. 2023;42(6):1675–1682. doi: 10.1007/s10067-023-06543-6 EDN: FHQBFF
- Maksymowych WP, Mallon C, Morrow S, et al. Development and validation of the spondyloarthritis research consortium of canada (SPARCC) enthesitis index. Annals of the Rheumatic Diseases. 2009;68(6):948–953. doi: 10.1136/ARD.2007.084244
- Lacerda C, Linhas R, Duarte R. Tuberculous spondylitis: a report of different clinical scenarios and literature update. Case Reports in Medicine. 2017;2017:1–4. doi: 10.1155/2017/4165301
- Wu S, Wei Y, Li H, et al. A predictive clinical-radiomics nomogram for differentiating tuberculous spondylitis from pyogenic spondylitis using CT and clinical risk factors. Infection and Drug Resistance. 2022;15:7327–7338. doi: 10.2147/IDR.S388868 EDN: TBVWYF
- Yu G, Yang W, Zhang J, et al. Application of a nomogram to radiomics labels in the treatment prediction scheme for lumbar disc herniation. BMC Medical Imaging. 2022;22(1):51. doi: 10.1186/s12880-022-00778-6 EDN: WCRFUE
- Song M, Yang H, Yang H, et al. MR imaging radiomics analysis based on lumbar soft tissue to evaluate lumbar fascia changes in patients with low back pain. Academic Radiology. 2023;30(11):2450–2457. doi: 10.1016/j.acra.2023.02.038 EDN: UWOCTW
- Klontzas ME, Manikis GC, Nikiforaki K, et al. Radiomics and machine learning can differentiate transient osteoporosis from avascular necrosis of the hip. Diagnostics. 2021;11(9):1686. doi: 10.3390/diagnostics11091686 EDN: WCRMFH
- Kim S, Kim BR, Chae HD, et al. Deep radiomics–based approach to the diagnosis of osteoporosis using hip radiographs. Radiology: Artificial Intelligence. 2022;4(4):e210212. doi: 10.1148/ryai.210212 EDN: QKWOZX
- Castañeda S, Roman-Blas JA, Largo R, Herrero-Beaumont G. Subchondral bone as a key target for osteoarthritis treatment. Biochemical Pharmacology. 2012;83(3):315–323. doi: 10.1016/j.bcp.2011.09.018
- Lin T, Peng S, Lu S, et al. Prediction of knee pain improvement over two years for knee osteoarthritis using a dynamic nomogram based on MRI-derived radiomics: a proof-of-concept study. Osteoarthritis and Cartilage. 2023;31(2):267–278. doi: 10.1016/j.joca.2022.10.014 EDN: HEPKTM
- Xie Y, Dan Y, Tao H, et al. Radiomics feature analysis of cartilage and subchondral bone in differentiating knees predisposed to posttraumatic osteoarthritis after anterior cruciate ligament reconstruction from healthy knees. BioMed Research International. 2021;2021(1):4351499. doi: 10.1155/2021/4351499 EDN: GEGKRA
- Sander R. Asymptomatic osteoporosis masks the importance of taking medication. Nursing Older People. 2007;19(10):23–23. doi: 10.7748/nop.19.10.23.s21
- Li W, Feng J, Zhu D, et al. Nomogram model based on radiomics signatures and age to assist in the diagnosis of knee osteoarthritis. Experimental Gerontology. 2023;171:112031. doi: 10.1016/j.exger.2022.112031 EDN: OJHMQD
- Valesan LF, Da-Cas CD, Réus JC, et al. Prevalence of temporomandibular joint disorders: a systematic review and meta-analysis. Clinical Oral Investigations. 2021;25(2):441–453. doi: 10.1007/s00784-020-03710-w EDN: LUZGIY
- Orhan K, Driesen L, Shujaat S, et al. Development and validation of a magnetic resonance imaging-based machine learning model for TMJ pathologies. BioMed Research International. 2021;2021(1):6656773. doi: 10.1155/2021/6656773 EDN: IKONFS
- Muraoka H, Kaneda T, Hirahara N, et al. Magnetic resonance image texture analysis of the lateral pterygoid muscle in patients with rheumatoid arthritis: a preliminary report. Oral Radiology. 2022;39(2):242–247. doi: 10.1007/s11282-022-00625-y EDN: ZDPFQW
- Ricardo ALF, da Silva GA, Ogawa CM, et al. Magnetic resonance imaging texture analysis for quantitative evaluation of the mandibular condyle in juvenile idiopathic arthritis. Oral Radiology. 2022;39(2):329–340. doi: 10.1007/s11282-022-00641-y EDN: LWUNPK
- Wang L, Wen D, Yin Y, et al. Musculoskeletal ultrasound image-based radiomics for the diagnosis of achilles tendinopathy in skiers. Journal of Ultrasound in Medicine. 2022;42(2):363–371. doi: 10.1002/jum.16059 EDN: RFSUOT
- Gulani V, Seiberlich N. Quantitative MRI: rationale and challenges. In: Seiberlich N, Gulani V, Calamante F, editors. Quantitative magnetic resonance imaging. London: Elsevier; 2020. P. xxxvii–li. doi: 10.1016/B978-0-12-817057-1.00001-9
- Jiang H, Chen L, Zhao Y, et al. Machine learning-based ultrasomics for predicting subacromial impingement syndrome stages. Journal of Ultrasound in Medicine. 2021;41(9):2279–2285. doi: 10.1002/jum.15914 EDN: YEOHCZ
- Yin R, Jiang M, Lv WZ, et al. Study processes and applications of ultrasomics in precision medicine. Frontiers in Oncology. 2020;10:1736. doi: 10.3389/fonc.2020.01736 EDN: QZLABO
- AL Qurri A, Almekkawy M. Improved UNet with attention for medical image segmentation. Sensors. 2023;23(20):8589. doi: 10.3390/s23208589 EDN: KNTAZU
- Bach Cuadra M, Favre J, Omoumi P. Quantification in musculoskeletal imaging using computational analysis and machine learning: segmentation and radiomics. Seminars in Musculoskeletal Radiology. 2020;24(1):50–64. doi: 10.1055/s-0039-3400268 EDN: KXRSQY
- Anwar SM, Majid M, Qayyum A, et al. Medical image analysis using convolutional neural networks: a review. Journal of Medical Systems. 2018;42(11):226. doi: 10.1007/s10916-018-1088-1 EDN: ZTZIEH
- Miranda J, Horvat N, Fonseca GM, et al. Current status and future perspectives of radiomics in hepatocellular carcinoma. World Journal of Gastroenterology. 2023;29(1):43–60. doi: 10.3748/wjg.v29.i1.43 EDN: QDGABL
- Kocak B, Akinci D’Antonoli T, Mercaldo N, et al. Methodological radiomics score (METRICS): a quality scoring tool for radiomics research endorsed by EUSUMII. Insights into Imaging. 2024;15(1):8. doi: 10.1186/s13244-023-01572-w EDN: CINMDC
- Aghakhanyan G, Filidei T, Febi M, et al. Advancing pediatric sarcomas through radiomics: a systematic review and prospective assessment using radiomics quality score (RQS) and methodological radiomics score (METRICS). Diagnostics. 2024;14(8):832. doi: 10.3390/diagnostics14080832 EDN: GFBZWJ
Supplementary files

