


Application of radiomics in osteoporosis detection — current capabilities and future prospects (a review)
- Authors: Chugaev A.I.1,2, Vasilev Y.A.1, Petraikin A.V.1, Blokhin I.A.1, Vladzymyrskyy A.V.1, Omelyanskaya O.V.1
-
Affiliations:
- Research and Practical Clinical Center for Diagnostics and Telemedicine Technologies
- MRI24
- Issue: Vol 6, No 1 (2025)
- Pages: 63-77
- Section: Reviews
- Submitted: 08.08.2024
- Accepted: 10.10.2024
- Published: 25.03.2025
- URL: https://jdigitaldiagnostics.com/DD/article/view/635014
- DOI: https://doi.org/10.17816/DD635014
- ID: 635014

Cite item
Full Text

Abstract
The prevalence of osteoporotic fractures continues to increase as the population ages due to demographic transition. This is particularly relevant for developed countries, including Russia. Radiomics may emerge as a valuable tool for osteoporosis detection.
This review demonstrates the development and application of radiomics in diagnosing oncological and non-oncological diseases including osteoporosis.
A literature search was conducted using the databases PubMed, Google Scholar, and eLibrary over the past 5 years. Data on the prevalence and epidemiology of osteoporosis were obtained from publications in the last 15 years. The search was performed using the following keywords: "radiomic", "osteoporosis", "texture", "magnetic resonance imaging", "computed tomography", "non-oncological radiomics", «магнитно-резонансная томография» ("magnetic resonance imaging"), «компьютерная томография» ("computed tomography"), «радиомика» ("radiomics"), «остеопороз» ("osteoporosis"), «текстурный анализ» ("texture analysis"), «радиомический анализ» ("radiomic analysis"). Data from original clinical studies were included. In total, 247 articles were found and analyzed. Finally, 59 studies were selected for the review.
The number of studies examining the potential of radiomics in detecting osteoporosis was limited. Further research is required to explore the potential of radiomic analysis using computed tomography and magnetic resonance imaging for detecting osteoporosis compared to established methods such as dual-energy X-ray absorptiometry and the FRAX (Fracture Risk Assessment Tool) algorithm.
Full Text
ВВЕДЕНИЕ
Остеопороз — прогрессирующее системное заболевание скелета, характеризующееся снижением минеральной плотности кости (МПК) и нарушением микроархитектуры костной ткани с последующим повышением хрупкости костей и склонности к переломам [1]. Данное заболевание проявляется переломами костей, которые происходят при незначительной травме — низкоэнергетические переломы. Заболевание имеет системный характер, однако наиболее часто переломы происходят в позвонках, проксимальном отделе бедренной кости, а также в дистальном отделе предплечья и проксимальном отделе плечевой кости. Остеопоротические переломы приводят к существенному снижению качества жизни и даже к повышенной летальности, особенно это касается проксимального отдела бедренной кости [2, 3]. Следует отметить, что их риск наиболее высок у лиц с более низкой МПК, тем не менее большинство переломов происходит у пациентов со значением T-критерия выше −2,5 стандартных отклонений (SD) [4–8]. Огромное количество остеопоротических переломов позвонков не диагностированы, поскольку пациенты часто не обращаются с ними за медицинской помощью [9]. Распространённость переломов продолжает увеличиваться по мере старения населения, связанного с прохождением демографического перехода. Эта тенденция актуальна для развитых стран, включая Российскую Федерацию (РФ) [10]. Надлежащее своевременное лечение даёт наилучшую возможность предотвратить цикл повторных переломов, инвалидизацию и преждевременную смерть среди пациентов пожилого возраста [11]. Радиомика в перспективе может стать хорошим инструментом поддержки принятия клинических решений. Особенностью радиомического анализа считают выявление взаимосвязи цифровых характеристик, извлекаемых из диагностических изображений, с характеристиками органов и тканей [12].
Данный обзор посвящён вопросам развития радиомического анализа, применяемого в диагностике онкологических и неонкологических заболеваний, в частности — остеопороза. В нём мы представим некоторые промежуточные этапы и переменны, относящиеся к радиомическому анализу, а также достижения в этой области. Определим значимость проблемы выявления остеопороза, а также мы рассмотрим инструментальные методы диагностики, используемые для радиомического анализа.
Методология поиска
Поиск литературы, соответствующий теме обзора, производили с помощью поисковых систем, таких как PubMed, Google Schholar и eLibrary, за последние пять лет. Информация о распространённости и эпидемиологии остеопороза получена из публикаций за последние пятнадцать лет. Мы выполняли запрос в поисковых системах с использованием следующих ключевых слов: «radiomic», «osteoporosis», «texture», «magnetic resonance imaging», «computed tomography», «non-oncological radiomics», «магнитно-резонансная томография», «компьютерная томография», «радиомика», «остеопороз», «текстурный анализ», «радиомический анализ». В обзор включены данные оригинальных клинических исследований. В результате найдено 247 статей, из которых в обзор после анализа публикаций отобрано 64 источника.
КАК ПОСТАВИТЬ ДИАГНОЗ ОСТЕОПОРОЗ И С КАКИМИ ТРУДНОСТЯМИ ПРИ ЭТОМ СТАЛКИВАЕТСЯ КЛИНИЦИСТ?
Согласно международным и российским клиническим рекомендациям, нет достоверных методов физикального обследования и лабораторной диагностики для выявления остеопороза. Это несколько выделяет остеопороз среди других метаболических заболеваний, которые в своём большинстве устанавливают с помощью методов лабораторной диагностики. Маркёры резорбции определяют с целью ранней оценки эффективности лечения и приверженности к терапии, а не для выявления остеопороза.
Согласно актуальным Федеральным клиническим рекомендациям 2021 года, диагноз остеопороз возможно установить если у пациента установлены:
- доказанный низкоэнергетический перелом;
- снижение МПК по Т-критерию менее −2,5 SD для проксимального отдела бедренной кости и/или позвоночника при проведении двухэнергетической рентгеновской абсорбциометрии (ДРА);
- высокий риск переломов, определённый с помощью алгоритма FRAX (fracture risk assessment tool — инструмент для оценки риска переломов) [13].
Выявление компрессионного перелома тела позвонка считают показанием к медикаментозному лечению остеопороза с целью уменьшения риска последующих переломов [1]. Оценку состояния позвонков проводят с использованием рентгенографии грудного и поясничного отделов позвоночника в боковой проекции. Для выполнения данного исследования применяют стандартное рентгенологическое оборудование. Компрессионный перелом тела позвонка — это снижение высоты его тела (компрессионная деформация) в переднем, среднем или заднем отделах на 20% и более по сравнению с другими отделами этого же позвонка [14]. Практическим специалистам не рекомендовано устанавливать диагноз остеопороза на основании косвенных признаков повышенной прозрачности костей скелета с помощью стандартных рентгенограмм у пациентов без компрессионных переломов тел позвонков. Различные виды компьютерной томографии (КТ), магнитно-резонансной томографии (МРТ) возможно рассматривать в качестве дополнительных методов дифференциальной диагностики.
Отечественные клинические рекомендации, а также эксперты Всемирной организации здравоохранения и Международного фонда по остеопорозу (IOF) отмечают, что «золотым стандартом» измерения МПК является ДРА [13]. Снижение МПК по Т-критерию менее −2,5 SD для проксимального отдела бедренной кости и/или позвоночника при проведении данного метода исследования — основное показание для установления диагноза остеопороз.
Скрининг остеопороза по данным ДРА имеет ряд ограничений. В РФ остаётся актуальной проблема недостаточной обеспеченности диагностическим оборудованием — аппаратами для проведения рентгеновской денситометрии [15]. Данный метод позволяет измерять только проекционную МПК, которая не даёт возможность установить различия между дегенеративными изменениями кортикальной и трабекулярной костей, оценить трёхмерную форму каждого позвонка, а также он способен завышать значение МПК у пациентов с ожирением [16]. Кроме того, по данным некоторых эпидемиологических исследований в области остеопороза, большинство остеопоротических переломов (клиническое проявление остеопороза) возникают уже при значениях Т-критерия, которому соответствует остеопения — от −1 до −2,5 SD [4–8]. В крупном проспективном исследовании, в котором участвовало более 7 000 пациентов, в некоторых когортах 2/3 переломов зафиксированы при показателях МПК по результатам ДРА выше −2,5 SD, что соответствует остеопении или норме. Это говорит о том, что использование только данных ДРА в качестве предиктора остеопоротических переломов не всегда оправдано [17].
Количественная КТ описывает тот же минеральный компонент кости, что и ДРА, однако позволяет оценивать объёмную МПК. Именно поэтому её результаты не зависят от мягких тканей в сравнении с ДРА, применение которой у пациентов с ожирением или дегенеративными изменениями способно ложно увеличивать проекционную МПК. Кроме того, данный метод возможно применить как в отношении кортикальной, так и трабекулярной кости, а также позволяет предсказывать её прочность в целом. Количественная КТ предоставляет возможность оценивать структурные свойства кортикальной части кости, её размер и форму. Разработаны методические рекомендации по оппортунистическому скринингу остеопороза с использованием автоматизированной оценки объёмной МПК тел позвонков с помощью алгоритмов искусственного интеллекта и фантомного моделирования [18].
Имеются данные ROC-анализа, сопоставляющие показатели МПК по результатам количественной КТ и ДРА. Так, у пациентов с остеопоротическими переломами позвонков МПК по данным количественной КТ показывает чуть лучшие показатели [площадь под ROC-кривой (AUC)=0,802], чем аналогичные показатели в соответствии с результатами ДРА (AUC=0,76). Подобные результаты получены при анализе подгрупп только пациентов женского пола (AUC=0,798 против AUC=0,748 соответственно), но не в подгруппе пожилых пациентов мужского пола (AUC=0,779 против AUC=0,780 соответственно) [19].
Несмотря на то что количественная КТ позволяет получать информацию о риске переломов, она имеет некоторые ограничения. Её считают более дорогостоящей методикой, чем ДРА, а также она обладает высокой дозой облучения, поэтому исследования нельзя часто повторять. Кроме того, для её проведения необходима калибровка с использованием внешнего фантома или тканей тела пациента. С этой целью при проведении количественной КТ под тело человека помещают фантом (phantom-based QCT — PB-QCT). Однако возможно осуществление безфантомной количественной КТ (phantom-less QCT — PL-QCT), где калибровку производят с помощью тканей тела, таких как жир и мышцы, а не одного внешнего фантома [20]. Разработаны рентгеноконтрастные шаблоны, позволяющие стандартизировать денситометрические показатели для конусно-лучевых и различных мультисрезовых компьютерных томографов — в среднем разброс после кросс-калибровки снижается в 10 раз, что обеспечивает возможность классификации костной ткани в единицах Хаунсфилда (HU) по классификации С. Misch [21]. Следует отметить, что количественная КТ, как и ДРА, не чувствительна к изменениям в коллагеновом матриксе кости. Её проведение считают полезней для получения информации о качестве кости, чем ДРА (особенно микротомография). Однако из-за отмеченных недостатков оба метода без корректировок, учитывающих специфическую структурную деградацию кости, только в соответствии с показателями МПК имеют существенные ограничения в отношении предсказания риска переломов [22].
Кроме того, для установления диагноза остеопороз используют алгоритм FRAX, применяемый у женщин в постменопаузе и мужчин 50 лет и старше. Он позволяет определить вероятность перелома в течение ближайших 10 лет. Результатом подсчёта является 10-летняя вероятность основных остеопоротических переломов, в частности проксимального отдела бедренной кости. В алгоритме FRAX у пациента учитывают возраст, пол, массу тела, рост, а также такие факторы риска, как:
- наличие или отсутствие перелома;
- анамнез перелома бедренной кости у родителей;
- вредные привычки — курение, употребление алкоголя;
- приём глюкокортикоидов;
- установленный диагноз ревматоидный артрит — заболевание, имеющее доказанную ассоциацию с остеопорозом.
Плюс ко всему необходимо брать во внимание показатели МПК шейки бедренной кости и трабекулярного косного индекса. Модели алгоритма FRAX разработаны на основе результатов популяционных исследований, проведённых в Европе, Северной Америке, Азии и Австралии. В усовершенствованном виде инструмент FRAX компьютеризирован, общедоступен и представлен на соответствующем сайте (https://fraxplus.org/). Рекомендовано устанавливать диагноз остеопороза и назначать лечение пациентам c высокой индивидуальной 10-летней вероятностью основных патологических переломов в соответствии с результатом оценки FRAX независимо от данных ДРА поясничного отдела позвоночника или проксимального отдела бедренной кости [13]. Алгоритм определения факторов риска FRAX является полезным инструментом для выявления остеопороза, однака он имеет основное ограничение в виде отсутствия дополнительной информации о составе самой кости [23].
Следует отметить, что его эффективность в оценке остеопоротических переломов достаточно низкая и вариабельная. По данным систематического обзора, включавшего в итоговой группе 40 публикаций [24], определено, что AUC для крупных остеопоротических переломов при использовании алгоритма FRAX в группе женщин и мужчин с учётом показателя МПК составила 57–88 [95% ДИ (доверительный интервал) 41–88] и без его учёта — 55–81 (95% ДИ 55–85). Ещё более низкие показатели чувствительности и специфичности выявлены для российской модели алгоритма FRAX: 42 и 74% соответственно. Однако следует отметить, что с учётом показателей МПК чувствительность уменьшилась до 28%, а специфичность, наоборот, увеличилась до 84% [25].
Таким образом, используя ДРА и алгоритм FRAX, на практике клиницисту достаточно сложно оценить вероятность возникновения низкоэнергетических переломов. Именно поэтому корректировка методов для повышения эффективности их прогнозирования с привлечением дополнительных данных о структуре кости повысила бы точность предсказания. Одним из походов, реализующих данное направление, является радиомический анализ.
ЧТО ТАКОЕ РАДИОМИКА?
Радиомика ― развивающаяся область медицинских исследований, включающая преобразование цифровых медицинских изображений в их извлекаемые количественные показатели на основе интенсивности сигнала, формы, объёма и текстурных особенностей [12]. Количественные показатели — это радиомические признаки (паттерны). Они отражают характеристики тканей и очагов поражения, такие как гетерогенность и форма, и их возможно, отдельно или в сочетании с демографическими, гистологическими, геномными или протеомными данными, использовать для решения клинических задач.
Как правило, интерпретация рентгенологических изображений характеризуется качественной оценкой, основанной на опыте и склонной к субъективности, или простыми суммарными показателями, такими как диаметр поражения или метаболическая активность. В ходе диагностических исследований из них извлекают лишь малую часть всей количественной информации. Область радиомики сосредоточена на извлечении количественных характеристик из цифровых изображений, которые преобразуют их в доступные для анализа данные. Основная гипотеза заключается в том, что эти особенности отражают лежащую в их основе биологию, но незаметны при традиционном визуальном осмотре в современной радиологической практике [26].
Теория, составляющая фундамент радиомики, впервые разработана для оценки результатов аэрофотосъёмки ещё до её широкого применения в медицине с целью решения широкого спектра задач анализа изображений [27]. Несмотря на то что раннее изучение включало использование потенциала радиомики в диагностике ревматических заболеваний сердца и классификации лёгочных заболеваний с помощью рентгенограмм грудной клетки [28], большую часть радиомических моделей в более поздних разработках применяют в онкологии [12]. Она изначально развивалась как направление молекулярной биологии. Однако с появлением высокопроизводительных технологий расчётов, достижений в области машинного обучения и искусственного интеллекта, а также с ростом вычислительных мощностей, достаточных для обработки больших потоков информации, стало возможным извлекать сложно структурированные данные из таких объектов, как дезоксирибонуклеиновая и рибонуклеиновая кислоты, ассоциированных белков и специфических биохимических процессов. Радиомика, в отличие от других методов, основана на радиологической визуализации и выявлении индивидуальных паттернов по данным цифровых изображений, а не на инвазивной биопсии или молекулярном анализе. Радиомический анализ проводят с использованием изображений, полученных с помощью стандартного оборудования для визуализации, в один или несколько моментов времени в ходе обычного диагностического исследования пациента. Нет необходимости проводить дополнительную визуализацию, поскольку в идеале радиомический метод охватывает все визуальные признаки заболевания, принимая во внимание различия или гетерогенность очагов между собой. Максимальную эффективность радиомики достигают при её интеграции с другими данными по интересующему заболеванию или патологии. Модели, объединяющие радиомические характеристики с геномной и клинико-патологической информацией, показали улучшение прогнозирования исхода заболевания [29].
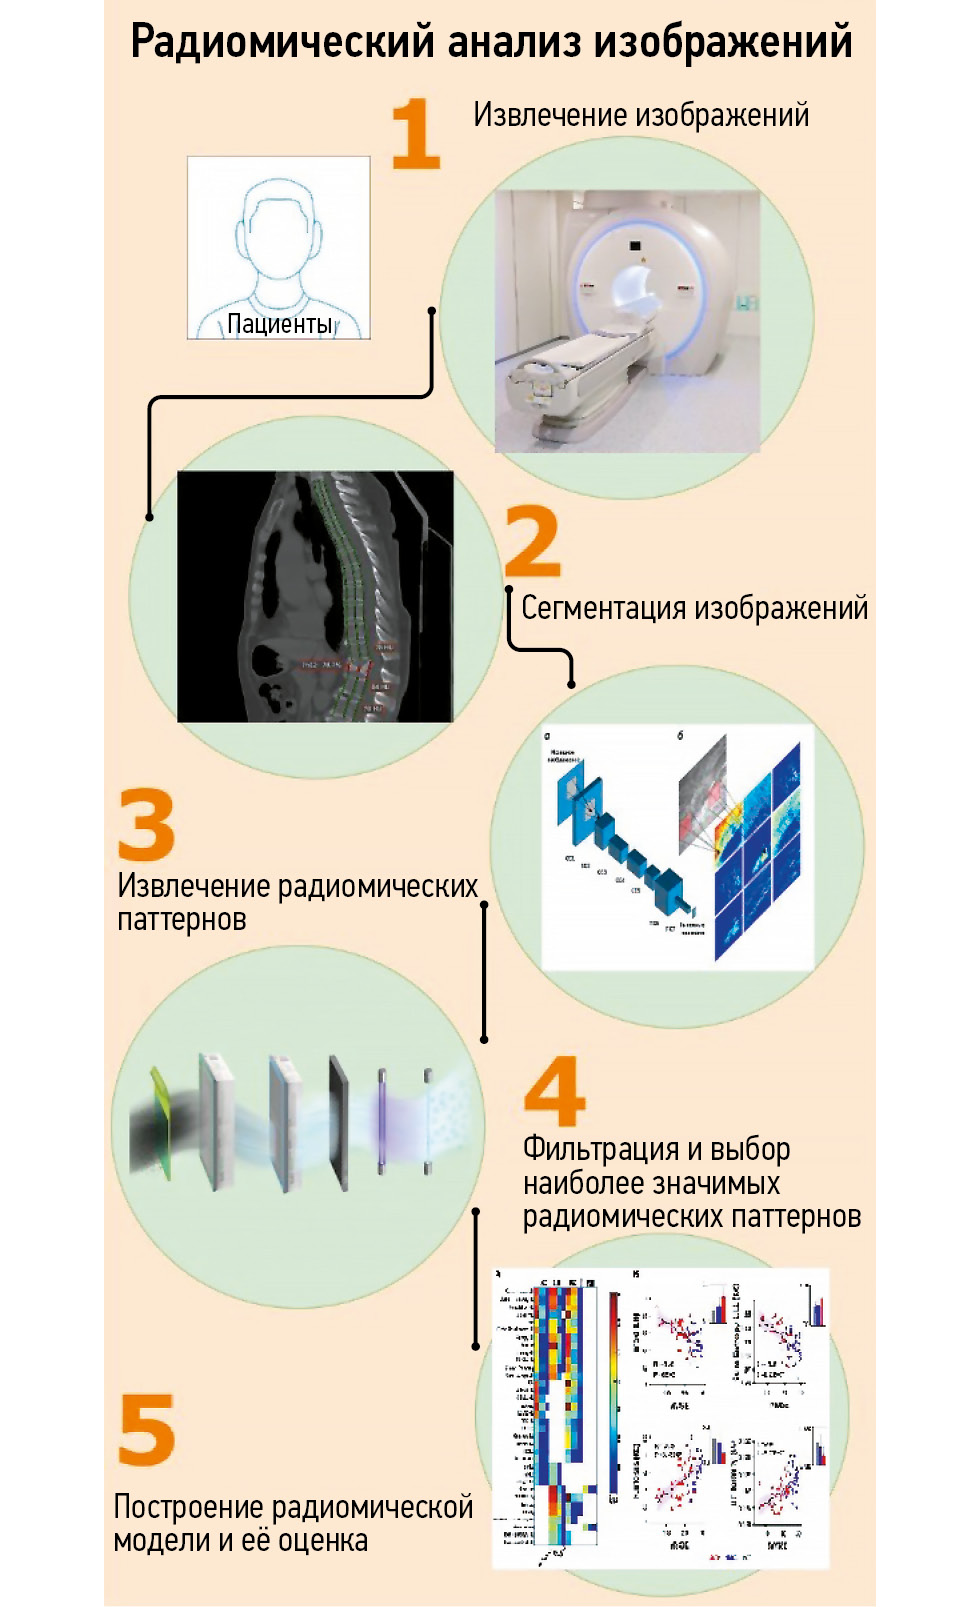
Радиомический анализ изображений состоит из нескольких этапов (рис. 1). Его возможно выполнить с помощью изображений различных модальностей, однако в опубликованной литературе преобладают работы, посвящённые их получению при проведении КТ или МРТ. Существует исследование, в котором проводят сравнительный анализ радиомических номограмм, полученных с помощью двухэнергетической КТ и ДРА [30]. Множество факторов, связанных с получением изображений, потенциально влияют на извлечённые радиомические паттерны, включая аппаратное обеспечение (марка и модель сканера), параметры настроек аппаратуры при получении изображений (напряжение и ток трубки для КТ, напряжённость поля и последовательность импульсов для МРТ, введение контрастного вещества для любой из методик) и реконструкции (фильтры, размер вокселя). Перечисленные факторы считают ограничением метода [31].

Рис. 1. Основные этапы радиомического анализа изображений.
Прежде чем приступить к анализу, изображения необходимо подвергнуть сегментации, представляющей собой процесс выделения областей, из которых будут извлекать радиомические паттерны. Интересующая область зависит от целей исследования — опухоль на изображениях КТ или МРТ, изменения на рентгенограммах. Одним из ключевых ограничений радиомики считают трудоёмкость ручной сегментации изображения, выполняемой специалистом-радиологом. Наблюдают растущий интерес к использованию автоматизированной или полуавтоматизированной с ручной коррекцией сегментации на основе искусственного интеллекта и машинного обучения [32]. Инструменты сегментации на основе искусственного интеллекта могут быть менее точными, чем ручная сегментация. Данный факт связан с высокой гетерогенностью внешнего вида опухолей, шума изображений и артефактов [33]. Для их сегментации и извлечения радиомических данных доступно множество пакетов программного обеспечения, включая версии с открытым исходным кодом и проприетарные версии. В качестве примеров можно привести 3D Slicer (3D Slicer community, https://www.slicer.org/), Microsoft advanced image labeller [project InnerEye, Microsoft, Редмонд, Вашингтон, Соединённые Штаты Америки (США)] и программное обеспечение MIM (MIM Software, Кливленд, Огайо, США).
Радиомика позволяет количественно оценивать такие особенности, как размер, форма и контрастность очага поражения, и математически выделять «агностические» особенности, которые нелегко уловить человеческому глазу, например особенности гистограммы и анализ текстуры. Анализ формы способен включать в себя простые описания размеров, однако существует возможность извлекать и более сложные топологические характеристики, такие как округлость, компактность, остроконечность или выпуклость. Текстурные характеристики описывают статистические взаимосвязи интенсивностей элементов объёмного изображения (вокселей) в пределах области интереса [34].
Возможно выделить множество радиомических признаков, однако лишь относительно небольшая их часть внесёт существенный вклад в радиомическую модель. Уменьшение размерности — это процесс, с помощью которого определяют наиболее важные радиомические паттерны. Этот шаг необходим для того, чтобы оставить только значимые диагностические признаки и удалить остальные как лишний шум [35]. Для сокращения обычно включают механизмы выбора паттернов, такие как ранжирование по математическим критериям (коэффициенты внутриклассовой корреляции) или ранжирование объектов по показателям важности.
В радиомическом анализе возможно применять как контролируемое, так и неконтролируемое уменьшение радиомических паттернов. В неконтролируемых методах признаки удаляют на основе их взаимосвязи (корреляции) с другими признаками, не зависящими от прогностической ценности [36]. При контролируемом подходе радиомическую модель приводят в соответствие с целевой переменной или к конечной точке исследования, например гистологии опухоли или прогрессированию заболевания, и, как правило, она включает в себя наиболее эффективные радиомические характеристики [37].
Контролируемые модели обучают на множестве доступных изображений, называемых «обучающими» данными. Затем точность и обобщаемость модели оценивают с помощью валидационного тестирования. Существует два типа подхода к валидации. Первый подход — внутренняя проверка использует аналогичные данные, на основе которых получена модель. Популярным его примером считают перекрёстную проверку. Исходный набор данных делят на две части, а модель разрабатывают на обучающем подмножестве и тестируют на оставшихся данных. Для выборки меньшего размера обычно выполняют перекрёстную проверку, при которой данные разбивают на несколько групп и в дальнейшем последовательно используют для обучения, а также проверки модели [38]. Второй подход — внешняя валидация, при которой данные, используемые для проверки работоспособности модели, структурно отличаются от данных, применяемых для обучения модели, и обычно они получены в отдельном учреждении в другом регионе [39].
В КАКИХ ОБЛАСТЯХ КЛИНИЧЕСКОЙ МЕДИЦИНЫ ЧАЩЕ ВСЕГО ИСПОЛЬЗУЮТ РАДИОМИЧЕСКИЙ АНАЛИЗ ИЗОБРАЖЕНИЙ?
Радиомические методы анализа преобладают в исследованиях в области онкологии. Инструменты радиомики использовали в работах, связанных со скринингом, выявлением, диагностикой, стадированием и исходом заболеваний, поиском и прогнозированием биологических корреляций, реакций на лечение, а также в исследованиях, которые позволяют расширить наш кругозор в отношении ключевых онкогенных процессов [40].
Точное определение биологических подтипов опухолей имеет первостепенное значение для выбора онкологического лечения, но может быть ограничено доступом к достаточному количеству диагностических тканей и гетерогенностью опухоли. Использование радиомики для прогнозирования ключевых гистотипов достаточно широко описано для различных типов опухолей [41].
В последние годы наблюдают увеличение исследований в области радиомики с целью прогнозирования молекулярных биомаркёров реакции на ингибиторы иммунных контрольных точек, что связано с ростом их популярности [42].
Предоперационное стадирование — ещё одна область применения радиомики. По данным МРТ возможно определить стадию рака головы и шеи [43], в то время как данные текстурного анализа КТ показали значительную связь с общей стадией первичной опухоли при раке лёгких [44].
Исследования клинической пользы радиомики расширены и включают в себя прогнозирование реакции на конкретные методы лечения рака. Прогнозирование патологического и/или рентгенологического ответа на неоадъювантную химиотерапию или химиолучевую терапию с использованием МРТ-радиомики широко изучали при раке молочной железы [45] и прямой кишки [46], при опухолях шейки матки [47], а также головы и шеи [48]. Результаты КТ использованы в отношении прогнозирования ответа на химиотерапию первой линии при опухолях желудка, мочевого пузыря, лёгких и яичников, а также для оценки ответа на неоадъювантную химиолучевую терапию при раке пищевода и лёгких.
Для оценки эффективности лечения стала популярна дельта-радиомика. Она измеряет изменения характеристик изображений с течением времени, обычно до и после терапии. С её помощью возможно выявить едва заметные ранние изменения опухоли, предшествующие измеримым изменениям в размерах. Именно поэтому дельта-радиомику потенциально рассматривают в качестве дополнительного инструмента для повторной оценки прогресса или регресса заболевания. Её используют для оценки эффективности лечения при опухолях головного мозга, головы и шеи, лёгких, желудочно-кишечного тракта, толстой кишки, молочной и предстательной желёз, почек и других злокачественных новообразованиях [49].
ПРИМЕНЕНИЕ РАДИОМИЧЕСКОГО АНАЛИЗА ДЛЯ ОЦЕНКИ РИСКА ПЕРЕЛОМОВ ПОЗВОНКОВ
Радиомику также применяют для выявления пациентов с высоким риском патологических переломов различной локализации по текстурным характеристикам, заключённым в самих изображениях [50–54]. Согласно этим предварительным данным, радиомические паттерны, извлечённые из изображений КТ и МРТ, способны улучшить оценку структуры кости и обеспечить оценку риска переломов независимо — более точно, чем с помощью оценки минеральной плотности по данным ДРА.
Радиомический анализ с успехом применён для повышения точности КТ в отношении предсказания риска переломов, обусловленных остеопорозом. Сообщают об автоматизированном конвейере обработки изображений КТ, который позволяет повысить эффективность выделения пациентов с остеопоротическими переломами (AUC=0,88 с использованием данных объёмной МПК и пяти текстурных признаков; AUC=0,64 только при использовании показателей МПК) [52]. В данном исследовании первоначально проанализировано 5 текстурных признаков у 154 пациентов с онкологическими заболеваниями без метастазирования в позвонки, из которых у 51 — отмечены компрессионные переломы.
В другой публикации сообщают о выделенных 12 характерных текстурных радиомических признаков из 1040 [55]. На основе полученных паттернов создана специфическая комбинация, обеспечивающая повышение эффективности разделения 386 отдельных позвонков для выборки из 99 пациентов, из которых у 34 — установлен остеопороз по данным ДРА. Отмечено увеличение AUC c 0,84 до 0,92 для тестового набора позвонков (116 из 386). Стоит подчеркнуть, что в работе использовано программное обеспечение 3D slicer pyradiomics module [56].
Недавно предложен оригинальный метод радиомического анализа при метастатическом поражении тел позвонков в совместной российско-немецкой работе [57]. По данным МРТ получены устойчивые текстурные признаки, сопровождающие морфологические изменения тел позвонков при лечении пациенток с метастазами рака молочной железы в динамике. Радиомический анализ выполнен на основе результатов исследования трёх пациентов и включал в себя следующие этапы:
- анализ текстуры нативных изображений;
- анализ изменений при контрастном усилении;
- анализ микрофокусов, или микроочагов (кальдер).
ИСПОЛЬЗОВАНИЕ РАДИОМИЧЕСКОГО АНАЛИЗА ДЛЯ ВЫЯВЛЕНИЯ ОСТЕОПОРОЗА
Одно из самых крупных исследований по охвату пациентов на тему применения текстурного анализа для выявления остеопороза проведено S. Kim и соавт. [58] и опубликовано в 2022 году. Радиомическая модель с применением машинного обучения разработана с использованием 4924 рентгенограмм тазобедренного сустава, полученных при проведении обследования 4308 пациентов (3632 женщины, средний возраст составил 62±13 лет). Исследование проведено в крупном госпитале Южной Кореи в период с сентября 2009 г. по апрель 2020 г. T-критерий, измеренный с помощью ДРА, использован в качестве эталона для определения остеопороза. Разработаны семь радиомических моделей, сочетавших в себе различные типы функций. Для независимого тестирования модели использованы в общей сложности 444 рентгенограммы тазобедренного сустава, полученные в период с января 2019 г. по апрель 2020 г. из другого учреждения. С целью оценки эффективности диагностики оценивали значение AUC. Радиомическая модель на основе машинного обучения с клиническими и текстурными признаками показала самую высокую диагностическую эффективность из изученных семи моделей, при использовании внешнего независимого тестирования — AUC=0,95. Результаты этого исследования показали, что радиомические модели, созданные на основе рентгенограмм тазобедренного сустава, с применением машинного обучения возможно использовать для диагностики остеопороза. Авторы полагают, что их радиомическая модель демонстрирует высокую диагностическую эффективность и целесообразность использования в качестве альтернативного инструмента для отбора пациентов с риском развития остеопороза с целью проведения дальнейших подтверждающих тестов, включая ДРА. Её чувствительность, полученная по тестовому набору, составила 89% (66 из 74), а большинство ложноположительных результатов связаны с группой остеопении (61 из 64). Результаты, полученные среди пациентов с нормальным значением МПК, показали, что частота ложноположительных результатов составила всего 2% (3 из 143). Кроме того, это исследование показало, что радиомическая модель на основе машинного обучения обладает способностью к обобщению с точки зрения внешней валидации. Тем не менее авторы отмечают, что радиомические модели на основе рентгеновских изображений обладают ограничениями: радиомические паттерны извлекают из ограничивающей рамки, содержащей как проксимальный отдел бедренной кости, так и прилегающую область мягких тканей. Данный факт считают существенным ограничением изображений, проецирующих трёхмерные анатомические структуры в двухмерную плоскость, когда трудно полностью удалить накладывающиеся друг на друга мягкие ткани непосредственно спереди и сзади от области интереса — костной ткани.
Научные публикации о применении радиомичекого анализа в отношении изображений КТ с целью выявления остеопороза опубликованы учёными из Китая. Так, J. Wang и соавт. [59] разработали и валидировали клинико-радиомическую модель, основанную на монохроматической визуализации с помощью двух-энергетической КТ с одним источником, для прогнозирования остеопороза. 164 пациентам выполнена как двухэнергетическая КТ с одним источником, так и количественная КТ поясничного отдела позвоночника. Данные пациенты разделены на две группы:
- 1-я группа — с «обучающим» набором данных [n=114 (30 пациентов с остеопорозом и 84 — без остеопороза)];
- 2-я группа — с валидационным набором данных [n=50 (12 пациентов с остеопорозом и 38 — без остеопороза)].
Из монохроматических изображений КТ извлечены 107 радиомических признаков. Используя количественную КТ в качестве эталонного стандарта, радиомическая сигнатура построена с помощью метода наименьшей абсолютной усадки и регрессии с учётом оператора выбора (LASSO) на основе воспроизводимых признаков. Клинико-радиомическая модель построена путём включения радиомической характеристики и значимого клинического предиктора (возраста) с применением многомерного логистического регрессионного анализа. Эффективность данной модели оценивали по её калибровке, распознаванию и клинической полезности. Радиомическая сигнатура показала хорошую калибровку и распознавание как при обучении, так и при валидации. Клинико-радиомическая модель, включавшая радиомическую характеристику и значимый клиникодемографический предиктор (возраст), также показала хорошую дискриминацию: AUC в обучающей когорте составила 0,938 [95% ДИ 0,903–0,952], а в группе валидации — 0,988 [95% ДИ 0,967–0,998].
Q. Xie и соавт. [60] разработали и апробировали радиомическую модель, основанную на результатах количественной КТ, для распознавания остеопороза и остеопении. Ретроспективно обследовано 635 пациентов, которым проведено данное исследование. Пациенты с остеопенией или остеопорозом (n=590) разделены на обучающую (n=414) и тестовую группы (n=176). Радиомические паттерны извлечены из изображений количественной КТ позвонка LIII. С целью построения комбинированной клинико-радиомической модели для диагностики остеопороза и остеопении выбраны шесть прогностических радиомических признаков и клинические факторы риска, такие как возраст, активность щелочной фосфатазы и содержание гомоцистеина. AUC комбинированной клинико-радиомической модели в обучающей когорте составила 0,96 [95% ДИ 0,95–0,98] и в тестируемой — 0,96 [95% ДИ 0,92–1,00].
Опубликовано исследование, результаты которого показывают, что из изображений МРТ также возможно извлечь радиомические паттерны, свидетельствующие о наличии остеопороза. Так, D. Martel и соавт. [61] оценивали состояние костей по данным МРТ проксимального отдела бедренной кости с помощью радиомического анализа. МРТ провели 45 женщинам с остеопорозом (15 — с переломами в анамнезе; 30 — без переломов в анамнезе) при использовании последовательности 3D-снимков с высоким разрешением и индукцией магнитного поля 3 Tл. Радиомические признаки рассчитаны в трабекулярной области проксимального отдела бедренной кости по Т1-взвешенным изображениям (ВИ) из представленного набора данных. Значимость прогностической способности признака измерена с помощью критерия Вилкоксона и ROC-анализа. Признаки сопоставлены с результатами ДРА и алгоритмом FRAX. Цель исследователей состояла в том, чтобы дать фундаментальное представление об основных радиомических паттернах, имеющих решающее значение в отношении риска остеопоротических переломов. Измерение и анализ точности прогнозирования отдельных признаков способен помочь более эффективно использовать набор данных, а не создавать мультипараметрическую модель машинного обучения. Корреляция между радиомическими паттернами и показателями, полученными при проведении ДРА и использовании алгоритма FRAX, отмечена в диапазоне от слабой до умеренной, но исследователи в своих выводах полагают, что радиомические паттерны позволяют оценить состояние костей по данным МРТ проксимального отдела бедренной кости и потенциально предсказать перелом.
T. Zhen и соавт. [62] провели ретроспективный радиомический анализ изображений 160 пациентов, полученных с помощью ДРА и МРТ поясничного отдела позвоночника. Среди них у 86 пациентов диагностирован низкий показатель МПК, соответствующий остеопорозу, а у 74 — нормальный. Сагиттальные Т1- и Т2-ВИ всех пациентов импортированы на исследовательский портал uAI (United Imaging Intelligence) для определения границ изображений и радиомического анализа, позволивший получить ряд радиомических паттернов. Радиомическая модель, включающая последовательности T1-ВИ, T2-ВИ и T1-ВИ+T2-ВИ, создана с использованием признаков, выбранных с помощью регрессии LASSO. Проведён анализ ROC-кривой для оценки прогностической эффективности каждой модели в отношении выявления костных аномалий и анализ кривой принятия решений (DCA) для оценки качеств каждой модели. Кроме того, модель проверена на выборке, включавшей 35 пациентов из других медицинских учреждений. Радиомическая модель на основе признаков, извлечённых из Т1+Т2 ВИ, показала лучшие результаты скрининга пациентов с низким значением МПК. В тренировочной группе чувствительность и специфичность составили 0,758 и 0,78 соответственно, а точность — 0,768 (AUC=0,839 [95% ДИ 0,757–0,901]). В контрольной группе чувствительность и специфичность составили 0,792 и 0,875 соответственно, а точность — 0,833 (AUC=0,86 [95% ДИ 0,73–0,943]). Анализ DCA также показал, что комбинированная модель более точная. В группе внешней валидации чувствительность и специфичность составили 0,764 и 0,833 соответственно, а точность — 0,8 (AUC=0,824 [95% ДИ 0,678–0,969]). Исследователи считают, что радиомический анализ возможно использовать для количественной оценки результатов МРТ и точного скрининга пациентов с низким значением МПК.
В табл. 1 представлена краткая характеристика публикаций, включённых в обзор, о применении структурного анализа в диагностике остеопороза. Большинство публикаций об использовании радиомического анализа посвящено его применению в диагностике онкологических заболеваний. Интерес к использованию радиомического анализа с целью выявления неонкологических заболеваний, в частности остеопороза, наблюдают только в последнее время — самая ранняя работа по данной теме опубликована в 2022 году (см. табл. 1). Исследование с самым большим числом пациентов описывает использование радиомического анализа при рентгеновских исследованиях, но самые последние публикации рассматривают его применение в отношении выявления остеопороза по изображениям КТ и МРТ. В публикациях, перечисленных в таблице (см. табл. 1), авторы высказывают мнение, что радиомический анализ для выявления остеопороза имеет не меньшие перспективы, чем исследования об использовании текстурного анализа в отношении диагностики онкологических заболеваний.
Таблица 1. Краткая характеристика включённых в обзор публикаций на тему применения радиомического анализа в диагностике остеопороза
Авторы | Год | Страна | Цель | Модальность | Число пациентов | Точность |
S. Kim и соавт. [58] | 2022 | Южная Корея | Разработать и апробировать радиомические модели для диагностики остеопороза с использованием рентгенограмм тазобедренного сустава | Рентгенография | 4308 | · AUC=0,95 |
J. Wang и соавт. [59] | 2023 | Китай | Разработать и валидировать клинико-радиомическую модель, основанную на результатах КТ, для прогнозирования остеопороза | КТ | 164 | · AUC=0,938; AUC=0,988 |
Q. Xie и соавт. [60] | 2022 | Китай | Разработать и валидировать радиомическую модель, основанную на результатах количественной КТ, для распознавания остеопороза и остеопении | КТ | 635 | · AUC=0,95 |
D. Martel и соавт. [61] | 2023 | США | Проанализировать получаемые радиомические признаки и способность их выделения у пациентов с остеопоротическими переломами и без них | МРТ | 45 | · AUC DNU=0,751, p <0,05; · AUC LGLE=0,729, p <0,05; · AUC Kurtosis=0,718, p <0,05 |
T. Zhen и соавт. [62] | 2024 | Китай | Сравнить эффективности радиомических паттернов, извлечённых из изображений МРТ, полученных при использовании её различных последовательностей (T1-ВИ, T2-ВИ, T1-ВИ+T2-ВИ), для выявления остеопороза у пациентов | МРТ | 160 | · AUC=0,839; · AUC=0,86; · AUC=0,824 |
Примечание. США — Соединённые Штаты Америки; КТ — компьютерная томография; МРТ — магнитно-резонансная томография; ВИ — взвешенное изображение; AUC — площадь под кривой; DNU — зависимость неравномерности; LGLE — подчёркивание низкого уровня серого. | ||||||
ОГРАНИЧЕНИЯ И ПЕРСПЕКТИВЫ
Исследования на тему радиомического анализа изображений в основном сосредоточены на применении его в онкологии. Однако сейчас существуют публикации об использовании текстурного анализа к изображениям для выявления неонкологических заболеваний, в том числе для скрининга и диагностики остеопороза. Следует отметить, что данное направление считают перспективным. До возникновения опасных клинических проявлений, выражающихся в остеопоротических переломах, диагноз остеопороз клиницисту установить сложно. В отличии от других метаболических заболеваний (например, при подозрении на сахарный диабет доступен относительно простой анализ глюкозы плазмы крови), не существует методов лабораторной диагностики остеопороза и его патогномоничных клинических признаков. В онкологии радиомический анализ используют для получения количественных данных и часто при наличии качественных, в то время как в случае остеопороза у клинициста нет ни количественных, ни качественных данных. Рентгенолог или онколог при визуальном анализе изображений МРТ или КТ способны зафиксировать факт наличия опухоли, её прогресс или регресс (качественные данные), однако в случае диагностики остеопороза такой возможности нет — при наличии остеопороза без остеопоротических переломов.
Тем не менее существует ДРА, которую считают «золотым стандартом» диагностики остеопороза. Она позволяет установить данную патологию при выявлении T-критерия −2,5 SD и ниже. Однако результаты, получаемые с помощью ДРА, являются расчётным показателем, а большинство остеопоротических переломов возникают уже при остеопении — при значении Т-критерия от −1,0 до −2,5 SD [4–8].
Кроме того, ДРА считают дорогим метод исследования, а недостаточность диагностического оборудования для её проведения зафиксирована не только в РФ, но и в развитых странах, в том числе в США [15]. Именно поэтому, поиск альтернативных методов для выявления остеопороза, а также получение количественных данных вызывает в последние годы интерес к радиомике.
Существует база данных, которая содержит 120 записей результатов КТ с признаками остеопороза позвоночника и без них, она предназначена для оценки точности систем автоматического анализа диагностических изображений КТ1. Активное внедрение технологий искусственного интеллекта в сферу здравоохранения, которое мы наблюдаем в последние годы, способствует резкому росту количества медицинских данных, собираемых для разработки моделей машинного обучения, в том числе результатов лучевой и инструментальной диагностики. Для решения различных задач в области цифровых медицинских технологий посредством алгоритмов машинного обучения создают всё новые и новые наборы данных, поэтому становятся актуальными проблемы их систематизации и стандартизации, хранения, доступа, рационального и безопасного использования [63]. Однако необходимы качественные данные для разработки и валидации систем радиомического анализа остеопороза.
ЗАКЛЮЧЕНИЕ
Таким образом, отмечено ограниченное количество исследований, направленных на изучение возможностей радиомического анализа в отношении выявления остеопороза. В некоторых крупных исследованиях получены результаты, которые по точности установления остеопороза коррелируют с данными T-критерия, измеренного с помощью ДРА, в качестве эталона. В условиях существующей системы здравоохранения практическое использование радиомического анализа считают перспективным, поскольку существуют большие базы данных необработанных изображений КТ и МРТ. Именно поэтому при необходимом уровне автоматизации процесса возможно получить новые данные и улучшить методики выявления остеопороза. Необходимо дальнейшее продолжение исследований в области изучения потенциала радиомического анализа с использованием изображений КТ и МРТ для выявления остеопороза в сравнении с признанными методиками — ДРА и алгоритмом FRAX. Не менее многообещающими выглядят перспективы применения радиомического анализа для прогнозирования остеопоротических переломов, особенно в сравнении полученных данных со значением трабекулярного костного индекса.
ДОПОЛНИТЕЛЬНАЯ ИНФОРМАЦИЯ
Источник финансирования. Данная статья подготовлена авторским коллективом в рамках научно-исследовательской работы «Научное обоснование методов лучевой диагностики опухолевых заболеваний с использованием радиомического анализа» (№ ЕГИСУ: 123031500005-2) в соответствии с Приказом Департамента здравоохранения г. Москвы от 21 декабря 2022 г. № 1196 «Об утверждении государственных заданий, финансовое обеспечение которых осуществляется за счёт средств бюджета города Москвы государственным бюджетным (автономным) учреждениям, подведомственными Департаменту здравоохранения города Москвы, на 2023 год и плановый период 2024 и 2025 годов».
Раскрытие интересов. Авторы заявляют об отсутствии отношений, деятельности и интересов (личных, профессиональных или финансовых), связанных с третьими лицами (коммерческими, некоммерческими, частными), интересы которых могут быть затронуты содержанием статьи, а также иных отношений, деятельности и интересов за последние три года, о которых необходимо сообщить.
Вклад авторов. А.И. Чугаев — обзор литературы, сбор и анализ литературных источников, написание и редактирование текста статьи; А.В. Петряйкин, И.А. Блохин — сбор и анализ литературных источников, написание текста статьи; А.В. Владзимирский, Ю.А. Васильев, О.В. Омельянская — редактирование статьи. Все авторы одобрили рукопись (версию для публикации), а также согласились нести ответственность за все аспекты работы и гарантировали, что вопросы, связанные с точностью или добросовестностью любой части работы, будут должным образом рассмотрены и решены.
ADDITIONAL INFORMATION
Funding source. This article was prepared by a group of authors as a part of the research and development effort titled "Scientific evidence for using radiomics-guided medical imaging to diagnose cancer" (USIS No. 123031500005-2) in accordance with the Order of the Moscow Health Care Department No. 1196 dated December 21, 2022 "On approval of state assignments funded by means of allocations from the budget of the city of Moscow to the state budgetary (autonomous) institutions subordinate to the Moscow Health Care Department, for 2023 and the planned period of 2024 and 2025".
Disclosure of interests. The authors declare that they have no relationships, activities or interests (personal, professional or financial) with third parties (commercial, non-commercial, private) whose interests may be affected by the content of the article, as well as no other relationships, activities or interests over the past three years that must be reported.
Authors’ contribution. А.I. Chugaev: literature review, collection and analysis of literature data, writing and editing the article; A.V. Petryaikin, I.A. Blokhin: collection and analysis of literature data, writing the text of the article; Yu.A. Vasilev, A.V. Vladzymyrskyy, O.V. Omelyanskaya editing the article. Thereby, all authors provided approval of the version to be published and agree to be accountable for all aspects of the work in ensuring that questions related to the accuracy or integrity of any part of the work are appropriately investigated and resolved.
1 Васильев Ю.А., Туравилова Е.В., Владзимирский А.В., и др. Свидетельство о государственной регистрации базы данных № 2023621171 Российская Федерация. MosMedData: КТ с признаками остеопороза позвоночника: № 2023620784: заявл. 24.03.2023: опубл. 11.04.2023. EDN: SHLWTC
About the authors
Anton I. Chugaev
Research and Practical Clinical Center for Diagnostics and Telemedicine Technologies; MRI24
Author for correspondence.
Email: chugaev020379@yandex.ru
ORCID iD: 0009-0006-8930-9320
Russian Federation, Moscow; Moscow
Yuriy A. Vasilev
Research and Practical Clinical Center for Diagnostics and Telemedicine Technologies
Email: VasilevYA1@zdrav.mos.ru
ORCID iD: 0000-0002-5283-5961
SPIN-code: 4458-5608
MD, Cand. Sci. (Medicine)
Russian Federation, MoscowAlexey V. Petraikin
Research and Practical Clinical Center for Diagnostics and Telemedicine Technologies
Email: alexeypetraikin@gmail.com
ORCID iD: 0000-0003-1694-4682
SPIN-code: 6193-1656
MD, Dr. Sci. (Medicine)
Russian Federation, MoscowIvan A. Blokhin
Research and Practical Clinical Center for Diagnostics and Telemedicine Technologies
Email: i.blokhin@npcmr.ru
ORCID iD: 0000-0002-2681-9378
SPIN-code: 3306-1387
MD, Cand. Sci. (Medicine)
Russian Federation, MoscowAnton V. Vladzymyrskyy
Research and Practical Clinical Center for Diagnostics and Telemedicine Technologies
Email: VladzimirskijAV@zdrav.mos.ru
ORCID iD: 0000-0002-2990-7736
SPIN-code: 3602-7120
MD, Dr. Sci. (Medicine)
Russian Federation, MoscowOlga V. Omelyanskaya
Research and Practical Clinical Center for Diagnostics and Telemedicine Technologies
Email: OmelyanskayaOV@zdrav.mos.ru
ORCID iD: 0000-0002-0245-4431
SPIN-code: 8948-6152
Russian Federation, Moscow
References
- Kanis JA, Melton LJ, Christiansen C, et al. The diagnosis of osteoporosis. Journal of Bone and Mineral Research. 1994;9(8):1137–1141. doi: 10.1002/jbmr.5650090802
- Lesnyak OM, Baranova IA, Belova KYu, et al. Osteoporosis in Russian Federation: epidemiology, socio-medical and economical aspects (review). Traumatology and Orthopedics of Russia. 2018;24(1):155–168. doi: 10.21823/2311-2905-2018-24-1-155-168 EDN: YVGNSE
- Lesnyak O, Svedbom A, Belova K, et al. Quality of life after fragility fracture in the Russian Federation: results from the Russian arm of the International Cost and Utility Related to Osteoporotic Fractures Study (ICUROS). Archives of Osteoporosis. 2020;15(1):37. doi: 10.1007/s11657-020-0699-6 EDN: ZGZODH
- LeBoff MS, Greenspan SL, Insogna KL, et al. The clinician’s guide to prevention and treatment of osteoporosis. Osteoporos Int. 2022;33(10):2049–102. doi: 10.1007/s00198-021-05900-y Corrected and republished from: Osteoporos Int. 2022;33(10):2243. doi: 10.1007/s00198-022-06479-8
- van Staa TP, Dennison EM, Leufkens HGM, Cooper C. Epidemiology of fractures in England and Wales. Bone. 2001;29(6):517–522. doi: 10.1016/s8756-3282(01)00614-7 EDN: EJUXUV
- Wainwright SA, Marshall LM, Ensrud KE, et al. Hip fracture in women without osteoporosis. J Clin Endocrinol Metab. 2005;90(5):2787–2793. doi: 10.1210/jc.2004-1568
- Schuit SCE, van der Klift M, Weel AE, et al. Fracture incidence and association with bone mineral density in elderly men and women: the Rotterdam Study. Bone. 2004;34(1):195–202. doi: 10.1016/j.bone.2003.10.001 EDN: MDSZRJ Corrected and republished from: Bone. 2006;38(4):603.
- Siris ES, Chen YT, Abbott TA, et al. Bone mineral density thresholds for pharmacological intervention to prevent fractures. Arch Intern Med. 2004;164(10):1108–1112. doi: 10.1001/archinte.164.10.1108 EDN: XTVWZS
- Fink HA, Milavetz DL, Palermo L, et al. What proportion of incident radiographic vertebral deformities is clinically diagnosed and vice versa? J Bone Miner Res. 2005;20(7):1216–1222. doi: 10.1359/JBMR.050314
- Viswanathan M, Reddy S, Berkman N, et al. Screening to prevent osteoporotic fractures: updated evidence report and systematic review for the US preventive services task force. JAMA. 2018;319(24):2532–2551. doi: 10.1001/jama.2018.6537
- Greenspan SL, Singer A, Vujevich K, et al. Implementing a fracture liaison service open model of care utilizing a cloud-based tool. Osteoporos Int. 2018;29(4):953–960. doi: 10.1007/s00198-017-4371-y EDN: PBVQEQ
- Gillies RJ, Kinahan PE, Hricak H. Radiomics: images are more than pictures, they are data. Radiology. 2016;278(2):563–577. doi: 10.1148/radiol.2015151169
- Belaya ZhE, Belova KYu, Biryukova EV, et al. Federal clinical guidelines for diagnosis, treatment and prevention of osteoporosis. Osteoporosis and Bone Diseases. 2021;24(2):4–47. doi: 10.14341/osteo12930 EDN: TUONYE
- Genant HK, Wu CY, van Kuijk C, Nevitt MC. Vertebral fracture assessment using a semiquantitative technique. J Bone Miner Res. 1993;8(9):1137–1148. doi: 10.1002/jbmr.5650080915
- Lesnyak O, Bilezikian JP, Zakroyeva A, et al. Report on the audit on burden of osteoporosis in Eight Countries of the Eurasian Region: Armenia, Belarus, Georgia, Moldova, Kazakhstan, the Kyrgyz Republic, the Russian Federation, and Uzbekistan. Archives of Osteoporosis. 2020;15(1):175. doi: 10.1007/s11657-020-00836-y EDN: UNBZCB
- Wang X, Sanyal A, Cawthon PM, et al. Prediction of new clinical vertebral fractures in elderly men using finite element analysis of CT scans. J Bone Miner Res. 2012;27(4):808–816. doi: 10.1002/jbmr.1539
- Samelson EJ, Broe KE, Xu H, et al. Cortical and trabecular bone microarchitecture as an independent predictor of incident fracture risk in older women and men in the Bone Microarchitecture International Consortium (BoMIC): a prospective study. Lancet Diabetes Endocrinol. 2019;7(1):34–43. doi: 10.1016/S2213-8587(18)30308-5 Corrected and republished from: Lancet Diabetes Endocrinol. 2019;7(1):e1. doi: 10.1016/S2213-8587(18)30345-0 Corrected and republished from: Lancet Diabetes Endocrinol. 2019;7(6):e18. doi: 10.1016/S2213-8587(19)30140-8
- Vasilev YuA, Vladzymyrskyy AV, Artyukova ZR, et al. Diagnostics and screening of osteoporosis based on the results of computed tomography of the abdominal organs: guidelines. Moscow: Moscow Center for Diagnostics and Telemedicine; 2023. (In Russ.) EDN: DXUJZD
- Lin W, He C, Xie F, et al. Quantitative CT screening improved lumbar BMD evaluation in older patients compared to dual-energy X-ray absorptiometry. BMC Geriatr. 2023;23(1):231. doi: 10.1186/s12877-023-03963-6 EDN: IMPCNF
- Liu ZJ, Zhang C, Ma C, et al. Automatic phantom-less QCT system with high precision of BMD measurement for osteoporosis screening: technique optimisation and clinical validation. J Orthop Translat. 2022;33:24–30. doi: 10.1016/j.jot.2021.11.008 EDN: ZEKPFP
- Hossain SD, Petraikin AV, Muraev AA, et al. Bone mineral density radiopaque templates for cone beam computed tomography and multidetector computed tomography. Digital Diagnostics. 2023;4(3):292–305. doi: 10.17816/DD501771 EDN: KWYJXH
- Manhard MK, Nyman JS, Does MD. Advances in imaging approaches to fracture risk evaluation. Transl Res. 2017;181:1–14. doi: 10.1016/j.trsl.2016.09.006 EDN: YWDLBD
- Kanis JA, Hans D, Cooper C, et al. Interpretation and use of FRAX in clinical practice. Osteoporos Int. 2011;22(9):2395–2411. doi: 10.1007/s00198-011-1713-z EDN: YAEETY
- Adami G, Biffi A, Porcu G, et al. A systematic review on the performance of fracture risk assessment tools: FRAX, DeFRA, FRA-HS. J Endocrinol Invest. 2023;46(11):2287–2297. doi: 10.1007/s40618-023-02082-8 EDN: KGDPNO
- Nikitinskaya OA, Toroptsova NV. Assessment of fractures risk using the FRAX® tool (a ten-year retrospective study). Almanac of Clinical Medicine. 2016;(32):50–55. doi: 10.18786/2072-0505-2014-32-50-55 EDN: SXYJPF
- McCague C, Ramlee S, Reinius M, et al. Introduction to radiomics for a clinical audience. Clinical Radiology. 2023;78(2):83–98. doi: 10.1016/j.crad.2022.08.149 EDN: FTQEEU
- Haralick RM, Shanmugam K, Dinstein I. Textural Features for Image Classification. IEEE Trans Syst Man Cybern. 1973;SMC-3(6):610–621. doi: 10.1109/TSMC.1973.4309314
- Sutton RN, Hall EL. Texture measures for automatic classification of pulmonary disease. IEEE Transactions on Computers. 1972;C-21(7):667–676. doi: 10.1109/T-C.1972.223572
- Park H, Lim Y, Ko ES, et al. Radiomics signature on magnetic resonance imaging: association with disease-free survival in patients with invasive breast cancer. Clin Cancer Res. 2018;24(19):4705–14. doi: 10.1158/1078-0432.CCR-17-3783
- Yao Q, Liu M, Yuan K, et al. Radiomics nomogram based on dual-energy spectral CT imaging to diagnose low bone mineral density. BMC Musculoskeletal Disorders. 2022;23(1):424. doi: 10.1186/s12891-022-05389-4 EDN: ZJCBIU
- Rizzo S, Botta F, Raimondi S, et al. Radiomics: the facts and the challenges of image analysis. Eur Radiol Exp. 2018;2(1):36. doi: 10.1186/s41747-018-0068-z EDN: FCYFNJ
- Zwanenburg A, Vallières M, Abdalah MA, et al. The image biomarker standardization initiative: standardized quantitative radiomics for high-throughput image-based phenotyping. Radiology. 2020;295(2):328–38. doi: 10.1148/radiol.2020191145 EDN: HZVKJN
- Corrias G, Micheletti G, Barberini L, et al. Texture analysis imaging «what a clinical radiologist needs to know». Eur J Radiol. 2022;146(2):110055. doi: 10.1016/j.ejrad.2021.110055
- Court LE, Fave X, Mackin D, et al. Computational resources for radiomics. Transl Cancer Res. 2016;5(4):340–348. doi: 10.21037/tcr.2016.06.17 EDN: POXYYB
- van Timmeren JE, Cester D, Tanadini-Lang S, et al. Radiomics in medical imaging — «how-to» guide and critical reflection. Insights Imaging. 2020;11(1):91. doi: 10.1186/s13244-020-00887-2
- Wagner MW, Namdar K, Biswas A, et al. Radiomics, machine learning, and artificial intelligence — what the neuroradiologist needs to know. Neuroradiology. 2021;63(12):1957–1967. doi: 10.1007/s00234-021-02813-9 EDN: HJQKML
- Vial A, Stirling D, Field M, et al. The role of deep learning and radiomic feature extraction in cancer-specific predictive modelling: a review. Transl Cancer Res. 2018;7(3):803–816. doi: 10.21037/tcr.2018.05.02
- García Santos JM, Plasencia Martínez JM, Fabuel Ortega P, et al. Radiology departments as COVID-19 entry-door might improve healthcare efficacy and efficiency, and emergency department safety. Insights Imaging. 2021;12(1):1. doi: 10.1186/s13244-020-00954-8 EDN: TALMZP
- Ramspek CL, Jager KJ, Dekker FW, et al. External validation of prognostic models: what, why, how, when and where? Clin Kidney J. 2021;14(1):49–58. doi: 10.1093/ckj/sfaa188 EDN: LAPIBN
- Limkin EJ, Sun R, Dercle L, et al. Promises and challenges for the implementation of computational medical imaging (radiomics) in oncology. Ann Oncol. 2017;28(6):1191–206. doi: 10.1093/annonc/mdx034
- Santos AG, da Rocha GO, de Andrade JB. Occurrence of the potent mutagens 2- nitrobenzanthrone and 3-nitrobenzanthrone in fine airborne particles. Sci Rep. 2019;9(1):1. doi: 10.1038/s41598-018-37186-2
- Gooden MJ, de Bock GH, Leffers N, et al. The prognostic influence of tumour-infiltrating lymphocytes in cancer: a systematic review with meta-analysis. Br J Cancer. 2011;105(1):93–103. doi: 10.1038/bjc.2011.189
- Ren J, Tian J, Yuan Y, et al. Magnetic resonance imaging based radiomics signature for the preoperative discrimination of stage I-II and III-IV head and neck squamous cell carcinoma. Eur J Radiol. 201;106:1–6. doi: 10.1016/j.ejrad.2018.07.002
- Aerts HJ, Velazquez ER, Leijenaar RTH, et al. Decoding tumour phenotype by noninvasive imaging using a quantitative radiomics approach. Nat Commun. 2014;5(1):4006. doi: 10.1038/ncomms5006 Corrected and republished from: Nat Commun. 2014;5:4644.
- Granzier RWY, van Nijnatten TJA, Woodruff HC, et al. Exploring breast cancer response prediction to neoadjuvant systemic therapy using MRI-based radiomics: a systematic review. Eur J Radiol. 2019;121:108736. doi: 10.1016/j.ejrad.2019.108736 EDN: VXYGTU
- Shaish H, Aukerman A, Vanguri R, et al. Radiomics of MRI for pretreatment prediction of pathologic complete response, tumor regression grade, and neoadjuvant rectal score in patients with locally advanced rectal cancer undergoing neoadjuvant chemoradiation: an international multicenter study. Eur Radiol. 2020;30(11):6263–6273. doi: 10.1007/s00330-020-06968-6 EDN: UOKLLV
- Sun C, Tian X, Liu Z, et al. Radiomic analysis for pretreatment prediction of response to neoadjuvant chemotherapy in locally advanced cervical cancer: a multicentre study. EBioMedicine. 2019;46:160–169. doi: 10.1016/j.ebiom.2019.07.049
- Zhao L, Gong J, Xi Y, et al. MRI-based radiomics nomogram may predict the response to induction chemotherapy and survival in locally advanced nasopharyngeal carcinoma. Eur Radiol. 2020;30(1):537–546. doi: 10.1007/s00330-019-06211-x EDN: EIRSSZ
- Nardone V, Reginelli A, Grassi R, et al. Delta radiomics: a systematic review. Radiol Med. 2021;126(12):1571–1583. doi: 10.1007/s11547-021-01436-7 EDN: PWBARF
- Burian E, Subburaj K, Mookiah MRK, et al. Texture analysis of vertebral bone marrow using chemical shift encoding–based water-fat MRI: a feasibility study. Osteoporos Int. 2019;30(6):1265–1274. doi: 10.1007/s00198-019-04924-9 EDN: IVFDCX
- Kawashima Y, Fujita A, Buch K, et al. Using texture analysis of head CT images to differentiate osteoporosis from normal bone density. Eur J Radiol. 2019;116:212–218. doi: 10.1016/j.ejrad.2019.05.009
- Valentinitsch A, Trebeschi S, Kaesmacher J, et al. Opportunistic osteoporosis screening in multi-detector CT images via local classification of textures. Osteoporos Int. 2019;30(6):1275–1285. doi: 10.1007/s00198-019-04910-1 EDN: USTGTS
- White R, Krueger D, De Guio F, et al. An exploratory study of the texture research investigational platform (TRIP) to evaluate bone texture score of distal femur DXA scans – A TBS-based approach. J Clin Densitom. 2021;24(1):112–117. doi: 10.1016/j.jocd.2019.06.004 EDN: DQGTII
- Rastegar S, Vaziri M, Qasempour Y, et al. Radiomics for classification of bone mineral loss: a machine learning study. Diagnostic and Interventional Imaging. 2020;101(9):599–610. doi: 10.1016/j.diii.2020.01.008 EDN: MXTTFU
- Jiang YW, Xu XJ, Wang R, Chen CM. Radiomics analysis based on lumbar spine CT to detect osteoporosis. European Radiology. 2022;32(11):8019–8026. doi: 10.1007/s00330-022-08805-4 EDN: FFIEJM
- van Griethuysen JJM, Fedorov A, Parmar C, et al. Computational radiomics system to decode the radiographic phenotype. Cancer Res. 2017;77(21):e104–e107. doi: 10.1158/0008-5472.CAN-17-0339
- Steinhauer V, Sergeev NI. Radiomics in Breast Cancer: In-Depth Machine Analysis of MR Images of Metastatic Spine Lesion. Sovremennye tehnologii v medicine. 2022;14(2):16–25. doi: 10.17691/stm2022.14.2.02 EDN: XFVITL
- Kim S, Kim BR, Chae HD, et al. Deep radiomics–based approach to the diagnosis of osteoporosis using hip radiographs. Radiology: Artificial Intelligence. 2022;4(4):e210212. doi: 10.1148/ryai.210212 EDN: QKWOZX
- Wang J, Zhou S, Chen S, et al. Prediction of osteoporosis using radiomics analysis derived from single source dual energy CT. BMC Musculoskeletal Disorders. 2023;24(1):100. doi: 10.1186/s12891-022-06096-w EDN: CSYYUO
- Xie Q, Chen Y, Hu Y, et al. Development and validation of a machine learning-derived radiomics model for diagnosis of osteoporosis and osteopenia using quantitative computed tomography. BMC Medical Imaging. 2022;22(1):140. doi: 10.1186/s12880-022-00868-5 EDN: TBGMNV
- Martel D, Monga A, Chang G. Radiomic analysis of the proximal femur in osteoporosis women using 3T MRI. Front Radiol. 2023;3:1293865. doi: 10.3389/fradi.2023.1293865 EDN: CMHBMX
- Zhen T, Fang J, Hu D, et al. Comparative evaluation of multiparametric lumbar MRI radiomic models for detecting osteoporosis. BMC Musculoskelet Disord. 2024;25(1):185. doi: 10.1186/s12891-024-07309-0 EDN: JXNNRY
- Vasilev YA, Bobrovskaya TM, Arzamasov KM, et al. Medical datasets for machine learning: fundamental principles of standartization and systematization. Manager Zdravookhranenia. 2023;(4):28–41. doi: 10.21045/1811-0185-2023-4-28-41 EDN: EPGAMD
Supplementary files

