

")


Magnetic resonance imaging in prenatal diagnosis of tuberous sclerosis complex: a case report
- Authors: Ivlyukova T.V.1, Bugrova D.D.2, Melnikov A.A.3, Belotserkovtseva L.D.1,2, Klimova N.V.2,4
-
Affiliations:
- Surgut District Clinical Centre of Maternity and Childhood health care
- Surgut State University
- Petrovsky National Research Center of Surgery
- Surgut Regional Clinical Hospital
- Issue: Vol 6, No 1 (2025)
- Pages: 156-165
- Section: Case reports
- Submitted: 29.08.2024
- Accepted: 16.10.2024
- Published: 25.03.2025
- URL: https://jdigitaldiagnostics.com/DD/article/view/635481
- DOI: https://doi.org/10.17816/DD635481
- ID: 635481

Cite item
Full Text

Abstract
Early detection of orphan diseases, including tuberous sclerosis complex, requires a multidisciplinary approach and the integration of new prenatal diagnostic methods, utilizing ultrasound and magnetic resonance imaging. Accumulated knowledge of the clinical manifestations of tuberous sclerosis complex and advancements in diagnostic techniques enable the identification of this condition. Magnetic resonance imaging allows for high-quality anatomical and functional imaging of the brain in various planes, improving the sensitivity and diagnostic value of the method for early (prenatal) detection of cerebral manifestations of tuberous sclerosis complex. Additionally, magnetic resonance imaging detects mediastinal masses. This highlights the need for a comprehensive approach in diagnosing tuberous sclerosis complex, with magnetic resonance imaging as the primary method for assessing the fetus’s cardiovascular and central nervous systems.
This article presents a clinical case of tuberous sclerosis complex determined by intrauterine diagnosis followed by postnatal examination of the newborn and genetic confirmation of the diagnosis. This case report demonstrates the diagnostic value of magnetic resonance imaging in the prenatal diagnosis of tuberous sclerosis complex.
Full Text
АКТУАЛЬНОСТЬ
Современные знания об общих и частных клинических проявлениях редкого генетически-детерминированного заболевания из группы факоматозов — болезни Бурневилля–Прингла (туберозного склероза), наряду с усовершенствованием методов лучевой диагностики, позволяют провести с высокой точностью его пренатальную диагностику. В Ханты-Мансийском автономном округе — Югре из 40 тыс. родов в период с 2022 по 2024 год выявлено 8 случаев туберозного склероза, из них 6 — генетически подтверждённые [1].
Туберозный склероз является редким хроническим полисистемным заболеванием с прогрессирующим течением, инвалидизацией и неблагоприятным исходом. В генетическом плане болезнь Бурневилля–Прингла представляет собой одну из форм моногенной патологии, относящейся к нейрокожным синдромам (факоматозам). Данное заболевание проявляется широким спектром клинических фенотипов. Следует отметить, что этиотропного лечения туберозного склероза не существует и его разработка, в частности таргетной терапии, не отличается высокой эффективностью. Несмотря на достигнутые результаты в ранней генетической диагностике данного заболевания, можно наблюдать сохранение трудностей в проведении дифференциальной диагностики. Данный факт связан с выраженным клиническим полиморфизмом и возрастзависимым дебютом его симптомов, что требует проведение дальнейших исследований в отношении паттернов туберозного склероза [2]. Возможным решением проблемы его пренатальной диагностики является проведение магнитно-резонансной томографии (МРТ) при сомнительных результатах инструментальных методов, в частности ультразвукового исследований (УЗИ) в I и II триместре беременности. Поражение центральной нервной системы считают одним из характерных проявлений туберозного склероза. В более 90% случаев он сопровождается развитием субэпендимальных узлов, для диагностики которых метод пренатального УЗИ не является информативным. МРТ позволяет получать анатомические и функциональные изображения головного мозга высокого качества и в разных плоскостях сканирования, что многократно повышает её чувствительность и информативность в отношении ранней (пренатальной) диагностики церебральных проявлений туберозного склероза. Кроме того, проведение МРТ обеспечивает выявление образований средостения. Данный факт диктует необходимость комплексного подхода к верификации туберозного склероза с применением МРТ в качестве ведущего метода с целью оценки состояния интересующих систем плода (сердечно-сосудистой и центральной нервной системы). На примере клинического случая продемонстрирована важность и необходимость проведения пренатальной МРТ при сомнительных результатах УЗИ в I и II триместре беременности, а также показана приоритетность её в качестве метода дополнительного (экспертного) исследования.
ОПИСАНИЕ СЛУЧАЯ
Анамнез
При проведении УЗИ беременной 26 лет на сроке 28 нед. и 2 дня обнаружено наличие объёмных образований в сердце у плода. Выявленные образования не имели кровотока по данным цветового допплеровского картирования и лоцировались в левом желудочке, толще межжелудочковой перегородки и полости правого предсердия (рис. 1). Учитывая наличие сомнительных результатов УЗИ, консилиум в составе врачей-генетиков и врачей-акушеров-гинекологов принял решение провести пренатальную МРТ плода.

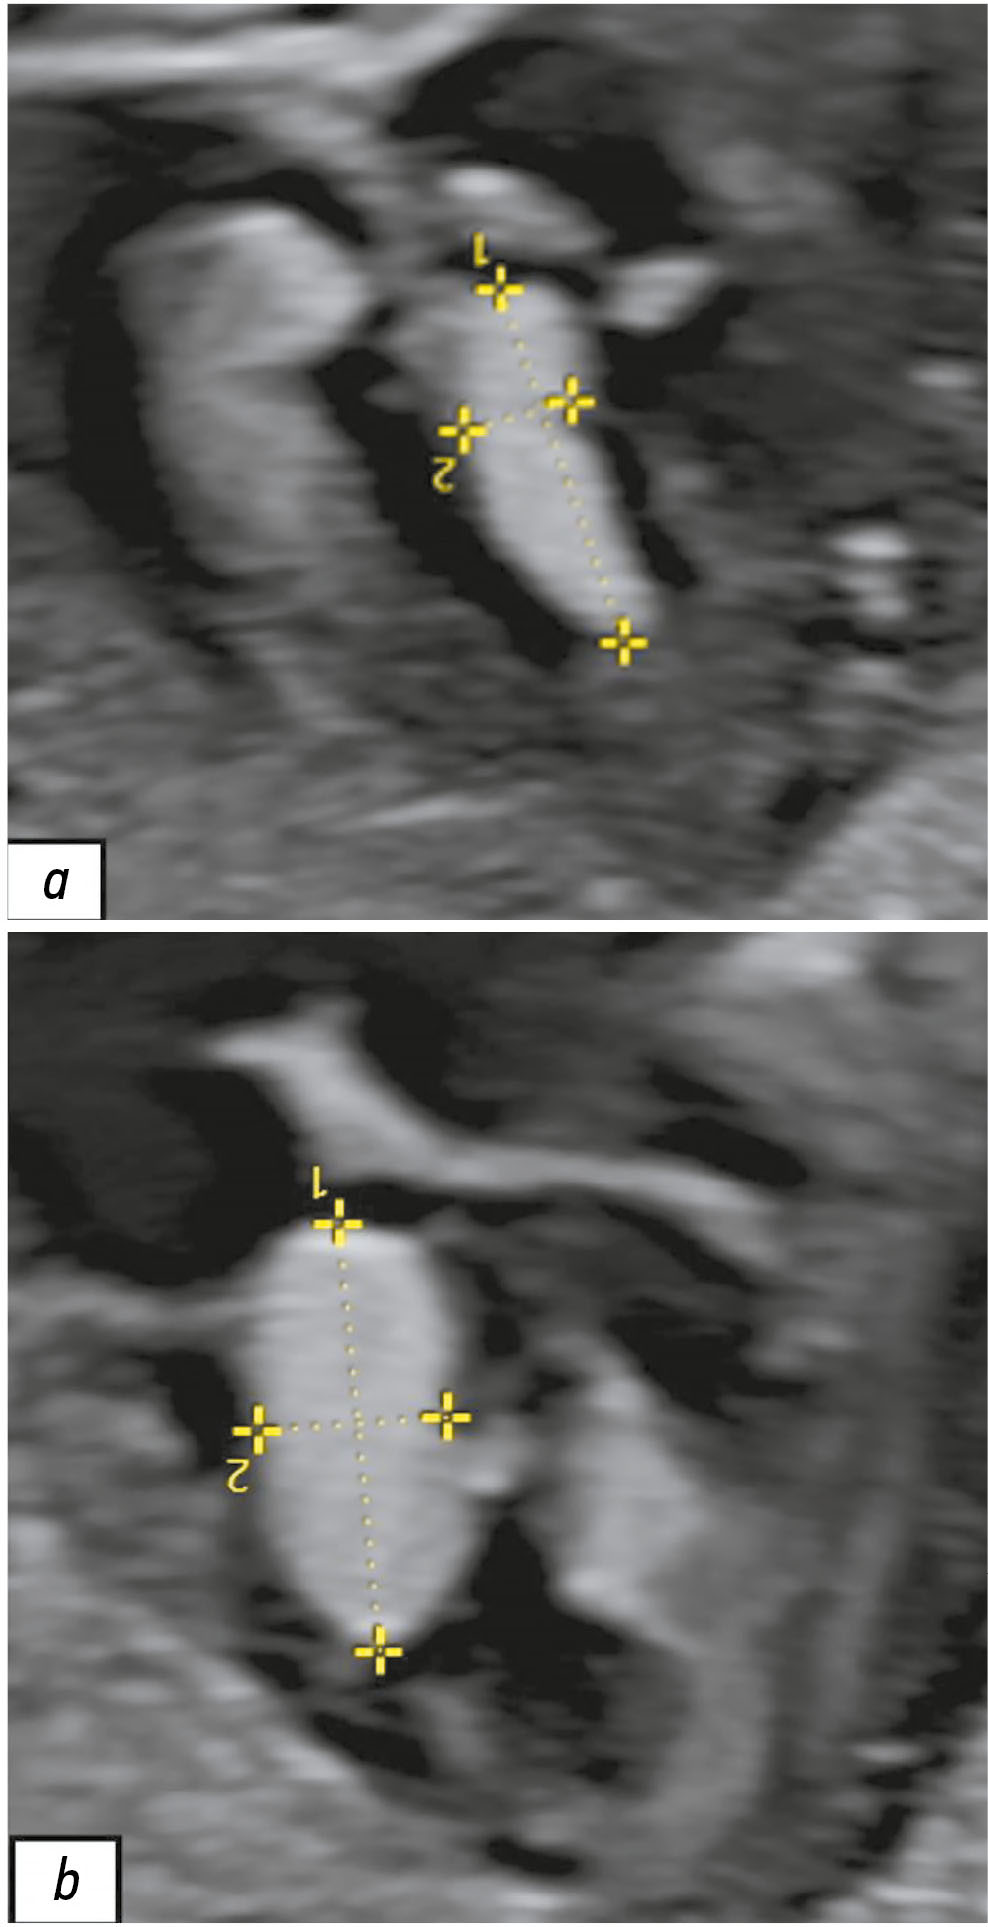
Рис. 1. Результаты пренатального ультразвукового исследования сердца плода в III триместре беременности (срок 28 нед. и 2 дня). Визуализируются вытянутой формы гиперэхогенные образования: a — в толще межжелудочковой перегородки; b — в полости левого желудочка.
Результаты физикального, лабораторного и инструментального исследований
Пренатальную МРТ плода выполняли на сроке 29 нед. и 4 дня в трёх плоскостях с помощью томографа GE Optima MR450w® (GE Healthcare, Соединённые Штаты Америки) с напряжённостью магнитного поля 1,5 Тл. Сканирование осуществляли по оптимизированной методике с использованием импульсных последовательностей, характеристики которых представлены в табл. 1. Диффузионно-взвешенное изображение с использованием коэффициента диффузии — b=800 с/мм2, измеряемый коэффициент диффузии (ADC) — 10−6 мм2/с. Мы не проводили внутривенное контрастное усиление в связи со статусом обследуемой. По данным пренатальной МРТ в полости матки лоцировался один плод в головном предлежании. В левом желудочке сердца у плода визуализировано дополнительное образование округлой формы с гиперинтенсивным сигналом на Т2-взвешенных изображениях (ВИ) и размером 11,0×12,0 мм. Аналогичное образование с размером 5,5×8,5 мм найдено в правом предсердии (рис. 2).
Таблица 1. Характеристики последовательностей магнитно-резонансной томографии при проведении исследования плода
Последовательность | Время повтора (TR), мс | Эхо-время (TE), мс | Толщина среза (Т), мм |
Т2 Sag | 631,0 | 90,9 | 6,0 |
Т2 Ax | 1000,0 | 92,9 | 6,0 |
Т2 Ax SSFSE FS | 1000,0 | 92,4 | 6,0 |
FIESTA Ax | 3,3 | 1,2 | 6,0 |
3D Ax LAVA Flex IO BH | 6,5 | 3,5 | 6,0 |
T2 Sag CHEST | 1227,7 | 118,6 | 4,0 |
T2 Cor CHEST | 1227,7 | 118,6 | 4,0 |
T2 Ax CHEST | 1235,7 | 122,3 | 4,0 |
T2 Sag CHEST | 1235,7 | 120,0 | 3,0 |
T2 Cor CHEST | 1235,7 | 120,5 | 3,0 |
T2 Ax CHEST | 1235,7 | 121,3 | 3,0 |
3D Ax LAVA Flex IO BH | 6,4 | 3,1 | 4,0 |
3D Ax LAVA Flex FAT | 6,5 | 3,1 | 6,0 |
3D Ax LAVA Flex FAT | 6,5 | 3,1 | 4,0 |
3D Ax LAVA Flex IO InPhase | 6,5 | 4,3 | 6,0 |
3D Ax LAVA Flex IO OutPhase | 6,5 | 4,3 | 4,0 |
Примечание. TR — интервал между двумя радиочастотными импульсами; TE — интервал между радиочастотным импульсом и пиком сигнала (эхо); Sag — сагиттальная плоскость; Ax — аксиальная плоскость; SSFSE (Single-shot fast spin echo) — последовательность для получения изображения за один цикл возбуждения; FS — подавление сигнала от жировой ткани; FIESTA (Fast imaging employing steady-state acquisition) — быстродействующая последовательность, основанная на использовании режима устойчивого состояния; CHEST — область исследования грудная клетка; Cor — корональная плоскость; LAVA (Liver acquisition with volume acceleration) — последовательность для сканирования печени и брюшной полости; Flex — технология подавления жира; IO — последовательность для получения изображений с учётом фазового взаимодействия жира и воды; BH (Breath hold) — сканирование на задержке дыхания; InPhase — сигналы от воды и жира усилены; OutPhase — сигналы от воды и жира находятся в противофазе. | |||

Рис. 2. Результаты пренатальной магнитно-резонансной томографии грудной клетки плода в аксиальной плоскости с использованием Т2-взвешенной последовательности (T2 Ax CHEST). III триместр беременности (срок 29 нед. и 4 дня). В левом и правом желудочке сердца определяются образования с аналогичными паттернами, характерными для рабдомиомы (белые стрелки).
В головном мозге по контурам боковых желудочков выявлены разнокалиберные субэпендимальные узелки с гипоинтенсивным сигналом на Т2-ВИ и гиперинтенсивным — на Т1-ВИ (рис. 3). Других патологических изменений у плода по результатам МРТ не выявлено.

Рис. 3. Результаты пренатальной магнитно-резонансной томографии головного мозга плода в III триместре беременности (срок 29 нед. и 4 дня): а — наличие субэпендимальных гипоинтенсивных очагов на Т2-взвешенном изображении (чёрные стрелки); b — наличие субэпендимальных гиперинтенсивных очагов на Т1-взвешенном изображении (белые стрелки).
По данным пренатального УЗИ плода на сроке 39 нед. и 5 дней по-прежнему визуализировались образования: в левом желудочке сердца с размером 16,0×9,1 мм, в толще межжелудочковой перегородки — 11,7×5,9 мм, в полости правого предсердия — 16,8×13,1 мм. При проведении цветового допплеровского картирования кровоток в образованиях не обнаружен, что подтверждает ранние данные о возможной рабдомиоме сердца у плода.
Пациенту проведено УЗИ почек (07.09.2023), результаты которого продемонстрировали в их паренхиме множественные мелкие кисты с размером до 3 мм. Чашечно-лоханочная система правой почки не расширена, однако отмечено её расширение в левой почке до 7,0 мм за счёт лоханки. Таким образом, у пациента с туберозным склерозом можно наблюдать мелкие кисты почек и пиелоэктазию левой почки по данным УЗИ.
На сроке 40 нед. (16.09.2022) проведено кесарево сечение. Родился живой, доношенный новорождённый, масса тела которого составила 3550 г, с оценкой по шкале Апгар 8–9 баллов. Согласно консультации врачагенетика клинический фенотип представлен кожными проявлениями — множественные пятна депигментации на коже у новорождённого. Для верификации синдрома выполнено высокопроизводительное параллельное секвенирование генов TSC1 и TSC2, где идентифицировали две мутации в гене TSC2: с.1934_1935del (p.V645fs) и c.4524_4526del (p.1508_1509del). Окончательный диагноз сформулирован как аутосомно-доминантный туберозный склероз.
Через 2 месяца после рождения (16.11.2022) ребёнку грудного возраста проведена МРТ головного мозга. В белом веществе больших полушарий (лобные, теменные, височные и затылочные доли), преимущественно интра- и субкортикально, а также в паравентрикулярных отделах выявлены множественные участки патологического магнитно-резонансного сигнала с нечёткими и неровными контурами, имеющими тенденцию к слиянию:
- гиперинтенсивный — на Т2-ВИ;
- изогипоинтенсивный — на изображениях, полученных при последовательности инверсия–восстановление (FLAIR);
- гиперинтенсивный — на Т1-ВИ.
Мозолистое тело гипоплазировано. Таким образом, постнатальные изменения на изображениях МРТ совпадали с данными пренатальной диагностики в отношении наличия субэпендимальных узлов, которые являются патогномоничным признаком туберозного склероза. На Т2-ВИ субэпендимальные узлы имеют низкий сигнал, что соответствует процессам кальцинации в их структуре (рис. 4).

Рис. 4. Результаты магнитно-резонансной томографии головного мозга пациента в возрасте двух месяцев: a — изображения, полученные при использовании последовательности инверсия–восстановление с длинным T1 (FLAIR). В перивентрикулярных и субкортикальных областях выявлены множественные патологические очаги (белые стрелки); b — Т2-взвешенные изображения. Отмечен низкий сигнал от субэпендимальных узлов (чёрные стрелки), что свидетельствует об их кальцинации.
По результатам электроэнцефалографии от 17.11.2022 отмечена мультифокальная эпи-активность, неустойчивая электроэнцефалографическая динамика.
Диагноз
Пациент осмотрен детским неврологом. На основании осмотра и данных обследования выставлен диагноз: криптогенная эпилепсия, локализованная форма. Туберозный склероз, ассоциированный с мутацией в гене TSC2. Субклиническая мультифокальная эпилептическая активность. Однократный судорожный приступ (фебрильный).
ОБСУЖДЕНИЕ
В данной статье на клиническом примере мы рассмотрели возможности МРТ в пренатальной диагностике болезни Бурневилля–Прингла, а также осветили вопросы стереотипизма церебральных проявлений данной патологии.
Туберозный склероз возникает с популяционной частотой 1:10 000 в результате de novo олигонуклеотидных мутаций в генах TSC1 и TSC2. Мутации в гене TSC1 (9q34), кодирующем белок гамартин, обусловливают до 30% случаев болезни Бурневилля–Прингла, остальные ассоциированы с мутацией в гене TSC2 (16p13), кодирующем белок туберин [3]. Мутации в данных генах ведут к нарушению их функции, а также — киназы mTOR. В итоге происходит активация пути сигнальной передачи PI3K/Akt/mTOR с нарушением стадий клеточного цикла. Данная биологическая особенность является фундаментом для формирования процессов канцерогенеза, потенциально возникающего во всех тканях пациентов с данной патологией [4]. Туберозный склероз характеризуется развитием множественных гамартом (доброкачественные опухолевидные образования) в различных органах, поражающих желудочно-кишечный тракт, лёгкие, центральную нервную систему, сердечно-сосудистую, эндокринную, костную и мочевыводящую систему (почки), органы зрения, кожные покровы. Чаще всего во внутриутробном периоде, начиная с 20-й нед. гестации, можно наблюдать формирование опухолей сердца в виде множественных рабдомиом размером до нескольких сантиметров, локализующихся во всех его отделах [5]. Массивные опухоли сердца могут приводить к антенатальной гибели плода или преждевременным родам. У живых новорождённых с туберозным склерозом рабдомиомы наблюдают в 30–60% случаев, практически в два раза чаще среди мужского пола. В перинатальном периоде у 98% пациентов развиваются субэпендимальные узлы головного мозга, сопровождающиеся эпилептическими приступами in utero, а также множественные кисты и ангиомиолипомы почек в 40 и 75% случаев соответственно. В период новорождённости у пациентов отмечают парциальные эпилептические приступы с возможной вторичной генерализацией. У детей грудного возраста, как правильно, выявляют синдром Веста, множественные гамартомы сетчатки, гипопигментные пятна на коже, а также задержку психомоторного развития. Поражение центральной нервной системы проявляется в виде развития субэпиндемальных узлов (туберсов) в более 90% случаев. В морфологическом плане туберсы — участки потери шестислойной цитоархитектоники коры в связи со снижением количества ГАМКергических нейронов (клетки, выделяющие в качестве медиатора γ-аминомасляную кислоту) и, как следствие, развитием фокальной корковой дисплазии, которая подвержена кальцинированию в более 50% случаев [6]. Офтальмологические проявления туберозного склероза представлены ретинальными гамартомами. Поражение почек чаще связано с развитием ангиомиолипом и кист как одиночных, так и множественных. Поражение желудочно-кишечного тракта проявляется в виде фибром или папиллом на спинке языка и нёба, дефектов эмали зубов, липом и ангиомиолипом поджелудочной железы, а также полипов в прямой кишке. В лёгких часто обнаруживают кистоподобные образования по типу пневмоцеле различных размеров и количества, при разрыве которых возникают одышка и кровохарканье [7].
Окончательный диагноз туберозного склероза устанавливают на основании наличия патогенной мутации в генах-кандидатах TSC1 или TSC2, которые, согласно своему функциональному статусу, являются генами–онкосупрессорами опухолевого роста и контролируют процессы клеточного цикла [8]. Следует отметить, что в эру отсутствия генетической верификации туберозного склероза выделяли основные («большие») и дополнительные («малые») признаки, которые в дальнейшем структурированы в современные клинические критерии. Согласно классификации Clinical Consensus Conference (TSC) от 2018 года предварительный диагноз туберозный склероз устанавливают при наличии двух «больших» признаков или одного «большого» и двух «малых» [9]. К «малым» признакам относят:
- более трёх дефектов эмали зубов;
- более двух фибром полости рта;
- многочисленные гамартомы внутренних органов;
- ахромия сетчатки;
- пятна типа «конфетти» на коже;
- мультикистозная трансформация почек [10].
Среди «больших» признаков выделяют:
- более трёх ангиофибром лица;
- более трёх гипопигментных пятен с размером 5 мм и более;
- не менее двух околоногтевых фибром нетравматического происхождения;
- один участок «шагреневой кожи»;
- рабдомиомы сердца;
- множественные гамартомы сетчатки;
- более трёх корковых дисплазий — туберы, миграционные тракты в белом веществе;
- более двух субэпендимальных узлов;
- субэпендимальная гигантоклеточная астроцитома;
- поражение лёгких;
- множественные ангиомиолипомы почек [11].
Плод с рабдомиомой сердца, выявленной в пренатальном периоде, требует комплексное динамическое наблюдение для своевременного установления новообразований других локализаций методом МРТ, а также генетическое обследование, в частности родственников, для исключения туберозного склероза. Методы ультразвуковой диагностики в значительной мере не являются чувствительными к выявлению субэпендимальных узлов в головном мозге у плода, что напрямую связано с физическими возможностями технологии. Однако МРТ считают уточняющим методом, обладающим явным потенциалом для целенаправленной диагностики церебральных патологических состояний у плода с 18-й нед. гестации. Опыт использования МРТ в перинатальных центрах федерального уровня показал, что сроки её проведения зависят от того, когда в норме формируется структура, аномалия которой заподозрена при выполнении УЗИ [12]. Патологические паттерны субэпендимальных узлов по результатам МРТ чаще однотипны и характеризуются гиперсигналом на Т1-ВИ и T2 FLAIR, при этом интенсивность сигнала на Т2-ВИ варьирует от срока гестации [13]. Субэпендимальные узлы расположены вдоль стенок боковых желудочков головного мозга и по данным УЗИ их часто не визуализируют [14]. Основные трудности в диагностике туберозного склероза обусловлены несколькими факторами, а именно:
- разнообразием клинической картины;
- возрастзависимым проявлением основных клинических симптомов;
- наличием симптомов, которые требуют проведение инструментальных методов исследования для их выявления;
- ограниченная доступность МРТ в пренатальном периоде и секвенирования генов TSC1 и TSC2.
ЗАКЛЮЧЕНИЕ
Пренатальную диагностику туберозного склероза можно оптимизировать в пользу получения более точной информации с помощью проведения МРТ. Данный случай демонстрирует возможность её использования с целью выявления очагов поражения в головном мозге и рабдомиом сердца у плода с туберозным склерозом в III триместре беременности. УЗИ имеет ограничения в определении церебральных признаков данной патологии, поэтому рекомендовано проведение МРТ плода в случаях подозрения на туберозный склероз.
ДОПОЛНИТЕЛЬНАЯ ИНФОРМАЦИЯ
Источник финансирования. Авторы заявляют об отсутствии внешнего финансирования при проведении работы.
Раскрытие интересов. Авторы декларируют отсутствие отношений, деятельности и интересов (личных, профессиональных или финансовых), связанных с третьими лицами (коммерческими, некоммерческими, частными), интересы которых в свою очередь могут быть затронуты содержанием рукописи.
Вклад авторов. Т.В. Ивлюкова — назначение и описание результатов обследования, проведение последующего обследования пациента, редактирование текста статьи; Д.Д. Бугрова — концепция работы, написание и редактирование текста статьи, сбор и анализ литературных данных; А.А. Мельников — сбор и анализ литературных данных, редактирование текста статьи; Л.Д. Белоцерковцева — редактирование финальной версии текста статьи; Н.В. Климова — разработка концепции работы, редактирование текста статьи. Все авторы одобрили рукопись (версию для публикации), а также согласились нести ответственность за все аспекты работы и гарантировали, что вопросы, связанные с точностью или добросовестностью любой части работы, будут должным образом рассмотрены и решены.
Информированное согласие на публикацию. Авторы получили письменное согласие законных представителей пациента на публикацию медицинских данных и фотографий в обезличенной форме в журнале Digital Diagnostics.
ADDITIONAL INFORMATION
Funding source. This article was not supported by any external sources of funding.
Disclosure of interest. The authors declare that they have no relationships, activities or interests (personal, professional or financial) with third parties (commercial, non-commercial, private) whose interests may be affected by the content of the article, as well as no other relationships, activities or interests over the past three years that must be reported
Authors’ contribution. T.V. Ivlyukova: appointment and description of of the examination results, subsequent examination of the patient, editing the article; D.D. Bugrova: concept of the work, writing and editing the article, collection and analysis of literary data; A.A. Melnikov: collection and analysis of literary data, editing the article; L.D. Belotserkovtseva editing the final version of the manuscript; N.V. Klimova: development of the concept of the work, editing the manuscript. Thereby, all authors provided approval of the version to be published and agree to be accountable for all aspects of the work in ensuring that questions related to the accuracy or integrity of any part of the work are appropriately investigated and resolved.
Consent for publication. Written consent was obtained from the patient’s law representatives for publication of relevant medical information and all of accompanying images within the manuscript in Digital Diagnostics journal.
About the authors
Tatiana V. Ivlyukova
Surgut District Clinical Centre of Maternity and Childhood health care
Email: ivlukova1978@mail.ru
ORCID iD: 0000-0001-5927-6392
SPIN-code: 6454-1164
Russian Federation, Surgut
Daria D. Bugrova
Surgut State University
Author for correspondence.
Email: bugrova_dd@edu.surgu.ru
ORCID iD: 0009-0007-1304-1839
SPIN-code: 7060-8369
Russian Federation, Surgut
Alexander A. Melnikov
Petrovsky National Research Center of Surgery
Email: alexradiology@rambler.ru
ORCID iD: 0009-0008-7409-0957
SPIN-code: 2129-3238
MD, Cand. Sci. (Medicine)
Russian Federation, MoscowLarisa D. Belotserkovtseva
Surgut District Clinical Centre of Maternity and Childhood health care; Surgut State University
Email: info@surgut-kpc.ru
ORCID iD: 0000-0001-6995-4863
SPIN-code: 2555-8470
MD, Dr. Sci. (Medicine), Professor
Russian Federation, Surgut; SurgutNatalia V. Klimova
Surgut State University; Surgut Regional Clinical Hospital
Email: knv@mail.ru
ORCID iD: 0000-0003-4589-6528
SPIN-code: 6411-0879
MD, Dr. Sci. (Medicine), Professor
Russian Federation, Surgut; SurgutReferences
- Islam MP. Tuberous sclerosis complex. Seminars in Pediatric Neurology. 2021;37:100875. doi: 10.1016/j.spen.2021.100875 EDN: UZDDQC
- Dorofeeva MYu, Belousova ED, Pivovarova AM. Recommendations for the diagnosis and treatment of tuberous sclerosis. S.S. Korsakov Journal of Neurology and Psychiatry. 2014;114(3):58–74. EDN: SDIJGZ
- Randle SC. Tuberous sclerosis complex: a review. Pediatric Annals. 2017;46(4):e166–e171. doi: 10.3928/19382359-20170320-01
- Fu J, Liang P, Zheng Y, et al. A large deletion in TSC2 causes tuberous sclerosis complex by dysregulating PI3K/AKT/mTOR signaling pathway. Gene. 2024;909:148312. doi: 10.1016/j.gene.2024.148312 EDN: IVLLCF
- Samueli S, Abraham K, Dressler A, et al. Tuberous sclerosis complex: new criteria for diagnostic work-up and management. Wiener klinische Wochenschrift. 2015;127(15-16):619–630. doi: 10.1007/s00508-015-0758-y EDN: UOKUJL
- Henske EP, Jóźwiak S, Kingswood JC, et al. Tuberous sclerosis complex. Nature Reviews Disease Primers. 2016;2:16035. doi: 10.1038/nrdp.2016.35 EDN: XULGSL
- Morin CE, Morin NP, Franz DN, et al. Thoracoabdominal imaging of tuberous sclerosis. Pediatric Radiology. 2018;48(9):1307–1323. doi: 10.1007/s00247-018-4123-y EDN: MEEFCH
- Chugunova LA, Shelestova ML, Korotchenko OYe, et al. Modern aspects of antenatal ultrasound and molecular genetic diagnosis of tuberous sclerosis. Obstetrics and Gynecology. 2020;(10):141–147. doi: 10.18565/aig.2020.10.141-147 EDN: QNPZHS
- Sedova TG, Elkin VD, Kobernik MYu, Zhukova AA. Tuberous sclerosis: literature review and clinical case description (retrospective analysis of 15-year follow-up). Russian Journal of Clinical Dermatology and Venerology. 2021;20(1):136–144. doi: 10.17116/klinderma202120011136 EDN: HIOMLT
- Northrup H, Aronow M, Bebin E, et al. Updated international tuberous sclerosis complex diagnostic criteria and surveillance and management recommendations. Pediatric Neurology. 2021;123:50–66. doi: 10.1016/j.pediatrneurol.2021.07.011 EDN: ILZBRU
- Wataya–Kaneda M, Uemura M, Fujita K, et al. Tuberous sclerosis complex: recent advances in manifestations and therapy. International Journal of Urology. 2017;24(9):681–691. doi: 10.1111/iju.13390 EDN: YGLIDX
- Manoukian SB, Kowal DJ. Comprehensive imaging manifestations of tuberous sclerosis. American Journal of Roentgenology. 2015;204(5):933–943. doi: 10.2214/AJR.13.12235
- Russo C, Nastro A, Cicala D, et al. Neuroimaging in tuberous sclerosis complex. Child's Nervous System. 2020;36(10):2497–2509. doi: 10.1007/s00381-020-04705-4 EDN: BHQMKK
- Cotter JA. An update on the central nervous system manifestations of tuberous sclerosis complex. Acta Neuropathologica. 2020;139(4):613–624. doi: 10.1007/s00401-019-02003-1 EDN: WHJEEM
Supplementary files

