

")


Consensus-based labeling algorithms for texture analysis of prostate lesions
- Authors: Romanenko M.O.1, Kodenko M.R.1,2, Gelezhe P.B.1,3, Blokhin I.A.1, Reshetnikov R.V.1
-
Affiliations:
- Research and Practical Clinical Center for Diagnostics and Telemedicine Technologies
- Bauman Moscow State Technical University
- European Medical Center
- Issue: Vol 6, No 3 (2025)
- Pages: 373-384
- Section: Original Study Articles
- Submitted: 24.10.2024
- Accepted: 25.12.2024
- Published: 25.08.2025
- URL: https://jdigitaldiagnostics.com/DD/article/view/637445
- DOI: https://doi.org/10.17816/DD637445
- EDN: https://elibrary.ru/NYKFGN
- ID: 637445

Cite item
Full Text

Abstract
BACKGROUND: Texture analysis improves the diagnostic accuracy of magnetic resonance imaging and differential diagnosis of prostate lesions, which are primarily segmented through manual labeling, resulting in significant inter-expert variability of masks. A consensus-based technique can help reduce inconsistencies in prostate lesion segmentation. However, global scientific studies have not described any standardized, consensus-based labeling protocols.
AIM: This study aimed to develop a consensus algorithm for manual labeling of prostate lesions by several independent experts and evaluate inter-expert consistency in lesion segmentation.
METHODS: This retrospective study included 60 biparametric magnetic resonance imaging scans of the prostate gland performed according to PI-RADS 2.1 technical specification. The scans showed PI-RADS 3, 4, and 5 lesions. Two independent radiologists manually segmented the prostate lesions using 3D Slicer. Then, the resulting masks were compared using the Dice–Sørensen coefficient (DSC). For lesions with DSC ≥ 0.75, the final mask was based on the overlap between the two original masks. Conversely, for lesions with DSC < 0.75, the final mask was determined using the proposed consensus algorithm.
RESULTS: The proposed consensus algorithm significantly increased the DSC values, from 0.61 [0.48; 0.73] for primary labeling to 0.74 [0.62; 0.79] for labeling using the proposed algorithm (p = 0.01).
CONCLUSION: The proposed consensus-based algorithm for labeling prostate lesions using magnetic resonance imaging data is crucial in addressing inadequate approaches to objective segmentation in research and clinical settings.
Full Text
ОБОСНОВАНИЕ
Радиомический анализ является перспективным методом дифференциальной диагностики новообразований простаты, учитывая, что диагностическая точность магнитно-резонансной томографии в клинической практике может варьировать в зависимости от протокола сканирования и опыта рентгенолога, интерпретирующего исследование [1, 2]. Применение радиомического анализа потенциально позволит избежать неоправданной биопсии и сопряжённых с ней осложнений [3], что особенно важно в случаях неопределённых очагов простаты [4]. Тем не менее внедрение радиомики в рутинную клиническую практику связано с некоторыми трудностями, среди которых одним из ключевых является отсутствие стандартизированного и оптимального инструмента разметки [5, 6].
Наиболее доступным и часто применяемым методом сегментации очагов простаты для последующего текстурного анализа на данный момент является ручной [7].
Одним из главных его недостатков является высокая межэкспертная вариабельность масок, которая приводит к нестабильности извлечённых текстурных показателей [8]. Для количественного определения степени подобия масок используют коэффициент сходства Сёренсена–Дайса (Dice-Sørensen Similarity Coefficient, DSC), значение которого может варьировать от 0 до 1, где 1 — полное их пересечение. По данным M.Y. Chen и соавт. [9], при разметке патологических очагов простаты на двух изображениях магнитно-резонансной томографии (МРТ) четырьмя врачами-рентгенологами медиана DSC составила 0,81 и 0,58 для периферической и переходной зон соответственно. Это показывает высокую вариабельность результатов сегментации даже среди опытных специалистов. В исследовании T. Jeganathan и соавт. [10] отмечали ещё бÓльшую вариабельность результатов — при сегментации очагов простаты тремя рентгенологами по результатам 64 исследований среднее значение DSC составило 0,55. Его невысокие значения потенциально могут быть обоснованы низкой контрастностью или малыми размерами включённых в исследования патологических очагов. Однако, согласно данным публикаций, даже для очагов с очень высокой вероятностью клинически значимого рака (Prostate Imaging-Reporting and Data System 5, PI-RADS 5), обладающих более чёткими контурами и бóльшими размерами, значительного повышения DSC отмечено не было [10, 11].
Для стандартизации этапов сегментации патологических образований Европейское радиологическое сообщество (European Society of Radiology, ESR) и Европейская организация по исследованию и лечению рака (European Organisation for Research and Treatment of Cancer, EORTC) разработали рекомендации [12], согласно которым при ручной сегментации биомедицинских изображений необходима их итеративная независимая оценка несколькими разметчиками до момента предполагаемого достижения консенсуса и получения итоговой маски. При этом кратность итераций и необходимое количество операторов в рекомендациях не указаны.
Недостаточная детализация процесса достижения консенсуса отражена также в оригинальных исследованиях [13–15]. Согласно литературному анализу, в доступных на момент написания статьи публикациях методология получения итоговой маски описана недостаточно подробно, что затрудняет воспроизведение представленных результатов.
Таким образом, несмотря на активно растущий объём исследований в области радиомики простаты [7], в мировой литературе всё ещё не представлено чётких алгоритмов достижения консенсуса при сегментации её патологических изменений несколькими разметчиками. В связи с этим возникает необходимость в разработке и оценке эффективности подхода к формированию итоговой маски, основанного на согласовании разметок нескольких специалистов. Для этого выдвинуты две гипотезы (табл. 1).
Таблица 1. Нулевые и альтернативные гипотезы исследования | |
Нулевая гипотеза (H0) | Альтернативная гипотеза (Ha) |
Значение DSC при разметке очагов простаты двумя экспертами будет <0,751 | Значение DSC при разметке очагов простаты двумя экспертами будет ≥0,751 |
Коэффициент корреляции между DSC и категорией PI-RADS очага статистически значимо не отличается от нуля | Коэффициент корреляции между DSC и категорией PI-RADS очага статистически значимо отличается от нуля |
Примечание. 1 — обоснование выбранного пограничного значения отображено в разделе «Методы»; DSC (Dice-Sørensen Similarity Coefficient) — коэффициент сходства Сёренсена–Дайса; PI-RADS (Prostate Imaging-Reporting and Data System) — система визуализации, описания и оценки изображений простаты. | |
ЦЕЛЬ
Разработать алгоритм формирования консенсуса при независимой ручной разметке патологических очагов простаты несколькими экспертами, оценить согласованность экспертов при сегментации её очаговых изменений.
МЕТОДЫ
Дизайн исследования
Проведено наблюдательное одноцентровое ретроспективное исследование (рис. 1).

Рис. 1. Дизайн исследования. МРТ — магнитно-резонансная томография; DSC (Dice-Sørensen Similarity Coefficient) — коэффициент сходства Сёренсена–Дайса; PI-RADS (Prostate Imaging-Reporting and Data System) — система визуализации, описания и оценки изображений простаты; mpReview (Multiparametric Review) — расширение программного обеспечения для анализа и сегментации мультипараметрических исследований.
Критерии соответствия
Критерии включения: изображения бипараметрической МРТ (бпМРТ) простаты, полученные при выполнении исследования по технической спецификации PI-RADS 2.1, с патологическими очагами, соответствующими категориям PI-RADS: 3 — подозрение на клинически значимый рак простаты; 4 — вероятно его наличие; 5 — высокая его вероятность.
Критерии невключения: очаговые изменения простаты, соответствующие категориям PI-RADS 1 (очень низкая вероятность клинически значимого рака простаты) и PI-RADS 2 (низкая его вероятность), согласно технической спецификации PI-RADS 2.1, а также исследования, выполненные с отклонением от указанного стандарта.
Критерии исключения: исследования низкого качества (с наличием выраженных артефактов, затрудняющих интерпретацию).
Сбор данных
Работа была выполнена с применением зарегистрированного набора данных с гистологической верификацией1, содержащего 103 анонимизированные записи бпМРТ, полученные при выполнении исследований на томографе MAGNETOM® Aera 1,5 Tл 4G (Siemens Healthcare, Германия) по стандарту PI-RADS 2.1. Для настоящего исследования были выбраны только бпМРТ, поскольку, согласно критериям METRICS (система балльной оценки качества исследований по радиомике) [16], для радиомического анализа целесообразно использовать меньшее количество импульсных последовательностей, чтобы минимизировать риск переобучения модели. После анализа всех изображений из набора данных исключены 43 исследования бпМРТ, содержащие очаговые изменения, отнесённые к категориям PI-RADS 1 и 2, что соответствует очень низкой и низкой вероятности клинически значимого рака простаты. В результате сформирован набор данных, включающий 60 исследований с 69 патологическими очагами, соответствующими критериям PI-RADS 3 и выше.
Эксперты
В разметке набора данных принимали участие два врача-рентгенолога (эксперта) с опытом работы в области лучевой диагностики 9 и 12 лет, ранее выполнявшие сегментацию медицинских изображений.
Сегментация
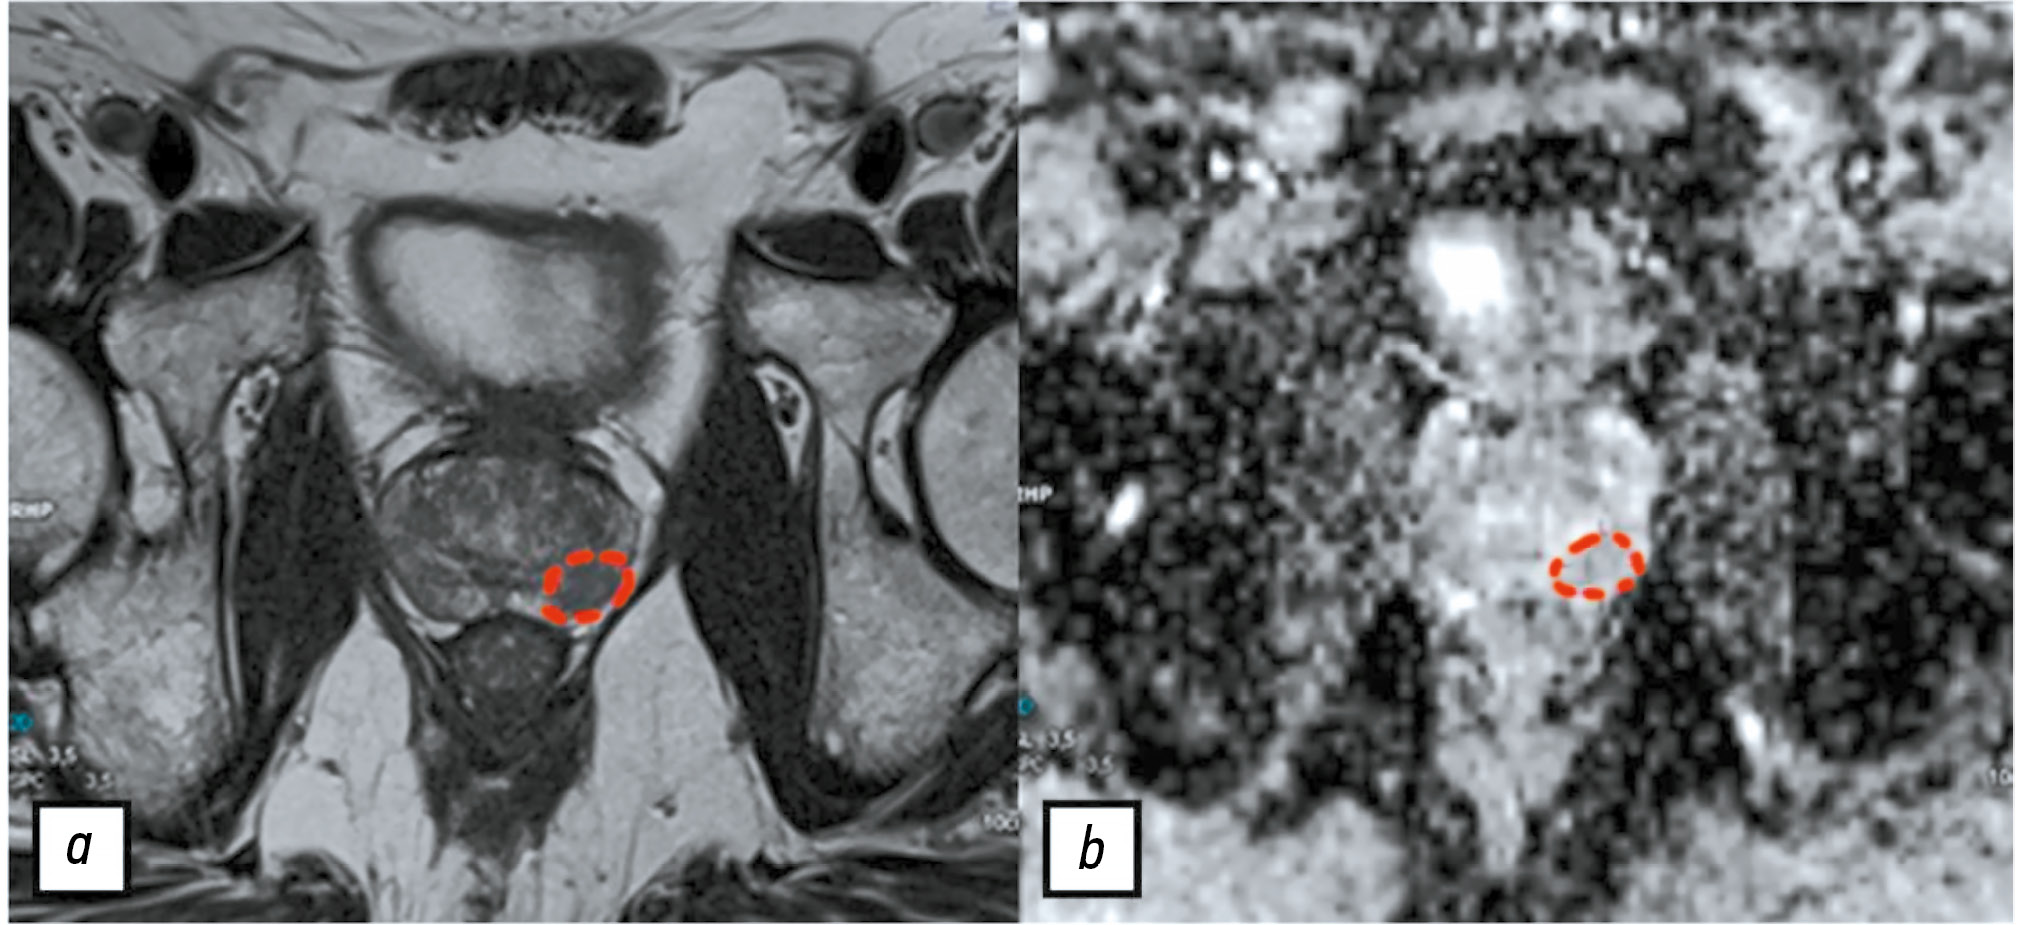
При создании набора данных1 один из экспертов подготовил референсные изображения, на которых схематически отметил интересующие патологические очаги на одном срезе, руководствуясь категорией PI-RADS и результатами мультифокальной фьюжн-биопсии (рис. 2). Таким образом, до начала настоящего исследования прошёл интервал более 6 месяцев после предыдущей работы эксперта с данными, что, согласно кривой забывания Эббингауза, является достаточным для минимизации влияния прежнего опыта на текущую разметку [17].

Рис. 2. Референсные изображения со схематически отмеченным очагом в периферической зоне левой доли простаты: a —Т2-взвешенное изображение; b — карта исчисляемого коэффициента диффузии.
В настоящем исследовании разметку проводили согласно этим изображениям на всех срезах, содержащих, по мнению разметчика, патологический очаг. Мы посчитали данный шаг оправданным как для удобства разметчиков, так и для уменьшения числа расхождений во время обработки результатов.
Разметку изображений бпМРТ осуществляли с помощью открытого бесплатного программного обеспечения 3D Slicer2 (версия 5.6.2) в расширении mpReview (Multiparametric Review), предназначенного для анализа и сегментации мультипараметрических исследований. Экспертырентгенологи независимо друг от друга создавали маску отдельно для каждого очага простаты ручным методом c использованием инструмента «контурная кисть» (Draw). В качестве референсной импульсной последовательности выбрали T2-взвешенное изображение, поскольку для сопоставления масок сегментируемые изображения должны иметь одинаковое пространственное разрешение. Разметку выполняли послойно с оценкой всего объёма очага. Созданные маски сохраняли в формате NifTI [Neuroimaging Informatics Technology Initiative (.nii)].
Этическая экспертиза
Проведение исследования одобрено независимым этическим комитетом Научно-практического клинического центра диагностики и телемедицинских технологий (протокол заседания № 06/2025 от 19.06.2025).
Статистический анализ
Обоснование размера выборки. При наихудшем сценарии, предполагающем максимальное расхождение между разметками (DSC — 1), выборка, включающая 8 патологических очагов, обеспечивает статическую мощность 80% при вероятности ошибки I рода 0,05 [18].
Методы статистического анализа данных. Полученные от экспертов маски поочерёдно сопоставляли с подсчётом DSC. Результаты представлены в виде Me [Q1; Q3], где Me — медиана, Q1 и Q3 — 1-й и 3-й квартиль соответственно. Определение нормальности распределения данных проводили с использованием теста Шапиро–Уилка. Для установления взаимосвязи между типом очага по PI-RADS и значением DSC применяли коэффициент ранговой корреляции Спирмена (ρ). Уровень статистической значимости при проверке гипотез принят равным 0,05. Расчёты выполняли в программном обеспечении RStudio® версия 4.1.2 (Posit, PBC, США) [19].
Создание алгоритма консенсусной разметки
Поскольку в мировой литературе не представлено общепринятых граничных значений DSC при консенсусной разметке [12], мы решили установить пограничное значение, равное 0,75. В случае, если DSC ≥0,75, то площадь пересечения двух масок сохраняли как итоговую. Если DSC <0,75, то такие очаги простаты подлежали повторному пересмотру совместно двумя экспертами с целью достижения консенсуса.
Мы разработали алгоритм действий, подробно регламентирующий процесс формирования консенсуса по очагам, для которых значение DSC было меньше порогового (рис. 3). Маски, соответствующие данным очагам, анонимизированы и расположены в случайном порядке. Спустя 1 месяц эксперты повторно их просматривали (как свою, так и второго разметчика) в 3D Slicer2, не обсуждая их друг с другом. Далее каждый эксперт давал независимую оценку всем маскам патологических очагов, выставляя либо 1 балл («маска соответствует»), либо 0 баллов («маска не соответствует»). Критерий «маска соответствует» в данном случае подразумевает, что, по мнению эксперта, её контуры в достаточной степени совпадают с границами очага. В случае единогласного выбора маски двумя экспертами (суммарная оценка — 2 балла), её использовали в дальнейшем анализе. Если сумма баллов была равна 0 или 1, то маску исключали.

Рис. 3. Алгоритм достижения консенсуса.
После прохождения обеими масками конкретного патологического очага этапа экспертного голосования возможны следующие сценарии формирования консенсуса:
- при выборе двух масок итоговой считали их область пересечения (расчёт DSC представленнарис. 4,а);

Рис. 4. Расчёт коэффициент сходства Сёренсена–Дайса после прохождения алгоритма: а — если эксперты выбрали обе маски (сохраняется первичный коэффициент сходства Сёренсена–Дайса); b — если выбрана одна из двух масок; c — новая маска имеет пересечение с двумя предыдущими; d — новая маска пересекается только с одной из предыдущих масок.
- при выборе только одной маски именно её использоваливкачествеитоговой;
- вслучаеотклоненияобеихмасокитоговуюформировалисовместнодваэксперта.
Во втором сценарии после прохождения алгоритма рассчитывали повторно значение DSC, представляющее отношение объёма пересечения двух масок к объёму выбранной (итоговой) маски (см. рис. 4, b). В третьем варианте значение DSC рассчитывали как отношение объёма новой маски к суммарному объёму двух предыдущих масок (см. рис. 4, c, d).
РЕЗУЛЬТАТЫ
Всего проанализировано 60 результатов бпМРТ, полученных при выполнении исследования по стандарту PI-RADS 2.1 и содержащих 69 патологических очагов простаты, соответствующих критериям PI-RADS 3, 4 и 5. Распределение очагов по категориям PI-RADS выглядело следующим образом:
- PI-RADS 3 — 27 очагов (39%);
- PI-RADS 4 — 22 очага (32%);
- PI-RADS 5 — 20 очагов (29%).
После разметки набора данных для каждой пары масок рассчитано исходное (базовое) значение DSC. Распределение его исходных значений продемонстрировано на рис. 5. Для всей выборки значение DSC составило 0,61 [0, 48; 0, 73].

Рис. 5. Распределение исходных значений коэффициента сходства Сёренсена–Дайса.
Количество очагов, для которых DSC ≥0,75, составило 14 (20,2%). Маски остальных очагов (n=55, 79,8%) подлежали повторному пересмотру в соответствии с алгоритмом. Ранжирование по категории паологических очагов в группе пересмотра:
- сPI-RADS 3 — 38% (21 случай);
- сPI-RADS 4 — 36% (20 случаев);
- сPI-RADS 5 — 25% (14 случаев).
Для группы пересмотра консенсус (см. рис. 3) достигнут следующим образом:
- для 43 очагов в качестве итоговой маски единогласно выбрана одна из двух предложенных;
- для 11 очагов создана новая итоговая маска, поскольку ни одна из исходных не получила единогласного одобрения;
- для одного очага (DSC — 0,56) итоговая маска получена посредством пересечения двух исходных масок, каждая из которых единогласно одобрена обоими экспертами.
Повторный расчёт значений DSC для всей выборки после пересмотра 55 случаев продемонстрировал их изменения. В 27% случаев (n=15) определяли уменьшение значений DSC после применения алгоритма. Для всей выборки значение DSC составило 0,74 [0, 62; 0, 79].
Распределение значений DSC в зависимости от категории PI-RADS патологического очага статистически значимо отличается от нормального (тест Шапиро–Уилка, p <0,001), в связи с чем для сравнения данных выбраны непараметрические методы. Распределение исходных значений DSC по категориям PI-RADS представлено в табл. 2.
Таблица 2. Распределение исходных значений коэффициента сходства Сёренсена–Дайса в зависимости от категории PI-RADS патологических очагов | |
Категория PI-RADS | Коэффициент сходства Сёренсена–Дайса |
PI-RADS 3 (вероятность наличия клинически значимого рака остаётся неопределённой) | |
PI-RADS 4 (высокая вероятность клинически значимого рака) | |
PI-RADS 5 (очень высокая вероятность клинически значимого рака) | |
Примечание. Данные представлены в виде Me [Q1; Q3], где Me — медиана, Q1 и Q3 — 1-й и 3-й квартиль соответственно; PI-RADS (Prostate Imaging-Reporting and Data System) — система визуализации, описания и оценки изображений простаты. | |
Результаты корреляционного анализа зависимости согласованности сегментации (значение DSC) от степени выраженности патологического процесса (категория PI-RADS) демонстрируют наличие слабой положительной статистически значимой связи (ρ=0,3 при p=0,01): чем выше категория по PI-RADS, тем выше согласованность масок разметки.
Результаты статистического анализа после пересмотра демонстрируют исчезновение статистически значимой связи между категорией очага и значением DSC (ρ=0,09 при p=0,42). Таким образом, применение разработанного алгоритма консенсусной разметки приводит к устранению вариабельности согласованности сегментации и повышению значений DSC, включая очаги категории PI-RADS 3 с нечёткими контурами.
Проведено статистическое сопоставление значений DSC на исходной выборке и новых данных (рис. 6, а): медианное значение DSC статистически значимо возросло после применения консенсуса (односторонний парный тест Вилкоксона, p=0,01). Корреляционный анализ зависимости модуля разности исходного и нового значения DSC от категории PI-RADS (см. рис. 6, b) показал наличие статистически значимой слабой отрицательной связи (ρ=0,2 при p=0,04). Таким образом, с повышением категории PI-RADS наблюдают уменьшение абсолютного прироста DSC.

Рис. 6. Сопоставление значений коэффициента сходства Сёренсена–Дайса до и после применения алгоритма консенсусной разметки: a — сравнение медиан; b — связь с категорией PI-RADS. PI-RADS (Prostate Imaging-Reporting and Data System) — система визуализации, описания и оценки изображений простаты.
ОБСУЖДЕНИЕ
Резюме основного результата исследования
Разработан и апробирован алгоритм разметки патологических очагов простаты, позволяющий стандартизировать и сделать прозрачным процесс достижения консенсуса.
Изучена согласованность экспертов при ручной разметке патологических очагов простаты. Использование алгоритма консенсусной разметки обеспечило статистически значимый (p=0,01) прирост значения DSC.
Кроме того, применение алгоритма консенсусной разметки позволило достичь инвариантности согласованности сегментации: слабая положительная связь между категорией PI-RADS патологического очага и значением DSC, выявленная в исходной выборке, отсутствует в выборке, полученной после пересмотра случаев с использованием разработанного алгоритма. Бóльшая часть случаев, подлежащих пересмотру, принадлежала к категориям PI-RADS 3 и 4 (74%).
Обсуждение основного результата исследования
В данной работе представлена методология алгоритмизации консенсусной разметки очаговых изменений простаты. Необходимость создания такого алгоритма обусловлена, во-первых, отсутствием в мировой литературе регламентированных правил достижения консенсуса; во-вторых, актуальностью подготовки наборов данных для различных целей, в частности для построения и валидации радиомических моделей.
Разработанный алгоритм направлен в первую очередь на сегментацию объектов с низкой контрастностью относительно окружающих тканей [20], в данном случае — очаговые изменения простаты. Применение алгоритмов для их автоматической сегментации в рутинной практике ограничено, в особенности для неопределённых очагов категории PI-RADS 3.
Ручной метод сегментации очагов простаты характеризуется высокой операторской зависимостью, что подтверждено результатами нашей работы (DSC — 0,61 [0, 48; 0, 73]), которые согласуются с данными упомянутых выше исследований [9, 10]. По результатам подгруппового анализа исходной выборки определяется наличие слабой положительной зависимости между значением DSC и категорией PI-RADS патологического очага (ρ=0,3 при p=0,01), то есть с повышением градации и контрастности [4] очага отмечается небольшое увеличение согласованности экспертов. Тем не менее даже для очагов с высоким риском клинически значимого рака показатели DSC сохраняются весьма умеренными (см. табл. 2). Применение радиомического анализа наиболее целесообразно для очагов простаты c сомнительной вероятностью клинически значимого рака (PI-RADS 3), являющихся самыми сложными объектами для сегментации. Именно поэтому полученные результаты подчёркивают необходимость разработки новых подходов к разметке подобных очагов, направленных на снижение операторской зависимости метода.
Высокая вариабельность масок, полученных при сегментации несколькими экспертами, затрудняет обеспечение воспроизводимости текстурных показателей [8]. В связи с этим с целью её минимизации и получения «золотого стандарта» (Ground Truth) необходимо участие нескольких разметчиков с последующим формированием консенсуса.
В мировом научном сообществе не представлено стандартизированных протоколов по консенсусной разметке. Зачастую описание процесса достижения согласия ограничивается упоминанием термина «консенсус» без дальнейших разъяснений, как именно происходил выбор границ маски [13–15]. Так, в исследовании R. Cuocolo и соавт. [13] в сложных случаях приглашали дополнительного эксперта, который мог при необходимости скорректировать предложенные маски или создать новые. Данный подход полностью зависит от квалификации приглашённого специалиста и оставляет простор для субъективных решений, не подвергаемых проверке и сомнению.
В вышеупомянутых рекомендациях ESR и EORTC [12] предлагают подход, заключающийся в поочерёдной коррекции одной маски двумя или более экспертами до предполагаемого момента формирования консенсуса. Очевидными ограничениями этого метода являются отсутствие указания необходимого числа итераций и чётких критериев того, какую маску можно считать итоговой.
В исследовании B. Kocak и соавт. [21] с целью оценки воспроизводимости радиомических признаков применён подход итеративной коррекции для формирования консенсусных масок при анализе патологических образований гипофиза, молочных желёз и почек. В нём принимали участие 12 рентгенологов с различным опытом работы, при этом врачи с бÓльшим медицинским стажем корректировали маски менее опытных коллег. Именно поэтому финальное решение оставалось за наиболее опытным врачом (заведующим отделения лучевой диагностики). Однако, по данным M.Y. Chen и соавт. [9], значение DSC сильно варьировало даже у опытных врачей-рентгенологов, что позволяет выдвинуть гипотезу о важности именно опыта разметки биомедицинских изображений по сравнению со стажем работы по субспециальности [12].
Отличительной особенностью разработанного алгоритма является подробная документация всех этапов консенсусной разметки, которая делает процесс сегментации прозрачным и понятным для врачей-рентгенологов. Помимо этого, отсутствие необходимости в привлечении дополнительных экспертов снижает риск предвзятости и повышает воспроизводимость разметки. Применение алгоритма позволяет добиться статистически значимого увеличения согласия между разметчиками: медианное значение DSC возросло с 0,61 до 0,74 при использовании консенсусной разметки. Ожидаемо, бÓльшую часть пересмотренных случаев (78%) составили очаги, относящиеся к категориям PI-RADS 3 и 4. Статистически значимый прирост значения DSC для всей выборки и для данных категорий, подтверждается результатами сопоставления групп и корреляционным анализом (см. рис. 5). Разработанный алгоритм может стать удобным инструментом для сегментации медицинских изображений при подготовке наборов данных.
Для определения оптимальной продолжительности периода «забывания» с целью его возможного сокращения необходимы отдельные исследования. По нашим данным, в отечественной и зарубежной литературе отсутствуют работы, посвящённые изучению периода «забывания» в контексте сегментации биомедицинских изображений.
Ограничения исследования
Наше исследование имеет несколько ограничений:
- во-первых, пороговое значение DSC установлено на уровне 0,75 с учётом экспертного мнения коллектива авторов, в условиях отсутствия референсных значений по данным литературных исследований;
- во-вторых, период «забывания» продолжительностью в один месяц не позволяет полностью исключить предвзятости экспертов;
- в-третьих, мы не смогли полностью избежать этапа свободного обсуждения в одном из сценариев алгоритма, когда эксперты отвергают обе маски. Возможным вариантом решения данной проблемы, при наличии временных ресурсов, может стать повторное прохождение алгоритма для подобных очагов.
- в-четвёртых, в исследовании принимали участие всего два врача-рентгенолога, поэтому необходимо проведение дальнейшего тестирования алгоритма с участием бóльшего количества специалистов, в том числе на объектах других анатомических локализаций.
Помимо этого, при анализе опубликованных работ, посвящённых радиомическому анализу и сегментации изображений лучевой диагностики, отмечают неоднозначное толкование термина «консенсус» разными авторами. Методам консенсуса в системе здравоохранения посвящена публикация J. Jones и соавт. [22], где указано, что его целью является определение степени согласия группы экспертов по конкретной теме или проблеме. К одному из важнейших качеств его методов относят анонимность, позволяющую избежать доминирования мнения одного из участников. Другими ключевыми характеристиками методов консенсуса являются итеративность процесса, предоставление ответов других экспертов и наличие обратной связи. Исходя из этого определения, применяемые в сегментации медицинских изображений методы консенсуса не в полной мере соответствуют заявленным качествам, в частности принципу анонимности. Таким образом, можно сделать вывод, что в разметке медицинских изображений, включая наше исследование, использованы лишь различные вариации консенсус-подобных методов.
ЗАКЛЮЧЕНИЕ
Разработанный алгоритм достижения консенсуса при ручной сегментации очаговых изменений простаты подробно документирует каждый этап и способствует снижению субъективного влияния разметчиков на конечный результат за счёт исключения этапа, когда финальное решение принимает только один эксперт. Данный алгоритм может стать полезным инструментом в исследованиях по текстурному анализу и помочь внедрению радиомики в рутинную практику. Помимо этого, он демонстрирует необходимость разработки новых подходов к сегментации биомедицинских изображений, снижающих влияние человеческого фактора.
Полученные результаты в очередной раз подтверждают высокую оператор-зависимость ручного метода при сегментации патологических очагов простаты. Вместе с тем с повышением категории PI-RADS наблюдают небольшое увеличение согласованности между экспертами.
ДОПОЛНИТЕЛЬНАЯ ИНФОРМАЦИЯ
Вклад авторов. М.О. Романенко — написание текста рукописи, анализ данных; М.Р. Коденко — статистический анализ; П.Б. Гележе — сбор и анализ данных; И.А. Блохин — концепция и дизайн исследования, анализ данных, редактирование текста рукописи; Р.В. Решетников — редактирование текста рукописи. Все авторы одобрили рукопись (версию для публикации), а также согласились нести ответственность за все аспекты работы, гарантируя надлежащее рассмотрение и решение вопросов, связанных с точностью и добросовестностью любой её части.
Этическая экспертиза. Проведение исследования одобрено независимым этическим комитетом Научно-практического клинического центра диагностики и телемедицинских технологий (протокол заседания № 06/2025 от 19.06.2025).
Источник финансирования. Данная статья подготовлена авторским коллективом в рамках научно-исследовательской работы «Научное обоснование методов лучевой диагностики опухолевых заболеваний с использованием радиомического анализа», (ЕГИСУ: № 123031500005-2) в соответствии с Приказом от 21.12.2022 № 1196 «Об утверждении государственных заданий, финансовое обеспечение которых осуществляется за счёт средств бюджета города Москвы государственным бюджетным (автономным) учреждениям подведомственным Департаменту здравоохранения города Москвы, на 2023 год и плановый период 2024 и 2025 годов» Департамента здравоохранения города Москвы.
Раскрытие интересов. Авторы заявляют об отсутствии отношений, деятельности и интересов за последние три года, связанных с третьими лицами (коммерческими и некоммерческими), интересы которых могут быть затронуты содержанием статьи.
Оригинальность. При создании настоящей работы авторы не использовали ранее опубликованные сведения (текст, иллюстрации, данные).
Доступ к данным. Редакционная политика в отношении совместного использования данных к настоящей работе не применима.
Генеративный искусственный интеллект. При создании настоящей статьи технологии генеративного искусственного интеллекта не использовали.
Рассмотрение и рецензирование. Настоящая работа подана в журнал в инициативном порядке и рассмотрена по обычной процедуре. В рецензировании участвовали два внешних рецензента, один член редакционной коллегии и научный редактор издания.
ADDITIONAL INFORMATION
Author contributions: M.O. Romanenko: writing—original draft, formal analysis; M.R. Kodenko: formal analysis; P.B. Gelezhe: investigation, formal analysis; I.A. Blokhin: conceptualization, methodology, formal analysis, writing—review & editing; R.V. Reshetnikov: writing—review & editing. All the authors approved the version of the manuscript to be published and agreed to be accountable for all aspects of the work, ensuring that questions related to the accuracy or integrity of any part of the work are appropriately investigated and resolved.
Ethics approval: The study was approved by the Independent Ethics Committee at the Research and Practical Clinical Center for Diagnostics and Telemedicine Technologies (Minutes No. 06/2025, dated June 19, 2025).
Funding sources: This article was prepared as part of the Scientific Justification of Radiology Modalities for Tumor Diseases Using Radiomics Analysis research project (Unified State Information Accounting System No. 123031500005-2), in accordance with Order of the Moscow City Health Department No. 1196 On Approval of State Assignments Funded by the Budget of the City of Moscow for State Budgetary (Autonomous) Institutions Under the Jurisdiction of the Moscow City Health Department for 2023 and the planned period of 2024–2025, dated December 21, 2022.
Disclosure of interests: The authors have no relationships, activities, or interests for the last three years related to for-profit or not-for-profit third parties whose interests may be affected by the content of the article.
Statement of originality: No previously obtained or published material (text, images, or data) was used in this study or article.
Data availability statement: The editorial policy regarding data sharing does not apply to this work.
Generative AI: No generative artificial intelligence technologies were used to prepare this article.
Provenance and peer-review: This article was submitted unsolicited and reviewed following the standard procedure. The peer review process involved two external reviewers, a member of the Editorial Board, and the in-house science editor.
1 Свидетельство о государственной регистрации базы данных № 2024620575/ 06.02.2024. Бюл. № 2. Васильев Ю.А., Блохин И.А., Гележе П.Б., и др. Набор данных бипараметрической МРТ предстательной железы с гистологической верификацией. Режим доступа: https://www.elibrary.ru/download/elibrary_60779494_94785287.PDF Дата обращения: 21.10.2024.
2 3D Slicer image computing platform. В: 3D Slicer [Internet]. 2005–2024. Режим доступа: https://slicer.org/ Дата обращения: 21.09.2024
About the authors
Maria O. Romanenko
Research and Practical Clinical Center for Diagnostics and Telemedicine Technologies
Author for correspondence.
Email: RomanenkoMO@zdrav.mos.ru
ORCID iD: 0009-0006-1557-0374
SPIN-code: 8204-5924
Russian Federation, Moscow
Maria R. Kodenko
Research and Practical Clinical Center for Diagnostics and Telemedicine Technologies; Bauman Moscow State Technical University
Email: KodenkoM@zdrav.mos.ru
ORCID iD: 0000-0002-0166-3768
SPIN-code: 5789-0319
Cand. Sci. (Engineering)
Russian Federation, Moscow; MoscowPavel B. Gelezhe
Research and Practical Clinical Center for Diagnostics and Telemedicine Technologies; European Medical Center
Email: gelezhe.pavel@gmail.com
ORCID iD: 0000-0003-1072-2202
SPIN-code: 4841-3234
MD, Cand. Sci. (Medicine);
Russian Federation, MoscowIvan A. Blokhin
Research and Practical Clinical Center for Diagnostics and Telemedicine Technologies
Email: BlokhinIA@zdrav.mos.ru
ORCID iD: 0000-0002-2681-9378
SPIN-code: 3306-1387
MD, Cand. Sci. (Medicine)
Russian Federation, MoscowRoman V. Reshetnikov
Research and Practical Clinical Center for Diagnostics and Telemedicine Technologies
Email: ReshetnikovRV1@zdrav.mos.ru
ORCID iD: 0000-0002-9661-0254
SPIN-code: 8592-0558
Cand. Sci. (Physics and Mathematics)
Russian Federation, MoscowReferences
- Smith CP, Harmon SA, Barrett T, et al. Intra- and interreader reproducibility of PI-RADSv2: a multireader study. Journal of Magnetic Resonance Imaging. 2018;49(6):1694–1703. doi: 10.1002/jmri.26555
- Vasilev YuA, Omelyanskaya OV, Vladzymyrskyy AV, et al. Comparison of multiparametric and biparametric magnetic resonance imaging protocols for prostate cancer diagnosis by radiologists with different experience. Digital Diagnostics. 2023;4(4):455–466. doi: 10.17816/dd322816 EDN: PVEPWX
- Borghesi M, Ahmed H, Nam R, et al. Complications after systematic, random, and image-guided prostate biopsy. European Urology. 2017;71(3):353–365. doi: 10.1016/j.eururo.2016.08.004 EDN: YXGSZX
- Nikolaev AE, Blohin IA, Shapiev AN, et al. Application of the PI-RADS system in MR diagnostics of the prostate gland: methodological recommendations. Moscow: Research and Practical Clinical Center for Diagnostics and Telemedicine Technologies; 2019. (In Russ.) EDN: TTGQTA
- Zhong J, Lu J, Zhang G, et al. An overview of meta-analyses on radiomics: more evidence is needed to support clinical translation. Insights into Imaging. 2023;14(1):111. doi: 10.1186/s13244-023-01437-2 EDN: SMPQCJ
- Chiacchio G, Castellani D, Nedbal C, et al. Radiomics vs radiologist in prostate cancer. Results from a systematic review. World Journal of Urology. 2023;41(3):709–724. doi: 10.1007/s00345-023-04305-2 EDN: HPNNUD
- Telecan T, Andras I, Crisan N, et al. More than meets the eye: using textural analysis and artificial intelligence as decision support tools in prostate cancer diagnosis—a systematic review. Journal of Personalized Medicine. 2022;12(6):983. doi: 10.3390/jpm12060983 EDN: TIZZEK
- Whybra P, Spezi E. Sensitivity of standardised radiomics algorithms to mask generation across different software platforms. Scientific Reports. 2023;13(1):14419. doi: 10.1038/s41598-023-41475-w EDN: LVNVNQ
- Chen MY, Woodruff MA, Dasgupta P, Rukin NJ. Variability in accuracy of prostate cancer segmentation among radiologists, urologists, and scientists. Cancer Medicine. 2020;9(19):7172–7182. doi: 10.1002/cam4.3386 EDN: LCYCRN
- Jeganathan T, Salgues E, Schick U, et al. Inter-rater variability of prostate lesion segmentation on multiparametric prostate MRI. Biomedicines. 2023;11(12):3309. doi: 10.3390/biomedicines11123309 EDN: ZCDYWR
- Ghafoor S, Steinebrunner F, Stocker D, et al. Index lesion contouring on prostate MRI for targeted MRI/US fusion biopsy – Evaluation of mismatch between radiologists and urologists. European Journal of Radiology. 2023;162:110763. doi: 10.1016/j.ejrad.2023.110763 EDN: QLSWGX
- deSouza NM, van der Lugt A, Deroose CM, et al; European Society of Radiology. Standardised lesion segmentation for imaging biomarker quantitation: a consensus recommendation from ESR and EORTC. Insights into Imaging. 2022;13(1):159. doi: 10.1186/s13244-022-01287-4 EDN: ONUHSE
- Cuocolo R, Stanzione A, Ponsiglione A, et al. Clinically significant prostate cancer detection on MRI: a radiomic shape features study. European Journal of Radiology. 2019;116:144–149. doi: 10.1016/j.ejrad.2019.05.006 EDN: XBKHNN
- Cuocolo R, Comelli A, Stefano A, et al. Deep learning whole-gland and zonal prostate segmentation on a public MRI dataset. Journal of Magnetic Resonance Imaging. 2021;54(2):452–459. doi: 10.1002/jmri.27585 EDN: GNOJHL
- Schelb P, Kohl S, Radtke JP, et al. Classification of cancer at prostate MRI: deep learning versus clinical PI-RADS assessment. Radiology. 2019;293(3):607–617. doi: 10.1148/radiol.2019190938
- Kocak B, Akinci D’Antonoli T, Mercaldo N, et al. METhodological RadiomICs Score (METRICS): a quality scoring tool for radiomics research endorsed by EuSoMII. Insights into Imaging. 2024;15(1):8. doi: 10.1186/s13244-023-01572-w EDN: CINMDC
- Murre JMJ, Chessa AG. Why Ebbinghaus' savings method from 1885 is a very ‘pure' measure of memory performance. Psychon Bull Rev. 2023;30(1):303–307. doi: 10.3758/s13423-022-02172-3
- Chow S.-C., Wang H., Shao J. Sample Size Calculations in Clinical Research (2nd ed.). Chapman and Hall/CRC. – 2007.
- Blokhin IA, Kodenko MR, Shumskaya YF, et al. Hypothesis testing using R. Digital Diagnostics. 2023;4(2):238–247. doi: 10.17816/DD121368 EDN: OEKDAG
- Kallie CS, Legge GE, Yu D. Identification and detection of simple 3D objects with severely blurred vision. Investigative Opthalmology & Visual Science. 2012;53(13):7997. doi: 10.1167/iovs.12-10013
- Kocak B, Yardimci AH, Nazli MA, et al. REliability of consensus-based segMentatIoN in raDiomic feature reproducibility (REMIND): A word of caution. European Journal of Radiology. 2023;165:110893. doi: 10.1016/j.ejrad.2023.110893 EDN: VBDFCG
- Jones J, Hunter D. Qualitative Research: Consensus methods for medical and health services research. BMJ. 1995;311(7001):376–380. doi: 10.1136/bmj.311.7001.376 EDN: CBNBSJ
Supplementary files

