








 Email this article


Diagnostic accuracy of radionuclide imaging for parathyroid lesions in patients with primary hyperparathyroidism and nodular and autoimmune thyroid disorders: a cross-sectional study
- Authors: Degtyarev M.V.1, Rumyantsev P.O.2, Serzhenko S.S.1, Slashchuk K.Y.1, Pershina-Miliutina A.P.1
-
Affiliations:
- Endocrinology Research Centre
- Clinics group “My Medical Center”
- Issue: Vol 6, No 3 (2025)
- Pages: 385-397
- Section: Original Study Articles
- Submitted: 13.12.2024
- Accepted: 23.06.2025
- Published: 25.08.2025
- URL: https://jdigitaldiagnostics.com/DD/article/view/642857
- DOI: https://doi.org/10.17816/DD642857
- EDN: https://elibrary.ru/RTAQDF
- ID: 642857

Cite item
Full Text

Abstract
BACKGROUND: Concomitant thyroid disorders can decrease the diagnostic accuracy of topical imaging modalities used to localize primary hyperparathyroidism. Therefore, in such cases, the effectiveness of radionuclide imaging for parathyroid lesions should be confirmed.
AIM: This study aimed to evaluate the effects of nodular and autoimmune thyroid disorders on the diagnostic accuracy of radionuclide imaging for parathyroid lesions in patients with primary hyperparathyroidism and compare the accuracy of radionuclide imaging with that of other imaging modalities.
METHODS: The study included three patient groups: patients with primary hyperparathyroidism without a concomitant thyroid disease (group 1; n = 50), patients with autoimmune thyroid disorder (group 2; n = 50), and patients with thyroid nodule/multinodular goiter (group 3; n = 50). All the patients underwent ultrasound, planar scintigraphy, and single-photon emission computed tomography with X-ray computed tomography prior to parathyroidectomy. If negative or equivocal results were obtained (e.g., suspected parathyroid lesion), a contrast-enhanced computed tomography scan was performed. The intervals between scans and between the first scan and parathyroidectomy did not exceed 6 months and 12 months, respectively. Sensitivity and the positive predictive value were estimated.
RESULTS: In group 2, the diagnostic accuracy of radionuclide imaging for parathyroid lesions was lower than that of other imaging modalities. Moreover, in group 2, contrast-enhanced computed tomography demonstrated a diagnostic sensitivity of 79%, and its combination with ultrasound achieved a higher sensitivity of 85%. In group 3, the highest diagnostic value was obtained for single-photon emission computed tomography combined with X-ray computed tomography (85%) or ultrasound (88%). The results of radionuclide imaging of parathyroid lesions in patients with primary hyperparathyroidism and autoimmune thyroid disease depended on the volume, density, and vascularization of the thyroid gland.
CONCLUSION: Single-photon emission computed tomography combined with X-ray computed tomography is an accurate diagnostic modality for identifying parathyroid lesions in patients with primary hyperparathyroidism and concomitant nodular thyroid disorder. Contrast-enhanced computed tomography showed the highest sensitivity in patients with primary hyperparathyroidism and autoimmune thyroid disease.
Full Text
ОБОСНОВАНИЕ
Первичный гиперпаратиреоз (ПГПТ) — эндокринное заболевание, обусловленное автономной гиперфункцией одной или более паращитовидных желёз, приводящей к избыточной секреции паратгормона и гиперкальциемии. Распространённость заболевания в мире составляет около 1% [1], в России — 2 случая на 1 млн населения в год [2]. Поздняя диагностика ПГПТ приводит к инвалидизации и значительному снижению качества жизни [3]. Наиболее частыми осложнениями заболевания являются остеопороз, переломы, нефролитиаз, нефрокальциноз, а также язвенные поражения слизистой оболочки желудка [4].
Для визуализации паращитовидных желёз применяют радионуклидные методы исследования с использованием радиофармпрепарата 99mTc-метокси-изобутил-изонитрил (99mTc-MIBI), включая планарную сцинтиграфию, однофотонную эмиссионную компьютерную томографию (ОФЭКТ), в том числе совмещённую с рентгеновской компьютерной томографией (ОФЭКТ/КТ). Дополнительно используют ультразвуковое исследование (УЗИ), компьютерную томографию (КТ) с контрастным усилением, реже — магнитнорезонансную томографию (МРТ) и позитронно-эмиссионную томографию, совмещённую с рентгеновской КТ (ПЭТ/КТ), с применением 18F-фторхолина или 11С-метионина. Однако ни один из вышеуказанных методов по отдельности не обеспечивает 100% точности в локализации образования паращитовидной железы [9].
По данным литературы, у 60–93% пациентов с ПГПТ диагностируют и патологию щитовидной железы [10–12], включая узловой и многоузловой зоб (19–67% всех случаев), а также аутоиммунные заболевания (4–57%) [12–14]. Систематический обзор 28 исследований, посвящённых топической диагностике у пациентов с ПГПТ и сопутствующей патологией щитовидной железы, показал, что наибольшую совокупную чувствительность (86%) продемонстрировало сочетание УЗИ и сцинтиграфии с 99mTc-MIBI по сравнению с другими методами визуализации и их комбинациями [15]. Однако, согласно результатам обзора, модальности ОФЭКТ/КТ и КТ с контрастным усилением изучены в единичных исследованиях (в двух и одном соответственно). В последующем показано, что у пациентов с ПГПТ и сопутствующей патологией щитовидной железы диагностическая эффективность КТ с контрастным усилением снижалась на 10%, УЗИ — на 19%, ОФЭКТ — на 12% по сравнению с пациентами без её патологии. При этом сочетание УЗИ и КТ с контрастным усилением продемонстрировало бóльшую информативность, чем комбинация УЗИ и ОФЭКТ [16]. Следует отметить, что в этом и других исследованиях, включённых в указанный систематический обзор, патологию щитовидной железы рассматривали обобщённо, без учёта отдельных нозологий.
Чувствительность радионуклидной диагностики у пациентов с ПГПТ и сопутствующей патологий щитовидной железы заметно ниже по сравнению с другими методами топической визуализации [17, 18]. Отмечено, что именно аутоиммунные заболевания щитовидной железы ассоциированы с относительно низкой эффективностью планарной сцинтиграфии, а ОФЭКТ/КТ у этих пациентов имеет дополнительные преимущества при визуализации изменённых паращитовидных желёз [18]. В свою очередь, при узловой патологии щитовидной железы у пациентов с ПГПТ чувствительность сцинтиграфии с 99mTc-MIBI на 5–24% ниже [19], тогда как использование ОФЭКТ/КТ демонстрировало сопоставимую эффективность выявления образований паращитовидных желёз у пациентов как при наличии, так при отсутствии узлов в щитовидной железе [20]. Однако, насколько нам известно, отсутствуют данные о диагностической точности методов топической диагностики при аутоиммунных заболеваниях и узловой патологии щитовидной железы у пациентов с образованиями паращитовидных желёз. Определение наиболее эффективной комбинации таких методов у пациентов с образованиями паращитовидных желёз является необходимым для оптимизации диагностического процесса в этих условиях.
ЦЕЛЬ
Изучить влияние узловой и аутоиммунной патологии щитовидной железы на точность радионуклидной диагностики образований паращитовидных желёз у пациентов с ПГПТ и сопоставить её с точностью других методов визуализации.
МЕТОДЫ
Дизайн исследования
Проведено одноцентровое ретроспективное (с анализом медицинской документации) одномоментное несравнительное исследование.
Условия проведения
В исследование включали данные пациентов, проходивших амбулаторно обследование в консультативно-диагностическом центре, а также отделениях ультразвуковой и радионуклидной диагностики, с последующим лечением в отделе хирургии Национального медицинского исследовательского центра (НМИЦ) эндокринологии имени академика И.И. Дедова (Москва) в период с января 2017 г. по декабрь 2022 г.
Критерии соответствия
Критерии включения:
- лабораторно подтверждённый ПГПТ: наличие гиперкальциемии и/или гиперкальциурии в сочетании со стойким повышением концентрации паратгормона;
- гистологическая верификация образования паращитовидной железы;
- типичное расположение образований паращитовидных желёз (у задней поверхности доли щитовидной железы или у нижнего полюса её доли);
- наличие результатов УЗИ, планарной сцинтиграфии и ОФЭКТ/КТ, проведённых в этой последовательности с целью предоперационной подготовки к селективной малоинвазивной паратиреоидэктомии.
Критерии исключения:
- ранее выполненная тиреоидэктомия;
- ранее выполненная паратиреоидэктомия (персистенция/рецидив заболевания).
Группы исследования
В целях исследования сформированы три «удобные» выборки фиксированного объёма (по 50 человек в каждой): пациенты без патологии щитовидной железы (1-я группа), с сопутствующим аутоиммунным заболеванием щитовидной железы (2-я группа), а также с узловыми образованиями щитовидной железы (3-я группа). Отсутствие её патологии устанавливали на основе следующих критериев:
- эутиреодный статус;
- отсутствие информации о раннее перенесённых заболеваниях щитовидной железы;
- отсутствие структурных её изменений по данным заключения УЗИ.
Наличие аутоиммунного заболевания щитовидной железы устанавливали при наличии хотя бы одного из следующих критериев:
- установленный диагноз аутоиммунного тиреоидита, диффузного токсического зоба (болезнь Грейвса);
- повышенные титры антитиреоидных антител (антител к тиреопероксидазе, тиреоглобулину, тиреотропному гормону) в крови.
Узловые образования щитовидной железы устанавливали по результатам УЗИ.
Вся информация о критериях включения в группы исследования получена из медицинской документации.
Топическая диагностика образований паращитовидных желёз
Временной интервал между УЗИ, планарной сцинтиграфией и ОФЭКТ/КТ не превышал 6 месяцев, а от момента первого исследования до хирургической операции — не более 12 месяцев. При отрицательном или сомнительном результате этих исследований проводили КТ с контрастным усилением и биопсию с определением содержания паратгормона в смыве из иглы. Все данные радионуклидной визуализации, КТ с контрастным усилением обрабатывали и интерпретировали опытные радиологи и рентгенологи. У некоторых пациентов данные УЗИ получены из медицинской документации, выданной другими медицинскими учреждениями.
Врачи, проводившие исследования, владели информацией о результатах ранее выполненной диагностики, а также имели доступ к клиническим данным и результатам лабораторных исследований пациентов.
Ультразвуковое исследование
УЗИ проводили на аппаратах Voluson® E8 Expert (GE Healthcare, США), Aplio® 500 [Toshiba (Canon Medical Systems), Япония], LOGIQ® E9 (GE Healthcare, США) с высокочастотными линейными датчиками (7–12 МГц). Помимо заключения о наличии/отсутствии образований паращитовидной железы учитывали оценки васкуляризации образований на основе полуколичественной шкалы, где:
- 0 баллов — отсутствие сосудов;
- 1 балл — единичные сосуды;
- 2 балла — умеренная васкуляризация;
- 3 балла — выраженная васкуляризация.
Васкуляризацию ≥2 баллов признавали «усиленной». В случаях, когда по данным УЗИ возникала необходимость провести дифференциальную диагностику между образованием паращитовидной железы и иными структурами (узлами щитовидной железы, лимфатическими узлами), выполняли пункционную биопсия с определением концентрации паратгормона в смыве из иглы.
Радионуклидные исследования
Перед проведением исследования пациентам внутривенно вводили 700 МБк технеция [99mTc] сестамиби. На первом этапе проводили двухфазную планарную сцинтиграфию на аппаратах GE Discovery® NM/CT 670 и GE Discovery® NM630 (GE Healthcare, США). Выполняли два статических снимка шеи и верхнего средостения через 15 мин и 1 ч 30 мин после введения радиофармацевтического препарата продолжительностью по 10 мин. Аппаратные требования и технические настройки:
- низкоэнергетические коллиматоры высокого разрешения (Low Energy High Resolution, LEHR);
- матрица 256×256;
- зум 2,0;
- энергетическое окно с пиком Epeak=141±14 кэВ,
На втором этапе, сразу после отсроченного планарного снимка, на аппарате GE Discovery® NM/CT 670 (GE Healthcare, США) выполняли ОФЭКТ/КТ шеи и верхнего средостения. Настройки ОФЭКТ:
- матрица 256×256;
- зум 2,0;
- режим сканирования «шаг» и «съёмка» (60 проекций с экспозицией по 30 с, шаг 6°).
Настройки КТ:
- напряжение трубки — 120–140 Кв;
- сила тока (модулируемая) — 80–400 мА/с;
- толщина среза — 3,75 мм с реконструкцией 1,25 мм;
- шаг стола — 1 мм.
Данные радионуклидных исследований обрабатывали на рабочей станции Xeleris® (GE Healthcare, США).
Компьютерная томография с контрастным усилением
Исследование выполняли на гибридной системе ОФЭКТ/КТ [GE Discovery® NM/CT 670 (GE Healthcare, США)] и мультидетекторном компьютерном томографе Optima® CT (General Electric, США). Протокол исследования с внутривенным контрастным усилением на системе ОФЭКТ/КТ включал три фазы — нативную, артериальную и венозную. Используя одноколбовый автоматический инжектор, через предварительно установленный в локтевую вену катетер, вводили болюс контрастного препарата (60 мл йопромида, 370 мг йода/мл) со скоростью 3,5–4 мл/с. Стандартный протокол исследования на томографе Optima® CT (General Electric, США) включал четыре фазы (нативную, артериальную, венозную, отсроченную), а для введения использовали контрастный препарат йомепрол (400 мг йода/мл) и двухколбовый автоматический инжектор (со скоростью введения 4 мл/с — 50 мл, с болюсом 40 мл 0,9% раствора натрия хлорида). Для получения артериальной и венозной фазы сканирование начинали через 5 и 20 с соответственно, после достижения порогового уровня контрастирования аорты (программный пакет Bolus Tracking). Отсроченную фазу проводили на третьей минуте после введения контрастного препарата.
Оценка точности топической диагностики
Оценку диагностической точности изученных методов топической диагностики, а также их комбинаций (УЗИ и ОФЭКТ/КТ, УЗИ и КТ с контрастным усилением, УЗИ и планарная сцинтиграфия, ОФЭКТ/КТ и КТ с контрастным усилением) проводили по двум параметрам — чувствительности и предсказательной ценности положительного результата (ПЦПР) — в отношении двух диагностических исходов: наличие и локализация образований (опухолей) паращитовидной железы. Локализацию удалённого образования паращитовидной железы считали согласованной с данными инструментального исследования в случае, когда топические данные в протоколе оперативного вмешательства совпадали с результатами диагностического метода.
Чувствительность (Se) метода рассчитывали как долю истинно положительных результатов:
(1)
где TP — количества истинно положительных результатов; FN — количество ложноотрицательных результатов.
ПЦПР рассчитывали с помощью следующей формулы:
(2)
где TP — количество истинно положительных результатов; FP — количество ложноположительных результатов.
Истинно положительным результатом считали случаи, когда инструментальный метод диагностики (или комбинация методов) установил наличие/локализацию образования паращитовидной железы в точном соответствии с результатом, полученным при оперативном вмешательстве.
Ложноположительным считали результат, когда инструментальный метод диагностики (или комбинация методов) определил наличие/локализацию образования паращитовидной железы, не соответствующее результатам оперативного вмешательства.
Ложноотрицательный результат устанавливали в случаях, когда инструментальный метод диагностики (или комбинация методов) не выявил образование паращитовидной железы, найденное в ходе оперативного вмешательства.
Этическая экспертиза
Проведение исследования одобрено локальным этическим комитетом ФГБУ «Национальный медицинский исследовательский центр эндокринологии имени академика И.И. Дедова» (протокол № 1 от 25.01.2017). Все пациенты подписывали добровольное информированное согласие до включения в исследование.
Статистический анализ
Предварительный расчёт необходимого размера выборки не проводили.
Анализ данных выполнен с применением пакета статистических программ STATISTICA® 13.3.0 (TIBCO Software Inc., США) и языка программирования R 4.2.2. Результаты количественных признаков представлены в виде Me [Q1; Q3], где Me — медиана, Q1 и Q3 — 1-й и 3-й квартиль соответственно. Для частот рассчитывали 95% доверительный интервал (ДИ) методом Клоппера–Пирсона. Сравнение двух независимых выборок по количественным признакам проводили с использованием U-критерия Манна–Уитни, более двух независимых выборок одновременно — с помощью критерия Краскела–Уоллиса. Сравнение двух независимых выборок по качественным признакам выполнено с использованием критерия χ2 Пирсона (с использованием поправки Йетса при ожидаемом количестве наблюдений в одной из ячеек таблицы <5). Значения чувствительности и ПЦПР определяли с помощью онлайн-калькулятора JavaStat1.
Пороговое значения для объёма щитовидной железы определяли с помощью ROC-анализа и расчёта критерия Юдена с использованием пакета статистических программ SPSS®, версия 23.0 (IBM, США).
Статистически значимыми считали различия/связи при p <0,05.
РЕЗУЛЬТАТЫ
Формирование выборки исследования
За период проведения исследования лабораторно подтверждённый ПГПТ установлен у 1150 пациентов, из них у 760 — были данные предоперационной топической диагностики образований паращитовидных желёз с применением УЗИ, радионуклидных методов и КТ с контрастным усилением. Для проведения исследования сформировали три группы:
- 1-я группа — пациенты без патологии щитовидной железы (n=50);
- 2-я группа — с аутоиммунными заболеваниями щитовидной железы: диффузный токсический зоб (n=4), хронический аутоиммунный тиреоидит (n=46);
- 3-я группа — с узловым зобом: одноузловой (n=6), множественные узлы щитовидной железы (n=44) (рис. 1).

Рис. 1. Формирование выборки исследования. ОФЭКТ/КТ — однофотонная эмиссионная компьютерная томография, совмещённая с рентгеновской компьютерной томографией.
Характеристика групп исследования
Сравниваемые группы сопоставимы по полу, возрасту и лабораторным показателям, характеризующим гиперпаратиреоз (табл. 1). Вместе с тем они различались по морфологическим характеристикам щитовидной железы и образований (опухолей) паращитовидных желёз.
Таблица 1. Сравнительная характеристика групп исследования | ||||
Показатели | 1-я группа, n=50 | 2-я группа, n=50 | 3-я группа, n=50 | p |
Возраст, лет | 58 [47; 65] | 60,5 [55; 67] | 60 [55; 65] | 0,314 |
Женский пол, n (%) | 47 (94) | 49 (98) | 50 (100) | 0,324 |
Паратгормон, пг/мл | 132 [99; 174] | 150 [110; 199] | 158 [125; 210]5 | 0,054 |
Кальций общий, ммоль/л | 0,85 | |||
Кальций ионизированный, ммоль/л | 0,972 | |||
Объём щитовидной железы, см3 | <0,001 | |||
Объём опухоли паращитовидной железы, см3 | 0,36 [0,25; 0,79 | <0,001 | ||
Плотность щитовидной железы, HU | 98 [90; 110] | 62 [58; 70] | 81,5 [75; 90] | <0,001 |
Усиленная васкуляризация щитовидной железы, n (%)7 | 0 (0) | 37 (90) | 3 (8) | <0,001 |
Примечание. Результаты количественных признаков представлены в виде Me [Q1; Q3], где Me — медиана, Q1 и Q3 — 1-й и 3-й квартиль соответственно. 1 — n=48; 2 — n=42; 3 — n=47; 4 — n=46; 5 — n=49; 6 — n=45; 7 — n=40, определяли с помощью полуколичественной шкалы по данным ультразвукового исследования (2 и 3 балла — умеренная и выраженная васкуляризация соответственно). | ||||
Основные результаты исследования
УЗИ 46 пациентов проводили и оценивали специалисты НМИЦ эндокринологии, у 4 — данные заимствованы из заключений, оформленных в других медицинских учреждениях.
У пациентов 1-й группы все методы топической диагностики продемонстрировали высокую диагностическую точность (чувствительность и ПЦПР более 82 и 91% соответственно) (табл. 2, 3). Чувствительность КТ с контрастным усилением в 1-й группе составила 100%, однако из-за небольшого количества пациентов (n=11) полный анализ эффективности этого метода невозможен. У пациентов 2-й группы наиболее информативным был метод КТ с контрастным усилением (n=25), тогда как чувствительность методов радионуклидной визуализации (планарная сцинтиграфия, ОФЭКТ/КТ) была заметно ниже при относительно высоких показателях ПЦПР (>75%). В 3-й группе максимальные значения чувствительности отмечены для ОФЭКТ/КТ. Высокой уровень ПЦПР (>90%) в этой группе показан для ОФЭКТ/КТ, УЗИ и КТ с контрастным усилением (n=20). Наиболее низкие показатели диагностической точности отмечены для планарной сцинтиграфии.
Таблица 2. Чувствительность методов топической диагностики в обнаружении образований паращитовидных желёз | |||
Методы | Чувствительность, % (95% доверительный интервал) | ||
1-я группа, n=50 | 2-я группа, n=50 | 3-я группа, n=50 | |
Планарная сцинтиграфия | 82 (82–82) | 36 (36–42) | 68 (68–75) |
Однофотонная эмиссионная компьютерная томография, совмещённая с рентгеновской компьютерной томографией | 98 (98–100) | 54 (54–60) | 85 (85–90) |
Ультразвуковое исследование | 88 (88–90) | 62 (62–66) | 75 (75–79) |
Компьютерная томография с контрастным усилением | 100 (100–100) | 79 (79–83) | 74 (74–79) |
Таблица 3. Прогностическая ценность положительного результата сравниваемых методов топической диагностики образования паращитовидных желёз | |||
Методы | Чувствительность, % (95% доверительный интервал) | ||
1-я группа, n=50 | 2-я группа, n=50 | 3-я группа, n=50 | |
Планарная сцинтиграфия | 100 (100–100) | 76 (76–89) | 73 (73–81) |
Однофотонная эмиссионная компьютерная томография, совмещённая с рентгеновской компьютерной томографией | 96 (96–98) | 86 (86–94) | 91 (91–96) |
Ультразвуковое исследование | 98 (98–100) | 91 (91–97) | 92 (92–97) |
Компьютерная томография с контрастным усилением | 91 (91–91) | 95 (95–100) | 93 (93–100) |
У пациентов 1-й группы наибольшая чувствительность отмечена для комбинации УЗИ и ОФЭКТ/КТ, 2-й группы — для комбинации УЗИ и КТ с контрастным усилением, 3-й группы — для комбинации УЗИ и ОФЭКТ/КТ (табл. 4).
Таблица 4. Сравнительная таблица чувствительности комбинаций методов топической диагностики в обнаружении образований паращитовидных желёз | |||
Методы | Чувствительность, % (95% доверительный интервал) | ||
1-я группа, n=50 | 2-я группа, n=50 | 3-я группа, n=50 | |
Ультразвуковое исследование + Планарная сцинтиграфия | 92 (92–92) | 68 (68–68) | 82 (82–82) |
Ультразвуковое исследование + Однофотонная эмиссионная компьютерная томография, совмещённая с рентгеновской компьютерной томографией | 96 (96–96) | 74 (74–74) | 88 (88–88) |
Ультразвуковое исследование + Компьютерная томография с контрастным усилением | 100 (100–100) | 85 (85–85) | 80 (80–80) |
Однофотонная эмиссионная компьютерная томография, совмещённая с рентгеновской компьютерной томографией + Компьютерная томография с контрастным усилением | 90 (90–90) | 76 (76–76) | 80 (80–80) |
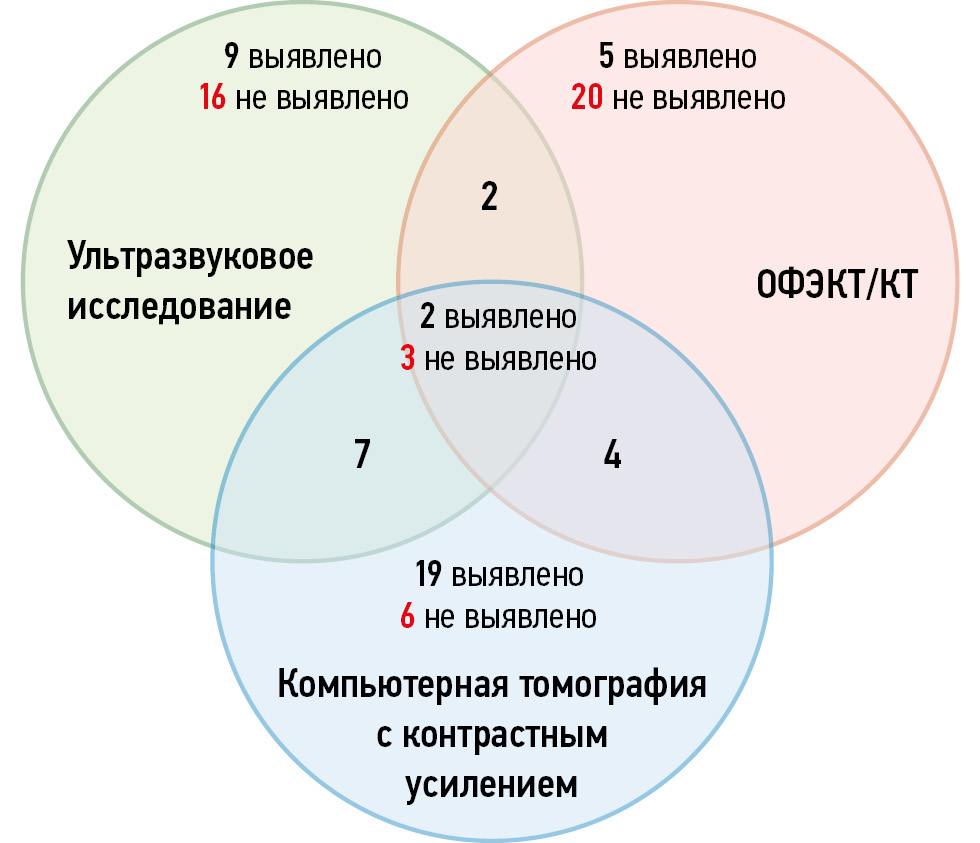
Следует отметить, что 25 пациентам 2-й группы выполнены все три метода топической диагностики. При этом выявлена высокая дискордантность полученных результатов (рис. 2). Только в 2 из 25 случаев локализация образований паращитовидных желёз правильно определена данными методами. У трёх пациентов ни одни из методов не позволил корректно выявить их расположение. Наибольшее количество совпадений положительных результатов отмечено при сочетании УЗИ и КТ с контрастным усилением (n=7), а наименьшее — при комбинации УЗИ и ОФЭКТ/КТ (n=2).

Рис. 2. Совпадение топических данных ультразвукового исследования, однофотонной эмиссионной компьютерной томографии, совмещённой с рентгеновской компьютерной томографией, и компьютерной томографией с контрастным усилением у пациентов 2-й группы. ОФЭКТ/КТ — однофотонная эмиссионная компьютерная томография, совмещённая с рентгеновской компьютерной томографией.
Предикторы результата диагностики методом однофотонной эмиссионной компьютерной томографии, совмещённой с рентгеновской компьютерной томографией
В числе факторов, ассоциированных с результатом диагностики образований паращитовидной железы методом ОФЭКТ/КТ, одномерный анализ выделил объём и плотность щитовидной железы, а также выраженность её васкуляризации по данным УЗИ (табл. 5). Согласно результатам ROC-анализа, площадь под кривой (Area Under the Curve, AUC) для показателя объёма щитовидной железы составила 0,765 (95% ДИ 0,623–0,908), пороговое значение согласно критерию Юдена — 13,2 см3. При объёме щитовидной железы ≥13,2 см3 вероятность положительного результата топической диагностики методом ОФЭКТ/КТ у пациентов с аутоиммунным заболеванием щитовидной железы заметно ниже, чем у лиц с меньшим объёмом железы (табл. 6).
Таблица 5. Факторы, ассоциированные с выявлением образования паращитовидной железы методом однофотонной эмиссионной компьютерной томографии, совмещённой с рентгеновской компьютерной томографией | |||
Показатели | Образование выявлено, n=111 | Образование не выявлено, n=39 | p |
Заболевание щитовидной железы отсутствует, n (%) | 47 (42) | 3 (8) | <0,001 |
Аутоиммунное заболевание щитовидной железы, n (%) | 25 (23) | 25 (64) | <0,001 |
Узлы щитовидной железы, n (%) | 39 (35) | 11 (28) | <0,001 |
Возраст, лет | 61 [53; 66] | 58 [52; 64] | 0,341 |
Женский пол, n (%) | 109 (98) | 37 (95) | 0,277 |
Объём щитовидной железы, см3 | <0,001 | ||
Плотность щитовидной железы, HU | 86 [76; 100] | 64 [54; 75] | <0,001 |
Паратгормон, пг/мл | 148 [111; 200] | 142,5 [110; 177]3 | 0,732 |
Кальций общий, ммоль/л | 0,506 | ||
Кальций ионизированный, ммоль/л | 0,485 | ||
Усиленная васкуляризация щитовидной железы, n (%)7 | 21 (21)2 | 19 (68)6 | 0,001 |
Примечание. Результаты количественных признаков представлены в виде Me [Q1; Q3], где Me — медиана, Q1 и Q3 — 1-й и 3-й квартиль соответственно. 1 — n=108; 2 — n=102; 3 — n=38; 4 — n=37; 5 — n=35; 6 — n=28; 7 — определяли с помощью полуколичественной шкалы по данным ультразвукового исследования (2 и 3 балла — умеренная и выраженная васкуляризация соответственно). | |||
Таблица 6. Диагностика образований паращитовидной железы по данным однофотонной эмиссионной компьютерной томографии, совмещённой с рентгеновской компьютерной томографией, у пациентов с аутоиммунным заболеванием щитовидной железы с учётом её объёма | |||
Объём щитовидной железы | Образование не выявлено, n=25 | Образование выявлено, n=22 | Всего, n=47 |
≥13,2 см3, n | 21 | 6 | 27 |
<13,2 см3, n | 4 | 16 | 20 |
Примечание. Показатели диагностической точности для порогового значения объёма щитовидной железы 13,2 см3: чувствительность — 84% (95% ДИ 69–94); специфичность — 73% (95% ДИ 56–84), прогностическая ценность положительных результатов — 78% (95% ДИ 64–87); прогностическая ценность отрицательных результатов — 80% (95% ДИ 61–92). Данные трёх пациентов с положительным результатом топической диагностики не учитывали в связи с отсутствием сведений об объёме щитовидной железы. ДИ — доверительный интервал. | |||
ОБСУЖДЕНИЕ
Резюме основного результата исследования
У пациентов с ПГПТ в случае отсутствия или наличия узловой патологии щитовидной железы наилучшие результаты при визуализации образований паращитовидных желёз демонстрирует метод ОФЭКТ/КТ, а также его комбинация с УЗИ. У пациентов с аутоиммунным заболеванием щитовидной железы максимальные значения диагностической точности отмечены для КТ с контрастным усилением, а также её комбинации с УЗИ. Диагностическая точность радионуклидной диагностики образований паращитовидных желёз у пациентов с аутоиммунным заболеванием щитовидной железы ассоциирована с объёмом, плотность и её васкуляризацией.
Обсуждение результатов исследования
Наиболее распространёнными методами предоперационной диагностики образований паращитовидных желёз у пациентов с ПГПТ является сочетание радионуклидной визуализации с 99mTc-MIBI и УЗИ шеи, что обеспечивает чувствительность на уровне 81–95% [21]. Наше исследование подтверждает высокую эффективность данной комбинации методов диагностики у пациентов без сопутствующей патологии щитовидной железы (чувствительность комбинации планарной сцинтиграфии и УЗИ — 92%, ОФЭКТ/КТ и УЗИ — 96%). Вместе с тем мы установили, что точность всех методов визуализации при наличии заболеваний щитовидной железы ниже, чем при их отсутствии. Для радионуклидной визуализации наименьшая чувствительность отмечена для случаев сочетания ПГПТ с аутоиммунным заболеванием щитовидной железы (для планарной сцинтиграфии показатель ниже на 46%, для ОФЭКТ/КТ — на 44% в сравнении с чувствительностью методов в группе пациентов без патологии щитовидной железы).
По данным литературы, аутоиммунные заболевания щитовидной железы диагностируют у 4–57% пациентов с ПГПТ [12–14], однако их влияние на результаты радионуклидной визуализации изучены недостаточно. Так, в руководстве Европейского общества ядерной медицины (European Association of Nuclear Medicine, EANM) воспалительные тиреоидиты рассматривают среди основных причин ложноположительных результатов при визуализации с 99mTc-MIBI. Кроме того, высказывают предположение, что радионуклидная визуализация, в отличие от УЗИ, позволяет легче распознавать типично расположенные гиперфункционирующие паращитовидные железы на фоне тиреоидита [21]. В нашем исследовании до 85% всех случаев ложных результатов при выполнении планарной сцинтиграфии и ОФЭКТ/КТ у пациентов с ПГПТ и сопутствующим аутоиммунным заболеванием щитовидной железы классифицированы как ложноотрицательные. Это согласуется с ранее проведёнными исследованиями, где показано, что среди всех ложноотрицательных результатов сцинтиграфии и ОФЭКТ с 99mTc-MIBI 66,7% случаев связаны с аутоиммунным заболеванием щитовидной железы (тиреоидит Хашимото, болезнь Грейвса), тогда как ложноположительных результатов — не выявлено [17].
Одной из основных причин снижения диагностической точности радионуклидной визуализации образований паращитовидных желёз при сопутствующем аутоиммунном заболевании щитовидной железы является повышенный захват и стойкая ретенция 99mTc-MIBI в её ткани [22–24]. Наши неопубликованные данные свидетельствуют о том, что при аутоиммунном заболевании щитовидной железы накопление 99mTc-MIBI в тиреоидной ткани даже на отсроченных снимках нередко превышает его содержание в образовании паращитовидной железы, что сильно затрудняет визуализацию, особенно при использовании планарной сцинтиграфии. В то же время у пациентов с атрофической формой хронического аутоиммунного тиреоидита, обусловленной длительным гипотиреозом и выраженными фиброзными изменениями, отмечают низкий захват 99mTc-MIBI и значительное уменьшение объёма щитовидной железы [22]. В подобных случаях, по нашим неопубликованным данным, накопление радиофармпрепарата в щитовидной железе не влияет на интерпретацию сцинтиграфических изображений.
При задержке 99mTc-MIBI в тиреоидной ткани при отсроченном сканировании у пациентов с аутоиммунным поражением щитовидной железы диагностическая точность ОФЭКТ/КТ в отношении случаев образований паращитовидных желёз выше, чем при проведении планарной сцинтиграфии [18]. Безусловно, анатомическая составляющая гибридного метода ОФЭКТ/КТ повышает диагностическую точность по сравнению с изолированной ОФЭКТ. Однако изменения щитовидной железы при гипертрофической форме аутоиммунного тиреоидита и болезни Грейвса, приводящие к увеличению её объёма, бугристости контуров, снижению плотности паренхимы до 50–70 HU, а также увеличению количества и размеров паратрахеальных реактивно изменённых лимфатических узлов, в определённых случаях затрудняют визуализацию юкстатиреоидно расположенных образований паращитовидных желёз на нативных изображениях КТ [25, 26]. Установленное в нашем исследовании пороговое значение для объёма щитовидной железы (13,2 см3) подтверждает более низкую вероятность обнаружения образований паращитовидных желёз у пациентов с ПГПТ и аутоиммунным заболеванием щитовидной железы методом ОФЭКТ/КТ при большем объёме железы. При этом точность КТ с контрастным усилением в таких случаях снижается не так заметно. Как следствие, комбинация УЗИ и КТ с контрастным усилением у пациентов с ПГПТ и аутоиммунным заболеванием щитовидной железы на 11% точнее широко распространённой в диагностике образований паращитовидных желёз комбинации УЗИ и ОФЭКТ/КТ.
У пациентов с ПГПТ и узлами щитовидной железы наибольшую точность в диагностике образований паращитовидных желёз продемонстрировала ОФЭКТ/КТ. В большинстве случаев наличие узлов не затрудняло выявление аденомы паращитовидной железы. В нашем исследовании в 18% случаев образования паращитовидных желёз и узлы щитовидной железы расположены рядом, их определяли на планарных снимках и изображениях ОФЭКТ единым фокусом накопления радиофармпрепарата. Анатомическая визуализация с помощью КТ — компонента гибридного метода ОФЭКТ/КТ — играла решающую роль в локализации образований паращитовидных желёз у этих пациентов.
Основываясь на полученных в настоящем исследовании оценках диагностической точности методов топической диагностики и факторах, ассоциированных с результатом ОФЭКТ/КТ у пациентов с аутоиммунным заболеванием щитовидной железы, предложен алгоритм топической диагностики образований паращитовидных желёз у пациентов с ПГПТ и сопутствующей патологией щитовидной железы (рис. 3). Методика тонкоигольной аспирационной биопсии со смывом из иглы на паратгормон в этом алгоритме не является альтернативой или самостоятельным методом топической диагностики образований паращитовидных желёз, но как уточняющий метод позволяет дифференцировать паратиреоидную ткань от тиреоидной и лимфатических узлов.

Рис. 3. Алгоритм топической диагностики образований паращитовидных желёз у пациентов с первичным гиперпаратиреозом и сопутствующей патологией щитовидной железы. ПГПТ — первичный гиперпаратиреоз; ЩЖ — щитовидная железа; ДТЗ — диффузный токсический зоб; ХАИТ — хронический аутоиммунный тиреоидит; АТ-ТПО — антитела к тиреопероксидазе; АТ-ТГ — антитела к тиреоглобулину; УЗИ — ультразвуковое исследование; ОФЭКТ — однофотонная эмиссионная компьютерная томография; ОФЭКТ/КТ — однофотонная эмиссионная компьютерная томография, совмещённая с рентгеновской компьютерной томографией; КТ — компьютерная томография; ПЭТ/КТ — позитронно-эмиссионная томография, совмещённая с компьютерной томографией; МРТ — магнитно-резонансная томография; ТАБ — тонкоигольная аспирационная биопсия; ПЩЖ — паращитовидная железа.
Ограничения исследования
В исследовании сформирована «удобная выборка», не обладающая репрезентативностью, в том числе вследствие того, что данные получены в специализированном лечебном учреждении третьего уровня оказания медицинской помощи. Следует отметить, что небольшое количество мужчин в выборке обусловлено более высокой распространённостью сочетания гиперпаратиреоза и патологии щитовидной железы среди женщин [27]. Кроме того, из исследования исключены пациенты с атипичной локализацией образований паращитовидных желёз. В связи с этим рассчитанные показатели диагностической точности методов топической визуализации могут быть распространены только на случаи типичного расположения аденом паращитовидных желёз (у задней поверхности доли щитовидной железы или у нижнего полюса её доли), составляющих до 80–85% случаев этой патологии [28].
Необходимо отметить, что не всем пациентам, данные которых включены в исследование, провели КТ с контрастным усилением, поскольку при аденоме паращитовидных желёз диагностическими методами первой линии являются УЗИ, сцинтиграфия и ОФЭКТ/КТ [29]. Проведение рентгенологического исследования (КТ) в дополнение к этим методам привело бы к неоправданному повышению дозы облучения пациентов. Данный фактор мог повлиять на результаты расчётов диагностических характеристик КТ с контрастным усилением. Кроме того, следует принять во внимание, что в отдельных случаях интервал между проведением инструментальной диагностики и выполнением паратиреоидэктомии достигал 12 месяцев. Однако, по нашему мнению, это обстоятельство не могло повлиять на частоту расхождений результатов при определении наличия/локализации образований паращитовидных желёз.
И, наконец, следует учитывать ретроспективный характер настоящего исследования.
ЗАКЛЮЧЕНИЕ
У пациентов с ПГПТ сопутствующие заболевания щитовидной железы ассоциированы с более низкой диагностической точностью всех методов предоперационной топической диагностики образований паращитовидных желёз. Наименьшие показатели диагностической точности радионуклидной визуализации (планарная сцинтиграфия, ОФЭКТ/КТ) отмечены для случаев ПГПТ и сопутствующих аутоиммунных заболеваний щитовидной железы. В этих случаях предпочтительно применять КТ с контрастным усилением в сочетании с УЗИ. У пациентов с узловой патологией щитовидной железы ОФЭКТ/КТ можно применять в качестве первой линии топической диагностики образований паращитовидных желёз. Результаты радионуклидной диагностики образований паращитовидных желёз у пациентов с ПГПТ зависят от объёма, плотности и васкуляризации щитовидной железы.
ДОПОЛНИТЕЛЬНАЯ ИНФОРМАЦИЯ
Вклад авторов. М.В. Дегтярёв — концепция и дизайн исследования, сбор и анализ литературных данных, написание текста рукописи, создание графических материалов; П.О. Румянцев — концепция исследования, анализ данных, подготовка и написание текста рукописи; К.Ю. Слащук — анализ данных, написание текста рукописи; С.С. Серженко — анализ данных; А.П. Першина-Милютина — статистический анализ данных. Все авторы одобрили рукопись (версию для публикации), а также согласились нести ответственность за все аспекты настоящей работы, гарантируют надлежащее рассмотрение и решение вопросов, связанных с точностью и добросовестностью любой её части.
Этическая экспертиза. Проведение исследования одобрено локальным этическим комитетом ФГБУ «Национальный медицинский исследовательский центр эндокринологии имени академика И.И. Дедова» (протокол № 1 от 25.01.2017). Все пациенты подписывали добровольное информированное согласие на проводимое обследование.
Источники финансирования. Отсутствуют.
Раскрытие интересов. Авторы заявляют об отсутствии отношений, деятельности и интересов за последние три года, связанных с третьими лицами (коммерческими и некоммерческими), интересы которых могут быть затронуты содержанием статьи.
Оригинальность. При создании настоящей работы авторы не использовали ранее опубликованные сведения (текст, иллюстрации, данные).
Доступ к данным. Редакционная политика в отношении совместного использования данных к настоящей работе не применима.
Генеративный искусственный интеллект. При создании настоящей статьи технологии генеративного искусственного интеллекта не использовали.
Рассмотрение и рецензирование. Настоящая работа подана в журнал в инициативном порядке и рассмотрена по обычной процедуре. В рецензировании участвовал один внешний рецензент, член редакционной коллегии и научный редактор издания.
ADDITIONAL INFORMATION
Author contributions: M.V. Degtyarev: conceptualization, methodology, investigation, writing—original draft, visualization; P.O. Rumyantsev: conceptualization, formal analysis, writing—original draft; K.Yu. Slashchuk: formal analysis, writing—original draft; S.S. Serzhenko: formal analysis; A.P. Pershina-Miliutina: formal analysis. All the authors approved the version of the manuscript to be published and agreed to be accountable for all aspects of the work, ensuring that questions related to the accuracy or integrity of any part of the work are appropriately investigated and resolved.
Ethics approval: The study was approved by the local Ethics Committee of the National Medical Research Center for Endocrinology (Minutes No. 1 dated January 25, 2017). All patients provided written informed consent to undergo the examination.
Funding sources: No funding.
Disclosure of interests: The authors have no relationships, activities, or interests for the last three years related to for-profit or not-for-profit third parties whose interests may be affected by the content of the article.
Statement of originality: No previously obtained or published material (text, images, or data) was used in this study or article.
Data availability statement: The editorial policy regarding data sharing does not apply to this work.
Generative AI: No generative artificial intelligence technologies were used to prepare this article.
Provenance and peer-review: This article was submitted unsolicited and reviewed following the standard procedure. The peer review process involved one external reviewer, a member of the Editorial Board, and the in-house science editor.
1 JavaStat — 2-way Contingency Table Analysis [Internet]. В: StatPages.info, 2009–2024. Режим доступа: https://statpages.info/ctab2x2.html Дата обращения: 13.11.2024.
About the authors
Mikhail V. Degtyarev
Endocrinology Research Centre
Email: germed@mail.ru
ORCID iD: 0000-0001-5652-2607
SPIN-code: 7725-7831
MD
Russian Federation, MoscowPavel O. Rumyantsev
Clinics group “My Medical Center”
Email: pavelrum@gmail.com
ORCID iD: 0000-0002-7721-634X
SPIN-code: 7085-7976
MD, Dr. Sci. (Medicine)
Russian Federation, Saint PeterburgSergei S. Serzhenko
Endocrinology Research Centre
Author for correspondence.
Email: vv1ld@yandex.ru
ORCID iD: 0000-0003-2326-1396
SPIN-code: 4713-8986
MD
Russian Federation, MoscowKonstantin Yu. Slashchuk
Endocrinology Research Centre
Email: slashuk911@gmail.com
ORCID iD: 0000-0002-3220-2438
SPIN-code: 3079-8033
MD, Cand. Sci. (Medicine)
Russian Federation, MoscowAnastasiia P. Pershina-Miliutina
Endocrinology Research Centre
Email: oa11111998@gmail.com
ORCID iD: 0000-0002-9462-8522
SPIN-code: 6392-5111
MD
Russian Federation, MoscowReferences
- Bilezikian JP, Bandeira L, Khan A, Cusano NE. Hyperparathyroidism. The Lancet. 2018;391(10116):168–178. doi: 10.1016/S0140-6736(17)31430-7 EDN: ZOWPIE
- Mokrysheva NG, Eremkina AK, Kovaleva EV, et al. Modern Problems of Hyper- and Hypoparathyroidism. Terapevticheskii arkhiv. 2021;93(10):1149–1154. doi: 10.26442/00403660.2021.10.201109 EDN: ZGICRX
- Troshina VV, Latkina NV, Mamedova EO, et al. Special Case of primary Hyperparathyroidism Late Diagnosis. Endocrine Surgery. 2019;13(2):95–100. doi: 10.14341/serg10265 EDN: KRPQML
- Minisola S, Gianotti L, Bhadada S, Silverberg SJ. Classical Complications of primary Hyperparathyroidism. Best Practice & Research Clinical Endocrinology & Metabolism. 2018;32(6):791–803. doi: 10.1016/j.beem.2018.09.001
- Laird AM, Libutti SK. Minimally Invasive Parathyroidectomy Versus Bilateral Neck Exploration for Primary Hyperparathyroidism. Surgical Oncology Clinics of North America. 2016;25(1):103–118. doi: 10.1016/j.soc.2015.08.012
- Kim WW, Lee YM, Sung TY, et al. Selection of Parathyroidectomy Methods for Primary Hyperparathyroidism According to Concordance Between Ultrasonography and MIBI Scan Results. Gland Surgery. 2021;10(1):298–306. doi: 10.21037/gs-20-611 EDN: NNWEBP
- Alenezi SA, Asa'ad SM, Elgazzar AH. Scintigraphic Parathyroid Imaging: Concepts and New Developments. Research and Reports in Nuclear Medicine. 2015;2015(5):9–18. doi: 10.2147/RRNM.S59557
- Kim Y, Jung YH, Hwang KT, Lee HY. Efficacy of 99mTc-Sestamibi SPECT/CT For Minimally Invasive Parathyroidectomy: Comparative Study With 99mTc-Sestamibi Scintigraphy, SPECT, US and CT. Annals of Nuclear Medicine. 2012;26(10):804–810. doi: 10.1007/s12149-012-0641-0 EDN: SHQYMP
- Zarei A, Karthik S, Chowdhury FU, et al. Multimodality Imaging in Primary Hyperparathyroidism. Clinical Radiology. 2022;77(6):e401–e416. doi: 10.1016/j.crad.2022.02.018 EDN: HEEIFP
- Latina A, Castellano E, Cesario F, et al. Unknown and Already Known Thyroid Abnormalities in Primary Hyperparathyroidism. Endocrine Practice. 2018;24(7):628–633. doi: 10.4158/EP-2018-0016
- Morita SY, Somervell H, Umbricht CB, et al. Evaluation for Concomitant Thyroid Nodules and Primary Hyperparathyroidism in Patients Undergoing Parathyroidectomy or Thyroidectomy. Surgery. 2008;144(6):862–867. doi: 10.1016/j.surg.2008.07.029
- Cuhaci N, Ozdemir D, Polat B, et al. Concomitant Thyroid Lesions in Patients With Primary Hyperparathyroidism. Asian Journal of Surgery. 2017;40(5):338–344. doi: 10.1016/j.asjsur.2015.10.006
- Zheng Y, Xu S, Wang P, Chen L. Preoperative Localization and Minimally Invasive Management of Primary Hyperparathyroidism Concomitant With Thyroid Disease. Journal of Zhejiang University SCIENCE B. 2007;8(9):626–631. doi: 10.1631/jzus.2007.B0626
- Chatzidakis S, Lamnisos D, Constantinides V, et al. Impact of Autoimmune Thyroiditis on Primary Hyperparathyroidism. Journal of Medical Science. 2023;92(1):e737. doi: 10.20883/medical.e737 EDN: GZBNJD
- Frank E, Ale-Salvo D, Park J, et al. Preoperative Imaging for Parathyroid Localization in Patients With Concurrent Thyroid Disease: A Systematic Review. Head & Neck. 2018;40(7):1577–1587. doi: 10.1002/hed.25111
- Piccin O, D'Alessio P, Cioccoloni E, et al. Pre-operative Imaging Workup for Surgical Intervention in Primary Hyperparathyroidism: A Tertiary Referral Center Experience. American Journal of Otolaryngology. 2021;42(1):102819. doi: 10.1016/j.amjoto.2020.102819 EDN: CNIJKE
- Boi F, Lombardo C, Cocco MC, et al. Thyroid Diseases Cause Mismatch Between MIBI Scan and Neck Ultrasound in the Diagnosis of Hyperfunctioning Parathyroids: Usefulness of FNA–PTH assay. European Journal of Endocrinology. 2013;168(1):49–58. doi: 10.1530/EJE-12-0742
- Hwang SH, Rhee Y, Yun M, et al. Usefulness of SPECT/CT in Parathyroid Lesion Detection in Patients with Thyroid Parenchymal 99mTc-Sestamibi Retention. Nuclear Medicine and Molecular Imaging. 2016;51(1):32–39. doi: 10.1007/s13139-016-0438-5 EDN: FGPBAW
- Gómez-Ramírez J, Sancho-Insenser JJ, Pereira JA, et al. Impact of Thyroid Nodular Disease on 99mTc-Sestamibi Scintigraphy in Patients With Primary Hyperparathyroidism. Langenbeck's Archives of Surgery. 2010;395(7):929–933. doi: 10.1007/s00423-010-0680-8 EDN: JBXIUC
- Blanco-Saiz I, Goñi-Gironés E, Ribelles-Segura MJ, et al. Preoperative Parathyroid Localization. Relevance of MIBI SPECT-CT in Adverse Scenarios. Endocrinol Diabetes Nutr (Engl Ed). 2023;70 suppl. 2:35–44. doi: 10.1016/j.endien.2022.11.025
- Petranović Ovčariček P, Giovanella L, Carrió Gasset I, et al. The EANM Practice Guidelines for Parathyroid Imaging. European Journal of Nuclear Medicine and Molecular Imaging. 2021;48(9):2801–2822. doi: 10.1007/s00259-021-05334-y EDN: FKUMFB
- Santos AO, Zantut-Wittmann DE, Nogueira RO, et al. 99mTc-Sestamibi Thyroid Uptake in Euthyroid Individuals and in Patients With Autoimmune Thyroid Disease. European Journal of Nuclear Medicine and Molecular Imaging. 2005;32(6):702–707. doi: 10.1007/s00259-004-1728-1 EDN: ALHSWD
- Hiromatsu Y, Ishibashi M, Nishida H, et al. Technetium-99m Sestamibi Imaging in Patients with Subacute Thyroiditis. Endocrine Journal. 2003;50(3):239–244. doi: 10.1507/endocrj.50.239
- Kao CH, Wang SJ, Liao SQ, et al. Quick Diagnosis of Hyperthyroidism With Semiquantitative 30-minute Technetium-99m-Methoxy-Isobutyl-Isonitrile Thyroid Uptake. J Nucl Med. 1993;34(1):71–74. Available from: https://jnm.snmjournals.org/content/34/1/71.long
- Bin Saeedan M, Aljohani IM, Khushaim AO, et al. Thyroid Computed Tomography Imaging: Pictorial Review of Variable Pathologies. Insights into Imaging. 2016;7(4):601–617. doi: 10.1007/s13244-016-0506-5 EDN: HBGTRS
- Chaudhary P, Pamnani J, Rana K, Khandekar AK. Exploring the Association Between Thyroid Density Assessed by Non-contrast Computed Tomography and Serum Thyroid-Stimulating Hormone (TSH) Levels in Hypothyroid Patients. Cureus. 2023;15(11):e48653. doi: 10.7759/cureus.48653 EDN: YASQQG
- Mokrysheva NG, Eremkina AK, Elfimova AR, et al. The Russian registry of primary hyperparathyroidism, latest update. Front. Endocrinol. 2023;14:1203437. doi: 10.3389/fendo.2023.1203437
- Policeni, B.A., Smoker W.R.K., Reede D.L. Anatomy and Embryology of the Thyroid and Parathyroid Glands. Seminars in Ultrasound, CT and MRI. 2012;33(2):104–114.
- LORYŚ, Laura, KLIMCZAK, Klaudia, BUDZYŃSKA, Kamila, et al. Comparison of first- and second-line imaging diagnostics (ultrasound + scintigraphy and PET + 4DCT) in visualizing parathyroid glands in primary hyperparathyroidism including ectopic foci. Journal of Education, Health and Sport. 2025;82:60366. eISSN 2391-8306. doi: 10.12775/JEHS.2025.82.60366
Supplementary files


