

")


Magnetic resonance imaging for the differential diagnosis of primary extra-axial brain tumors: a review of radiomic studies
- Autores: Kapishnikov A.V.1, Surovcev E.N.1,2
-
Afiliações:
- Samara State Medical University
- Dr. Sergey Berezin Medical Institute (MIBS)
- Edição: Volume 4, Nº 4 (2023)
- Páginas: 529-542
- Seção: Systematic reviews
- ##submission.dateSubmitted##: 07.09.2023
- ##submission.dateAccepted##: 19.10.2023
- ##submission.datePublished##: 15.12.2023
- URL: https://jdigitaldiagnostics.com/DD/article/view/569149
- DOI: https://doi.org/10.17816/DD569149
- ID: 569149

Citar

Resumo
BACKGROUND: The analysis of magnetic resonance imaging data is considered the main method for the preoperative differential diagnosis of primary extra-axial tumors. However, the exact distinction of different primary extra-axial tumors based only on visual rating can be challenging. Radiomics is a quantitative method of analyzing medical image data, which allows us to understand and observe the connection between visual data and phenotypic and genotypic features of tumors. Earlier, several publications presented generalized results of research aimed at the differential diagnosis of primary extra-axial tumors based on the principles of radiomics. Fast accumulation of new clinical cases and increasing of the amounts of research on these cases demonstrate the need for their further analysis and systematization, which has led to this review.
AIM: To conduct a systematic analysis of existing data on radiomics potential for the differential diagnosis of primary extra-axial tumors.
MATERIALS AND METHODS: The search for publications over the past 5 years in Russian and English was conducted in PubMed/Medline, Google Scholar, and еLibrary databases. The final analysis included 19 papers on the differential diagnosis of extra-axial tumors. The included publications provided radiomic features used for the differential diagnosis of neoplasms.
RESULTS: All studies demonstrated the existence of a connection between radiomic parameters (textural and histogram) and tumor type. The effectiveness of tumor differential diagnostics with radiomic models exceeded the neoplasm classification made by radiologists. The most frequently used algorithms for creating mathematical models of tumor classification based on radiomic parameters were the reference vector method, logistic regression, and random forest.
CONCLUSION: The use of the radiomic concept shows promising results in the differential diagnosis of primary extra-axial tumors. Further development in this area demands the standardization of both the segmentation method and the set of features and an effective method of mathematics modeling.
Texto integral
BACKGROUND
Preoperative differential diagnosis of primary extra-axial brain tumors (PEABTs) is based on the analysis of magnetic resonance imaging (MRI) semiotics, which most commonly includes a standard set of weighted images (WI), such as T2-WI, T1-WI, FLAIR, diffusion-weighted imaging (DWI), and contrast-enhanced T1-WI (T1-CE) [1–3].
PEABTs include both benign and malignant neoplasms of the meninges (meningiomas and mesenchymal tumors) and cranial nerves (neurinomas) [4].
The MRI semiotics of PEABTs have been studied in detail and described in established guidelines; however, atypical MRI patterns can complicate the differential diagnosis of tumors based on visual assessment alone [5, 6]. Incorrect tumor type determination can result in incorrect treatment [1, 2, 7, 8]. The most common difficulties are differentiating meningiomas of various grades, distinguishing solitary fibrous tumors from meningiomas, and localizing PEABTs in cerebellopontine angles [9–12].
Radiomics is a quantitative approach to medical image analysis and aims to identify the relationship between the digital characteristics of a diagnostic image and phenotypic and genotypic characteristics of a tumor [13].
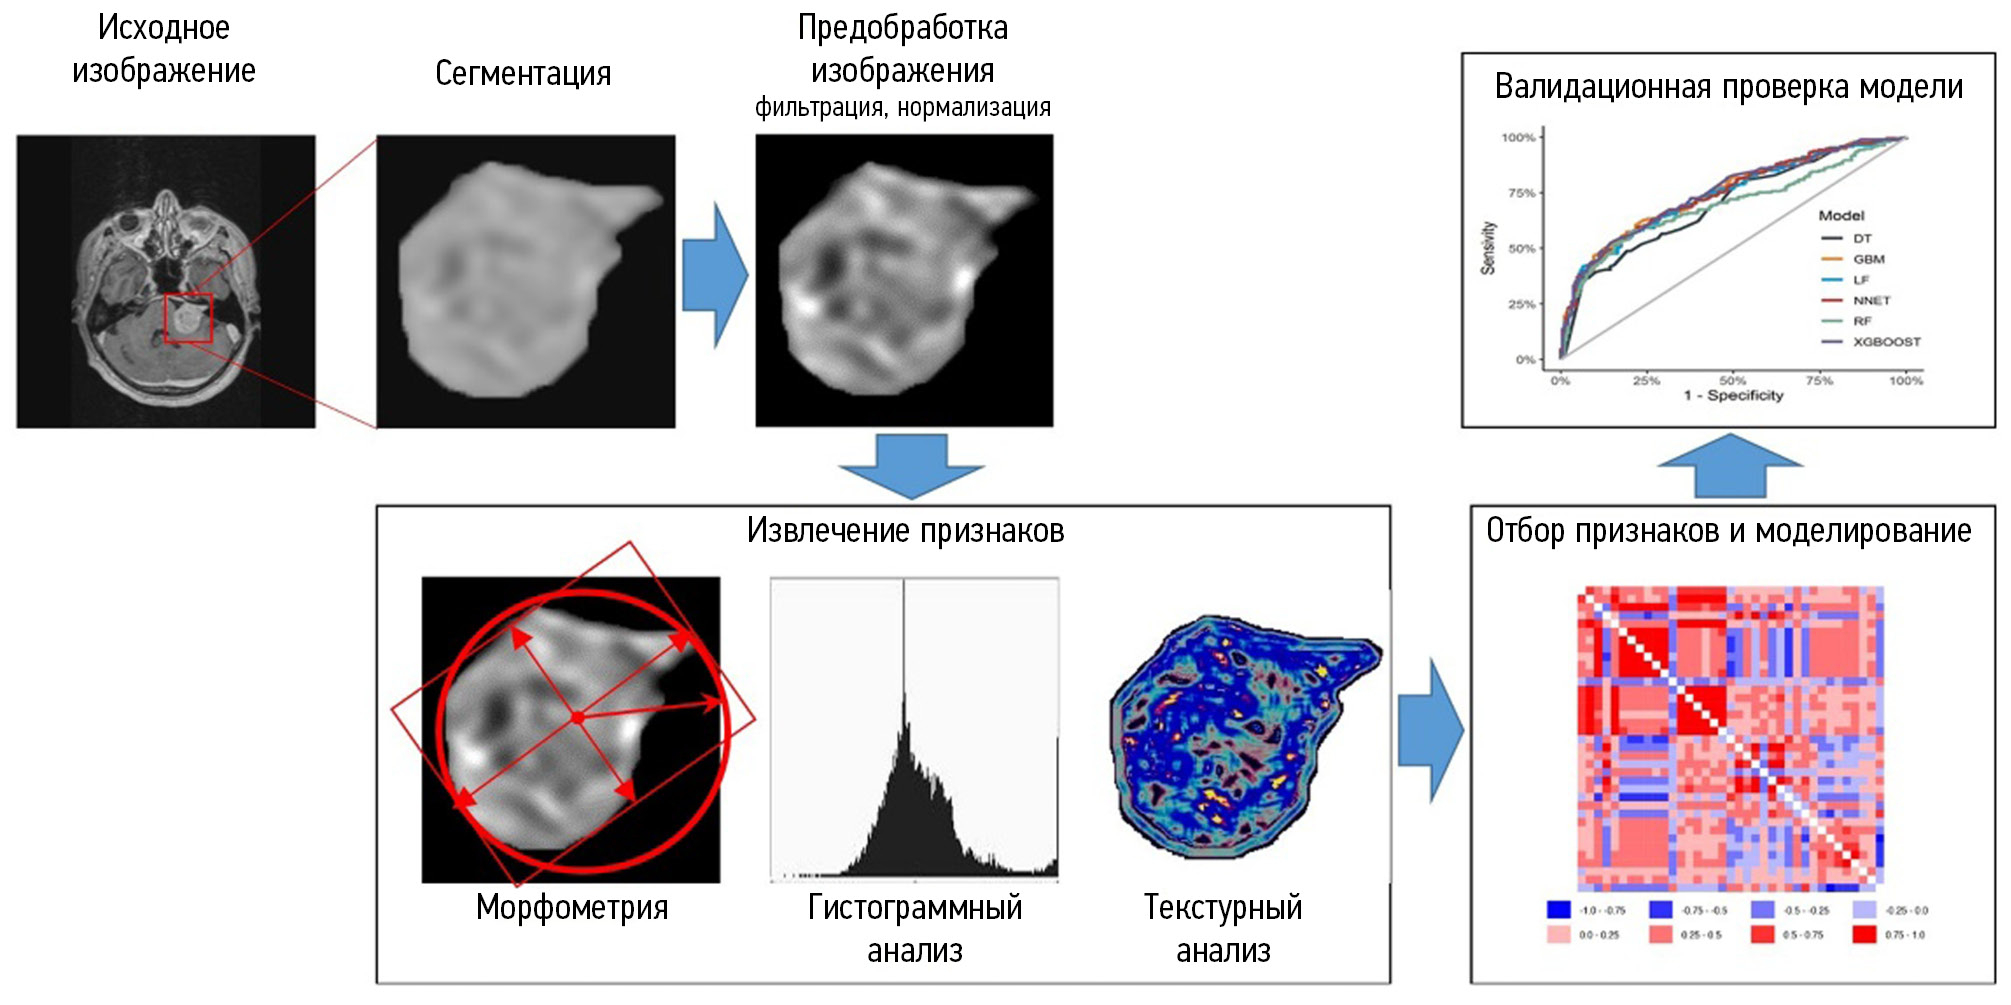
Radiomics involves extracting quantitative features from images to provide an objective description of an imaging phenotype and determine the relationship between radiomic and genetic, molecular, and clinical features of tumors [14]. To extract quantitative parameters from images, morphometric, histogram, and texture analysis of segmented areas of interest is performed. Histogram and texture features reflect structural features not detectable visually [15]. In radiomics studies, various mathematical modeling and deep learning methods are used. The resulting differential diagnostic and prognostic models should be validated using an independent sample. Radiomics may be a powerful tool in clinical decision-making [16]. Figure 1 shows the steps of radiomic analysis.

Fig. 1. Radiomic analysis stages.
Some analytical publications have summarized previous studies on radiomics-based differential diagnosis of PEABTs [13, 17]. The rapid accumulation of new clinical cases and increase in the number of studies related to this problem require further analysis and systematization, and thus, is the basis of the present study.
MATERIALS AND METHODS
A systematic review for the last 5 years was conducted according to PRISMA (Preferred Reporting Items for Systematic Reviews and Meta-Analyses Protocols, 2009).
PubMed/MEDLINE, Google Scholar, and eLibrary databases were searched for scientific articles from the last 5 years using the following keywords: MRI, meningioma, neuroma, schwannoma, solitary fibrous tumor, radiomics, texture, МРТ, менингиома, невринома, шваннома, солитарная фиброзная опухоль, радиомика, текстура.
Articles with abstracts unrelated to the differential diagnosis of PEABTs were excluded, as well as those without a description in text of radiomic features in the differential diagnosis of tumors.
Finally, 19 publications were included in the review. Figure 2 shows the design of the current study.

Fig. 2. Research design.
Estimated parameters
As part of the systematic review, the following parameters were assessed in the selection of publications:
- Diagnostic task
- Number of patients
- Method of tumor segmentation
- WI types
- Significant differential diagnostic features
- Mathematical models used
- Validating the mathematical models used to classify tumors
This review included data from original clinical trials.
RESULTS
Several studies have investigated the effectiveness of radiomic features of MRI images in the differential diagnosis of PEABTs. In total, 121 studies published in the last 5 years were found in PubMed/MEDLINE and Google Scholar for the search query “meningioma or neuroma or schwannoma or solitary fibrous tumor) + (texture or radiomic) + MRI.” For queries with different combinations of the words “MRI, meningioma, neuroma, schwannoma, solitary fibrous tumor, radiomics, and texture,” only one publication was found in eLibrary. After analyzing the publications, 19 articles in English and Russian were included in the review.
Table 1 shows the characteristics of the selected articles according to research design.
Table 1. Diagnostic tasks of radiomic analysis for the differential diagnosis of primary extra-axial brain tumors
1 | 2 | 3 | 4 | 5 | 6 | 7 | 8 |
Authors | Types of tumors | Number of patients | Segmentation | The most informative signs | Method of modeling | Validation (number; %) | Diagnostic information content |
Y.W. Park et al. 2019 [18] | Mb/Mm | 136 | SA | T1-CE (Histo, GLCM, GLRLM) ADC (Histo, GLCM, GLRLM) | RF, SVM | 58; 42.6% | The best model (SVM): AUC 0,86; Acc 89,7%; Sn 75%; Sp 93.5% Other models: AUC 0.74–0.85 |
K.R. Laukamp et al. 2019 [19] | |||||||
Y. Lu et al. 2019 [20] | Gr 1/2/3 | 152 | Man | ADC (Histo, GLCM, GLRLM, AU, Wav) | DT | 46; 30.2% | Radiomics model: Acc, 79.51% Model (semiotics + clinical data): Acc, 62.96% Classification by radiologists: Acc, 61%–62% |
C. Chen et al. 2019 [21] | Gr 1/2/3 | 150 | Man | Shape T1-CE (GLCM, GLRLM, GLSZM) | LDA, SVM | 30; 20% | The best model (LDA): Acc, 75.6% Other models: 57.6%–73.3% |
Y. Zhu et al. 2019 [22] | Mb/Mm | 181 | Man | Shape T1-CE (GLCM, GLRLM, GLSZM) | SVM | 82; 45.3% | The best model: AUC, 0.811; Sn, 76.9%; Sp, 89.8% |
O. Morin et al. 2019 [23] | Mb/Mm | 303 | NA | Shape T1-CE (Histo, Wav GLCM, GLRLM, GLSZM) | RF | 85; 28.1% | Semiotics model: AUC, 0,68; Acc, 62% Radiomics model: AUC, 0,71; Acc, 65% |
X. Li et al. 2019 [24] | Mb/Mm | 90 | Man | Shape T2-WI, T1-WI и T1-CE (Histo) | LR | 28; 31.1% | Models of individual weight types: AUC, 0.781–0.821 |
C. Ke et al. 2020 [25] | Mb/Mm | 263 | Man | T2-WI (GLCM, GLRLM, GLSZM) T1-WI (GLCM) T1-CE (GLRLM, GLSZM) | SVM | 79; 30% | Models of individual weight types: AUC, 0.67–0.75; Acc, 68%–75%; Sn, 42%–74%; Sp, 67%–82% Models of weight combination: AUC, 0.83; Acc, 80%; Sn, 84%; Sp, 78% |
J. Hu et al. 2020 [26] | Mb/Mm | 316 | SA | Shape T2-WI и T1-WI (Wav) T1-CE (Histo, GLSZM, Wav) ADC (Histo, GLCM, Wav) SWI (GLCM, Wav) | RF | NP | Model (semiotics + clinical data): AUC, 0,7 Model (T2-WI + T1-WI + Т1-СЕ): AUC, 0.78; Acc, 74%; Sn, 65.5%; Sp, 77.7% Model (T2-WI + T1-WI + Т1-СЕ + ADC + SWI): AUC, 0.81; Acc, 78%; Sn, 66.7%; Sp, 83% |
Y.W. Park et al. 2019 [18] | Mb/Mm | 136 | SA | T1-CE (Histo, GLCM, GLRLM) ADC (Histo, GLCM, GLRLM) | RF, SVM | 58; 42.6% | The best model (SVM): AUC, 0.86; Acc, 89.7%; Sn, 75%; Sp, 93.5% Other models: AUC, 0.74–0.85 |
K.R. Laukamp et al. 2019 [19] | Mb/Mm | 71 | SA | Shape FLAIR (GLCM) ADC (GLSZM) | LR | NP | Models of weight types: AUC, 0.72–0.8 Models of weight combination: AUC, 0.91; Sn, 79%; Sp, 89% |
H. Chu et al. 2021 [27] | Mb/Mm | 98 | SA | Shape T1-CE (Histo, GLCM, GLRLM, GLSZM) | LR | 30; 30.6% | Radiomics model: AUC, 0.948; Acc, 92.9%; Sn, 91.7%; Sp, 100% |
Y. Han et al. 2021 [28] | Mb/Mm | 131 | NA | Shape Т1 FLAIR (Histo, GLRLM, GLSZM) | LR, RF, SVM, KNN, DT, and XGB | 27; 20.6% | Model T1 FLAIR: AUC, 0.956; Sn, 87%; Sp, 92% Models of weight combination: AUC, 0.922; Sn, 87%; Sp, 93% |
J. Zhang et al. 2022 [29] | Gr 1/2 | 242 | Man | T2-WI (GLRLM, Wav) T1-CE (GLSZM, Wav) | LR | 73; 30.2% | Models of individual weight types: AUC, 0.67–0.717; Acc, 61.1%–69.4%; Sn, 60.7%–75%; Sp, 61.4%–65.9% Models of weight combination: AUC, 0.734; Acc, 72.2%; Sn, 67.9%; Sp, 75% |
Differential diagnosis of meningiomas and solitary fibrous tumors | |||||||
X. Li et al. 2019 [30] | Mb/SFT | 67 | Man | FLAIR, DWI и T1-CE (GLRLM) | SVM | 20; 29.9% | Model T1-CE: AUC, 0.90; Acc, 87.5% Classification by radiologists: AUC, up to 0.7; Acc, up to 77.3% |
J. Dong et al. 2020 [31] | Mb/SFT | 192 | Man | T2-WI (GLCM, GLRLM, GLSZM) T1-WI (Histo, GLCM, GLSZM) T1-CE (Histo, GLCM, GLRLM) | LR | 59; 30.7% | Models of individual weight types: AUC, 0.772–0.864; Acc, 69.5%–81.4%; Sn, 60%–73.3%; Sp, 79.3%–89.7% Models of weight combination: AUC, 0.939; Acc, 83.1; Sn, 90%; Sp, 75.9% |
Y. Fan et al. 2022 [32] | Mb/SFT | 220 | NA | Semiotics T2-WI (Histo, GLCM, GLRLM) T1-CE (GLRLM) | SVM, LR | 73; 33.2% | Models of individual weight types: AUC, 0.75–0.85; Acc, 69.9%–72.6%; Sn, 68.5%–98%; Sp, 13.6%–87.5% Models of weight combination: AUC, 0.9; Acc, 82.2%; Sn, 79.6%; Sp, 87.5% Model (clinical data + semiotics): AUC, 0.79; Acc, 76.7%; Sn, 79.6%; Sp, 70.8% |
J. Wei et al. 2022 [33] | Gr 1–3/ SFT | 292 | Man | T2-WI (Histo, GLCM, GLRLM, GLSZM, NGTDM, Wav) T1-WI (GLCM, Wav, GLRLM) T1-CE (GLCM, Wav, GLSZM) | LR, DT, RF, and SVM | 88; 30.1% | Model (clinical data + semiotics): AUC, 0.766; Acc, 65.9%; Sn, 67.4%; Sp, 64.3% Models of individual weight types: AUC, 0.731–0.818; Acc, 64.8%–71.6%; Sn, 63%–89.1%; Sp, 52.4%–66.7% Models of weight combination: AUC, 0.902; Acc, 81.8%; Sn, 89.1%; Sp, 73.8% |
Differential diagnosis of meningiomas from other PEABTs | |||||||
Z. Tian et al. 2020 [34] | М/C | 127 | Man | Semiotics T2-WI (Histo) T1-CE (Histo, GLCM) | LR | NP | Model AUC Т1-CE: 0.776 |
C. Wang et al. 2022 [35] | М/H | 96 | Man | Shape T2-WI, T1-CE и ADC (Histo, Wav) T1-WI (Histo, GLSZM, GLRLM, Wav) DWI (GLCM, Wav) | KNN, LR, RF, SVM, XGB, and DT | 19; 20% | Classification by radiologists: AUC, 0.545–0.756 Semiotics model: AUC, 0.805 The best model (ADC, SVM): AUC, 0.95 Other radiomics models: AUC, 0.73–0.94 |
Yevvgeniy N. Surovtsev et al. 2023 [36] | Mb/Mm/Н | 66 | А | T2-WI (GLCM, GLRLM, Wav) T1-WI (GLCM Wav) FLAIR (Wav) ADC (GLCM, GLRLM) T1-CE (Histo) | LDA | 27; 40.9% | Semiotics model: AUC, 0.78; Sn, 50%–83.3%; Sp, 75%–81% Radiomics model: AUC, 0.86; Sn, 83.3%–100%; Sp, 91.7%–100% |
Note. Abbreviations: Tumors: Mb, benign meningiomas (grade 1); Mm, malignant meningiomas (grades 2 and 3); М, meningiomas without grade; N, neurinomas; C, craniopharyngiomas; H, hemangiomas; SFT, solitary fibrous tumors; Gr, grade Segmentation: Man, manual; SA, semiautomatic; A, automatic Features: ADC, apparent diffusion coefficient; SWI, susceptibility weighted imaging; Histo, histogram; GLCM, gray level co-occurrence matrix; GLRLM, gray level run length matrix; GLSZM, gray level size zone matrix; NGTDM, gray-tone difference matrix; AU, autoregressive model; Wav, wavelet Mathematical modeling methods: LR, logistic regression; NB, naive Bayes classifier; SVM, support vector machine; TC, text categorization; KNN, K-nearest neighbors method; DT, decision tree; RF, random forest; LDA, linear discriminant analysis; XGB, extreme gradient boost; MLP, multilayer perceptron Test information parameters: Acc, accuracy; Sn, sensitivity; Sp, specificity; AUC, area under the curve Other: NP, not performed; NA, not available
DISCUSSION
Differential diagnosis
Twelve studies were found to have investigated the differential diagnosis of benign and malignant meningiomas. The differential diagnosis of meningiomas and solitary fibrous tumors was evaluated in four studies, and the differentiation between meningioma and hemangioma/craniopharyngioma/neurinoma was examined in one study.
Most studies have discussed a “binary” classification between two types of PEABTs [18, 19, 22-32, 34, 35]. Given the similar semiotics of all PEABTs, models capable of performing multiclass rather than binary classification between two prespecified tumor types have an advantage for clinical use. However, only four studies have distinguished between three or more types of PEABTs [20, 21, 33, 36].
Comparison of the effectiveness of tumor classification by visual assessment and models based on mri semiotics or radiomic parameters
Two studies have compared the effectiveness of tumor classification between radiologists and radiomics models [20, 30]. In these studies, the tumor type was determined by a radiologist based on the MRI image, without mathematical modeling based on visual features. The use of radiomics models was advantageous, with an accuracy of 10%–17%.
Five studies have compared the accuracy of tumor classification between models based on MRI semiotics and radiomics features [20, 23, 32, 33, 36]. In these studies, the visual semiotic features were systematized and stratified. Based on these features, mathematical models may be developed.
The use of mathematical semiotic models for tumor classification may be more advantageous over the radiologist’s opinion because a radiologist’s differential diagnosis is largely based on experience and subjective. Moreover, systematizing and integrating the evaluation of MRI semiotic features increases their information value.
Differentiating tumors using models based on radiomic parameters was significantly superior to classifying tumors by radiologists, and their information value was higher than that of semiotic models.
The most valuable studies are those that compare the information value of radiomics models with the results of visual assessment of MRI semiotics. Furthermore, the ability to automate image analysis for computer decision support systems remains an advantage of the radiomics approach.
Patient sample size and model validation
Most studies have included relatively small numbers of patients:
- <100 patients: 6 publications [19, 24, 27, 30, 35, 36],
- 100–200 patients: 7 publications [18, 20-22, 28, 31, 34],
- 200–300 patients: 4 publications [25, 29, 32, 33],
- >300 patients: 2 publications [23, 26].
Larger samples are typical for differential diagnosis studies of meningiomas. The small sample size may be because of the unequal prevalence of the different types of PEABTs. Most PEABTs (> 80%) are benign meningiomas, and other tumors are rare [4], making it challenging to select a large patient population.
Validation was completed in 84.2% of the trials. In most studies, the validated group comprised approximately one-third of the total enrolled patients. Note that the clinical significance of differential diagnostic models is reduced by the lack of testing of model performance on the validation set.
Tumor segmentation
Segmenting the tumor is the first and fundamental step in radiomics analysis [14]. To avoid distortion of radiomic features and ensure reproducibility of results, the segmentation technique should accurately distinguish neoplastic tissue from brain matter and peripheral edema.
Most PEABTs are characterized by a marked increase in MRI signal intensity on T1-WI after contrast administration, whereas the isointense and hypointense MRI signals of adjacent structures are preserved [9]. This feature is the basis for the sharp difference in brightness between the contrasted tumor and adjacent structures and accuracy of tumor margin visualization. Most studies included in the review (63.2%) have performed segmentation specifically on contrast-enhanced T1-WI [18, 21-28, 30, 33, 36].
The segmentation method affects the final simulation result. The automatic and semiautomatic methods have a higher reproducibility than the manual methods in the determination of tumor boundaries [37]. In the presented studies, less preferred manual segmentation was most common [18-20, 22, 23, 27-29, 31-33]. Only five studies have used automated or semiautomated methods [18, 19, 26, 27, 36].
Significant radiomic features
A feature of radiomics studies is the presence of a sufficiently large initial set of parameters, and the most informative parameters are selected to solve the problem. Histogram and texture parameters of tumors are the most informative radiomic features for the differential diagnosis of PEABTs.
The power of radiomics models for the differential diagnosis of PEABTs is increased by expanding the set of radiomic parameters to include different WI types. Seven studies have compared models based on the radiomic parameters of one WI type with models that included the features of different WI types [19, 25, 28, 29, 31-33]. In six of these studies, the advantage of the latter was demonstrated based on a comparison of the information values of the tests [19, 25, 29, 31-33]. One study has revealed the poor results of weight combination models [28].
In comparing the two combined models, Hu et al. [26] have shown that a model containing an extended spectrum of weights (T2-WI, T1-WI, T1-CE, apparent diffusion coefficient [ADC] map, susceptibility weighted imaging [SWI]) was slightly superior to a model based on T2-WI, T1-WI, and T1-CE.
The advantage of models using several types of weights is their ability to reflect different aspects of the tumor. For example, T2-WI and T1-WI reflect the degree of hydration (amount of fluid) in the tumor, T1-CE reflects the permeability of the blood–brain barrier, DWI and ADC reflect the cellularity of the tumor, and SWI is sensitive to hemorrhage and fossilization. Therefore, integrating the parameters within the model allows a more complete representation of the morphological characteristics and better results.
The shape parameter values were limited. The information value of these parameters was evaluated in ten studies [21-23, 26-28, 31-33, 35]. Shape parameters were informative in studies that have performed modeling based on one WI type [21-23, 27, 28, 35]. Three studies [31-33] have shown that shape parameters are uninformative when constructing models that include multiple WI types. In a study by Hu et al. [26], shape parameters were informative and were included in the modeling; however, their proportion was not large compared with that of histogram and texture parameters (the model included 17 histogram and texture parameters and 3 morphometric parameters).
Mathematical modeling methods
In the presented studies, various mathematical modeling methods were used to create models. The most common algorithms were as follows:
- Support vector machine (SVM): 9 studies [18, 21, 22, 25, 28, 30, 32, 33, 35],
- Logistic regression (LR): 10 studies [19, 24, 27-29, 31-35],
- Random forest (RF): 6 studies [18, 23, 26, 28, 33, 35].
Three studies [18, 28, 33] have analyzed the results of tumor classification using models based on these methods and showed conflicting results. In a study by Park et al. [18] (RF and SVM) and in another by Wei et al. [33] (LR, RF, SVM), the methods showed a comparable level of information value. However, in a study by Han et al. [28], the results varied significantly according to the modeling technique (one of the information value parameters of the test, area under the curve (AUC), varied from 0.628 to 0.922), whereas the SVM showed more stable results.
Among all modeling methods, the best information value parameters were demonstrated by LR [27] and SVM [35], wherein the AUC was 0.95.
CONCLUSION
The use of radiomics approach shows promising results in the differential diagnosis of PEABTs. Additionally, clinical practice implementation requires greater methodological rigor in the conduct of radiomics studies, including mandatory validation, standardization of segmentation methods, determination of the required feature set, and more informed choice of mathematical modeling methods. The use of histograms and texture parameters of different WI types for further revealing the potential of radiomics in the differential detection of PEABTs appears favorable.
Prospective studies using automated segmentation methods and an expanded set of WI types and the development of radiomics models that allow multiclass differential diagnosis of PEABTs may lay the foundation for creating powerful tools for digital clinical decision support systems and can ensure optimal patient treatment selection.
ADDITIONAL INFORMATION
Funding source. This study was not supported by any external sources of funding.
Competing interests. The authors declare that they have no competing interests.
Authors’ contribution. All authors made a substantial contribution to the conception of the work, acquisition, analysis, interpretation of data for the work, drafting and revising the work, final approval of the version to be published and agree to be accountable for all aspects of the work. The major contributions were distributed as follows: А.V. Kapishnikov — the concept of the study, approval of the final version; E.N. Surovcev — concept and design of the work, manuscript text writing and editing, collection and processing of materials, data analysis.
Sobre autores
Aleksandr Kapishnikov
Samara State Medical University
Email: a.v.kapishnikov@samsmu.ru
ORCID ID: 0000-0002-6858-372X
Código SPIN: 6213-7455
Scopus Author ID: 6507900025
MD, Dr. Sci. (Med.), Professor
Rússia, SamaraEvgeniy Surovcev
Samara State Medical University; Dr. Sergey Berezin Medical Institute (MIBS)
Autor responsável pela correspondência
Email: evgeniisurovcev@mail.ru
ORCID ID: 0000-0002-8236-833X
Código SPIN: 5252-5661
Scopus Author ID: 57224906215
Rússia, Samara; Togliatti
Bibliografia
- Goldbrunner R, Stavrinou P, Jenkinson MD, et al. EANO guideline on the diagnosis and management of meningiomas. Neuro–Oncology. 2021;23(11):1821–1834. doi: 10.1093/neuonc/noab150
- Goldbrunner R, Weller M, Regis J, et al. EANO guideline on the diagnosis and treatment of vestibular schwannoma. Neuro–Oncology. 2020;22(1):31–45. doi: 10.1093/neuonc/noz153
- Shin DW, Kim JH, Chong S, et al. Intracranial solitary fibrous tumor/hemangiopericytoma: tumor reclassification and assessment of treatment outcome via the 2016 WHO classification. Journal of Neuro–Oncology. 2021;154:171–178. doi: 10.1007/s11060–021–03733–7
- Louis DN, Perry A, Wesseling P, et al. The 2021 WHO Classification of Tumors of the Central Nervous System: a summary. Neuro–Oncology. 2021;23(8):1231–1251. doi: 10.1093/neuonc/noab106
- Fountain DM, Young AMH, Santarius T. Malignant meningiomas. Handbook of Clinical Neurology. 2020;170:245–250. doi: 10.1016/B978–0–12–822198–3.00044–6
- Laviv Y, Thomas A, Kasper EM. Hypervascular Lesions of the Cerebellopontine Angle: The Relevance of Angiography as a Diagnostic and Therapeutic Tool and the Role of Stereotactic Radiosurgery in Management. A Comprehensive Review. World Neurosurgery. 2017;100:100–117. doi: 10.1016/j.wneu.2016.12.091
- Konar S, Jayan M, Shukla D, et al. The risks factor of recurrence after skull base hemangiopericytoma management: A retrospective case series and review of literature. Clinical Neurology and Neurosurgery. 2021;208:106866. doi: 10.1016/j.clineuro.2021.106866
- Kinslow CJ, Bruce SS, Rae AI, et al. Solitary–fibrous tumor/ hemangiopericytoma of the central nervous system: a population–based study. Journal of Neuro–Oncology. 2018;138(1):173–182. doi: 10.1007/s11060–018–2787–7
- Osborn AG, Salzman KL, Jhaveri MD. Diagnostic Imaging. Brain. Moscow: Izdatel’stvo Panfilova; 2018. (In Russ).
- Cohen–Inbar O. Nervous System Hemangiopericytoma. Canadian Journal of Neurological Sciences. 2020;47(1):18–29. doi: 10.1017/cjn.2019.311
- Zakhari N, Torres C, Castillo M, et al. Uncommon Cranial Meningioma: Key Imaging Features on Conventional and Advanced Imaging. Clinical Neuroradiology. 2017;27(2):135–144. doi: 10.1007/s00062–017–0583–y
- Hale AT, Wang L, Strother MK, et al. Differentiating meningioma grade by imaging features on magnetic resonance imaging. Journal of Clinical Neuroscience. 2018;48:71–75. doi: 10.1016/j.jocn.2017.11.013
- Ugga L, Spadarella G, Pinto L, et al. Meningioma Radiomics: At the Nexus of Imaging, Pathology and Biomolecular Characterization. Cancers (Basel). 2022;14(11):2605. doi: 10.3390/cancers14112605
- Aerts HJ. The Potential of Radiomic-Based Phenotyping in Precision Medicine: A Review. JAMA Oncology. 2016;2(12):1636–1642. doi: 10.1001/jamaoncol.2016.2631
- Gillies RJ, Kinahan PE, Hricak H. Radiomics: Images Are More than Pictures, They Are Data. Radiology. 2016;278(2):563–577. doi: 10.1148/radiol.2015151169
- Liu Z, Wang S, Dong D, et al. The Applications of Radiomics in Precision Diagnosis and Treatment of Oncology: Opportunities and Challenges. Theranostics. 2019;9(5):1303–1322. doi: 10.7150/thno.30309
- Kapishnikov AV, Surovcev EN, Udalov YuD. Magnetic Resonance Imaging of Primary Extra-Axial Intracranial Tumors: Diagnostic Problems and Prospects of Radiomics. Medical Radiology and Radiation Safety. 2022;67(4):49–56. (In Russ). doi: 10.33266/1024–6177–2022–67–4–49–56
- Park YW, Oh J, You SC, et al. Radiomics and machine learning may accurately predict the grade and histological subtype in meningiomas using conventional and diffusion tensor imaging. European Radiology. 2019;29(8):4068–4076. doi: 10.1007/s00330–018–5830–3
- Laukamp KR, Shakirin G, Baeßler B, et al. Accuracy of Radiomics–Based Feature Analysis on Multiparametric Magnetic Resonance Images for Noninvasive Meningioma Grading. World Neurosurgery. 2019;132:e366–e390. doi: 10.1016/j.wneu.2019.08.148.
- Lu Y, Liu L, Luan S, et al. The diagnostic value of texture analysis in predicting WHO grades of meningiomas based on ADC maps: an attempt using decision tree and decision forest. European Radiology. 2019;29(3):1318–1328. doi: 10.1007/s00330–018–5632–7
- Chen C, Guo X, Wang J, et al. The Diagnostic Value of Radiomics–Based Machine Learning in Predicting the Grade of Meningiomas Using Conventional Magnetic Resonance Imaging: A Preliminary Study. Frontiers in Oncology. 2019;9:1338. doi: 10.3389/fonc.2019.01338
- Zhu Y, Man C, Gong L, et al. A deep learning radiomics model for preoperative grading in meningioma. European Journal of Radiology. 2019;116:128–134. doi: 10.1016/j.ejrad.2019.04.022
- Morin O, Chen WC, Nassiri F, et al, Vasudevan HN, et al. Integrated models incorporating radiologic and radiomic features predict meningioma grade, local failure, and overall survival. Neuro–Oncology Advances. 2019;1(1):z11. doi: 10.1093/noajnl/vdz011
- Li X, Miao Y, Han L, et al. Meningioma grading using conventional MRI histogram analysis based on 3D tumor measurement. European Journal of Radiology. 2019;110:45–53. doi: 10.1016/j.ejrad.2018.11.016
- Ke C, Chen H, Lv X, et al. Differentiation Between Benign and Nonbenign Meningiomas by Using Texture Analysis From Multiparametric MRI. Journal of Magnetic Resonance Imaging. 2020;51(6):1810–1820. doi: 10.1002/jmri.26976
- Hu J, Zhao Y, Li M, et al. Machine learning–based radiomics analysis in predicting the meningioma grade using multiparametric MRI. European Journal of Radiology. 2020;131. doi: 10.1016/j.ejrad.2020.109251
- Chu H, Lin X, He J, et al. Value of MRI Radiomics Based on Enhanced T1WI Images in Prediction of Meningiomas Grade. Academic Radiology. 2021;28(5):687–693. doi: 10.1016/j.acra.2020.03.034
- Han Y, Wang T, Wu P, et al. Meningiomas: Preoperative predictive histopathological grading based on radiomics of MRI. Magnetic Resonance Imaging. 2021;77:36–43. doi: 10.1016/j.mri.2020.11.009
- Zhang J, Zhang G, Cao Y, et al. A Magnetic Resonance Imaging–Based Radiomic Model for the Noninvasive Preoperative Differentiation Between Transitional and Atypical Meningiomas. Frontiers in Oncology. 2022;12:811767. doi: 10.3389/fonc.2022.811767
- Li X, Lu Y, Xiong J, et al. Presurgical differentiation between malignant haemangiopericytoma and angiomatous meningioma by a radiomics approach based on texture analysis. Journal of Neuroradiology. 2019;46(5):281–287. doi: 10.1016/j.neurad.2019.05.013
- Dong J, Yu M, Miao Y, et al. Differential Diagnosis of Solitary Fibrous Tumor/Hemangiopericytoma and Angiomatous Meningioma Using Three–Dimensional Magnetic Resonance Imaging Texture Feature Model. BioMed Research International. 2020;2020. doi: 10.1155/2020/5042356
- Fan Y, Liu P, Li Y, et al. Non–Invasive Preoperative Imaging Differential Diagnosis of Intracranial Hemangiopericytoma and Angiomatous Meningioma: A Novel Developed and Validated Multiparametric MRI–Based Clini–Radiomic Model. Frontiers in Oncology. 2022;11:792521. doi: 10.3389/fonc.2021.792521
- Wei J, Li L, Han Y, et al. Accurate Preoperative Distinction of Intracranial Hemangiopericytoma From Meningioma Using a Multihabitat and Multisequence–Based Radiomics Diagnostic Technique. Frontiers in Oncology. 2020;10:534. doi: 10.3389/fonc.2020.00534
- Tian Z, Chen C, Zhang Y, et al. Radiomic Analysis of Craniopharyngioma and Meningioma in the Sellar/Parasellar Area with MR Images Features and Texture Features: A Feasible Study. Contrast Media & Molecular Imaging. 2020;2020. doi: 10.1155/2020/4837156
- Wang C, You L, Zhang X, et al. A radiomics–based study for differentiating parasellar cavernous hemangiomas from meningiomas. Scientific Reports. 2022;12. doi: 10.1038/s41598–022–19770–9
- Surovcev EN, Kapishnikov AV, Kolsanov AV. Comparative evaluation of the possibilities of radiomic analysis of magnetic resonance imaging in the differential diagnostics of primary extra-axial intracranial tumors. Research and Practical Medicine Journal. 2023;10(2):50–61. (In Russ). doi: 10.17709/2410-1893-2023-10-2-5
- Parmar C, Rios Velazquez E, Leijenaar R, et al. Robust Radiomics feature quantification using semiautomatic volumetric segmentation. PLoS One. 2014;9(7):e102107. doi: 10.1371/journal.pone.0102107
Arquivos suplementares


