

")


Влияние индекса массы тела на надёжность шкалы КТ 0–4: сравнение протоколов компьютерной томографии
- Авторы: Блохин И.А.1, Гончар А.П.1, Коденко М.Р.1,2, Соловьев А.В.1, Гомболевский В.А.3, Решетников Р.В.1,4
-
Учреждения:
- Научно-практический клинический центр диагностики и телемедицинских технологий
- Московский государственный технический университет имени Н.Э. Баумана (национальный исследовательский университет)
- Институт искусственного интеллекта (AIRI)
- Первый Московский государственный медицинский университет имени И.М. Сеченова (Сеченовский Университет)
- Выпуск: Том 3, № 2 (2022)
- Страницы: 108-118
- Раздел: Оригинальные исследования
- Статья получена: 02.03.2022
- Статья одобрена: 26.05.2022
- Статья опубликована: 14.07.2022
- URL: https://jdigitaldiagnostics.com/DD/article/view/104358
- DOI: https://doi.org/10.17816/DD104358
- ID: 104358

Цитировать

Аннотация
Обоснование. Из-за повышения частоты использования компьютерной томографии органов грудной клетки в борьбе с COVID-19 возникла необходимость применения низкодозной компьютерной томографии для снижения дозовой нагрузки на организм пациента при сохранении диагностической ценности исследования. При этом данных о влиянии индекса массы тела пациента на точность низкодозной компьютерно-томографической диагностики у пациентов с COVID-19 в опубликованной литературе не обнаружено.
Цель ― оценить влияние индекса массы тела пациента на уровень согласия между врачами-рентгенологами при интерпретации стандартной и низкодозной компьютерной томографии органов грудной клетки при COVID-19-ассоциированной пневмонии по визуальной полуколичественной шкале КТ 0–4.
Материалы и методы. Ретроспективное многоцентровое исследование, в котором каждому из участников в рамках одного визита было последовательно выполнено два исследования органов грудной клетки по стандартному и низкодозному протоколу. Интерпретация стандартной и низкодозной компьютерной томографии органов грудной клетки с лёгочным и мягкотканным кернелами проводилась по визуальной полуколичественной шкале КТ 0–4. Данные для каждого протокола были сгруппированы по значению индекса массы тела (пороговое значение для патологии было принято равным 25 кг/м2). Согласие рассчитывали на основе бинарной и взвешенной классификаций. Оценку наличия статистически значимых различий средних для полученных групп проводили методом однофакторного дисперсионного анализа ANOVA.
Результаты. Из общего количества пациентов (n=231) 230 соответствовали установленным критериям включения в исследование. Эксперты обработали по 4 исследования стандартной и низкодозной компьютерной томографии с лёгочным и мягкотканным кернелами для каждого пациента. Доля пациентов с нормальным весом составила 31% (71 человек), медиана индекса массы тела для выборки равна 27,5 (18,3; 48,3) кг/м2. Статистически значимых различий при межгрупповом попарном сравнении не выявлено ни для бинарной, ни для взвешенной классификации (p-value 0,09 и 0,12 соответственно). Группа пациентов с избыточным весом была дополнительно разделена по степеням ожирения, однако результаты исследования оказались инвариантны к такому делению (статистически значимых различий нет: для максимально различных по индексу массы тела групп «норма» и «ожирение 3-й степени» p-value 0,17).
Заключение. Индекс массы тела пациента не влияет на интерпретацию стандартной и низкодозной компьютерной томографии органов грудной клетки при COVID-19 по визуальной полуколичественной шкале КТ 0–4.
Полный текст
ОБОСНОВАНИЕ
Компьютерная томография органов грудной клетки (КТ ОГК) занимает особое место в диагностике COVID-19 [1]. В настоящее время для оценки степени тяжести пациентов с COVID-19-ассоциированной пневмонией и прогноза течения заболевания используется визуальная полуколичественная шкала поражения лёгочной ткани КТ 0–4 [2]. Из-за повышения частоты использования КТ ОГК в борьбе с COVID-19 возникла необходимость применения низкодозной компьютерной томографии (НДКТ) для уменьшенной дозовой нагрузки на организм пациента при сохранении диагностической ценности исследования [3]. При этом доказано, что НДКТ не ассоциирована с повреждениями ДНК, в отличие от стандартной КТ, после которой увеличивалось количество двуцепочечных разрывов ДНК и хромосомных аберраций [4].
Известно, что одним из факторов неблагоприятного течения коронавирусной инфекции является высокий индекс массы тела (ИМТ) [5]. В то же время отмечено ограничение применимости НДКТ ОГК у пациентов с ИМТ >35 кг/м2 [6]. Ранее A. Manowitz и соавт. [7] установили, что для пациентов с высоким ИМТ при КТ органов брюшной полости лучевую нагрузку можно уменьшить без снижения качества изображений. В исследовании N.S. Paul и соавт. [8] по оценке влияния ожирения на эффективность КТ-коронарографии была отмечена сильная корреляция между ИМТ и шумом изображения как у мужчин (r=0,66), так и у женщин (r=0,85) с повышенной массой тела. В результате авторы сделали вывод, что при снижении дозы облучения следует учитывать индекс массы пациента. При этом данных о влиянии ИМТ на точность НДКТ-диагностики у пациентов с COVID-19 в опубликованной литературе на момент написания текста не обнаружено.
Цель исследования ― оценить влияние ИМТ пациента на достоверность выявляемых изменений и правильность их интерпретации при стандартной и низкодозной КТ ОГК при COVID-19-ассоциированной пневмонии по визуальной полуколичественной шкале КТ 0–4 разными врачами-рентгенологами.
Нулевая гипотеза
Индекс массы тела не влияет на согласие между экспертами при оценке степени тяжести COVID-19-ассоциированной пневмонии по шкале КТ 0–4 при стандартной и низкодозной КТ ОГК.
МАТЕРИАЛЫ И МЕТОДЫ
Дизайн исследования
Ретроспективное исследование выполнено на материалах ранее проведённого проспективного многоцентрового исследования «LDCT in COVID-19 Pneumonia: a Prospective Moscow Study», зарегистрированного в международной базе данных ClinicalTrials.gov, NCT04379531 25-04-2020 [9].
Критерии соответствия
Критерии включения: пациенты двух государственных амбулаторных медицинских учреждений г. Москвы в возрасте ≥18 лет с подозрением на COVID-19-ассоциированную пневмонию и симптомами острой респираторной вирусной инфекции.
Критерии исключения: пациенты с неполными данными (рост, вес, ИМТ); беременные и кормящие женщины; пациенты с инородными телами в области сканирования.
Условия проведения
Каждому участнику исследования в рамках одного визита было последовательно выполнено два исследования ОГК по стандартному и низкодозному протоколу. Анализ КТ-исследований проводили 10 врачей-рентгенологов с опытом работы от 3 до ≥25 лет, прошедших обучение интерпретации COVID-19-ассоциированной пневмонии. Для предоставления онлайн-доступа к анонимизированным данным с последующей оценкой степени тяжести заболевания по шкале КТ 0–4 использовали модифицированное программное обеспечение FAnTom [9, 10]. Распределение КТ и НДКТ-исследований, реконструированных в лёгочном и мягкотканном кернелах, проводили среди рентгенологов случайным образом с условием, чтобы каждое исследование независимо и заслеплённо интерпретировали два специалиста.
Продолжительность исследования
Данные исследований КТ и НДКТ ОГК были собраны в период с 6 мая 2020 г. по 22 мая 2020 г.
Описание медицинского вмешательства
Исследования КТ ОГК проводилось на 64-срезовом компьютерном томографе (Aquilion 64, Canon, Япония) без алгоритмов итеративной реконструкции. Был использован стандартный протокол КТ ОГК, предоставленный производителем, и ранее разработанный низкодозный протокол для COVID-19.
Для КТ ОГК ток автоматически регулируется по всей длине сканирования в пределах 40–500 мА при условии, что уровень шума при срезах 5,0 мм составляет 10 (стандартное отклонение).
Для НДКТ ОГК ток автоматически регулируется по всей длине сканирования в пределах 10–500 мА при условии, что уровень шума при срезах 5,0 мм составляет 36 (стандартное отклонение).
Дополнительные параметры КТ (одинаковые для КТ и НДКТ): напряжение ― 120 кВ; время вращения ― 0,5 с; направление ― наружу (от ног к голове); модуляция XY ― включена; коллимация ― 64×0,5 мм; шаг спирали ― 53,0; сканирование проводится на пиковой глубине вдоха; время сканирования ― в среднем 6 с (зависит от индивидуальных конституциональных особенностей). Исследования проводились без контрастного усиления.
Параметры реконструкций изображений были одинаковыми для стандартной КТ и НДКТ: матрица — 512×512; D-FOV ― 350 мм; длина сканирования ― 300 мм; ядро (кернел) реконструкции ― FC51 (лёгочный кернел) и FC07 (мягкотканный кернел); толщина среза ― 1,0 мм; инкремент ― 1,0 мм.
Основной исход исследования
Настоящее исследование посвящено изучению влияния ИМТ пациента с COVID-19-ассоциированной пневмонией на качество интерпретации исследований КТ ОГК с использованием низкодозного протокола. В качестве метода сравнения использовали протокол КТ со стандартной дозой облучения; интерпретацию проводили по визуальной полуколичественной шкале КТ 0–4.
Этическая экспертиза
Работа основана на результатах исследования, для которого было получено согласование № 03/2020 в независимом этическом комитете Московского регионального отделения Российского общества рентгенологов и радиологов (МРО РОРР). Все пациенты подписали информированное добровольное согласие.
Статистический анализ
Согласие между экспертами по каждому пациенту оценивали по формулам (1) и (2) для следующих протоколов:
- стандартная КТ с лёгочным кернелом (фильтром реконструкции) FC51 (Sharp CT);
- стандартная КТ с мягкотканным кернелом (фильтром реконструкции) FC07 (Soft CT);
- низкодозная КТ с лёгочным кернелом (фильтром реконструкции) FC51 (Sharp LDCT);
- низкодозная КТ с мягкотканным кернелом (фильтром реконструкции) FC07 (Soft LDCT).
Данные для каждого протокола были разбиты на две группы по значению ИМТ: норма (ИМТ <25 кг/м2) и избыточная масса тела (ИМТ ≥25 кг/м2) [11]. Оценка согласия между экспертами для подгруппы представлена в виде среднего значения и стандартного отклонения.
Обработка данных проводилась средствами R, версия 4.0.4, пакеты dplyr, ggplot2, irr [12].
Согласие рассчитывалось в процентах на основе абсолютной величины разности оценки двух экспертов:
|Δ| = |эксперт1 - эксперт2|. (1)
Использовали два варианта трактовки разногласий.
- Бинарная классификация, не чувствительная к величине разности экспертных оценок (Δ). При отсутствии разницы между оценками экспертов (|Δ|=0) согласие составляет 100%, при любом различии между оценками (|Δ|≠0) согласие берётся равным 0%.
- Взвешенная классификация учитывает величину разности экспертных оценок (Δ):
(2)
где Δ ― разница между оценками экспертов для текущего исследования согласно формуле (1), Δmax ― максимально возможная разница оценок (Δmax=4, четыре категории КТ 0–4). Применительно к данному исследованию взвешенная оценка согласия дискретна и находится в диапазоне от 0 до 100% с шагом 25%: согласие 0% соответствует расхождению на четыре категории, 25% ― на три, 50% ― на две, 75% ― на одну, 100% ― полное согласие.
Оценку наличия статистически значимых различий средних для полученных групп проводили методом одностороннего дисперсионного анализа (One-way ANOVA) [13]. На первом этапе проводили статистический анализ равенства дисперсий исследуемых групп с помощью критерия Левена [14]. Далее проводили дисперсионный анализ равенства средних с учётом информации о равенстве дисперсий. В качестве зависимой переменной рассматривали согласие между рентгенологами, независимыми переменными были индекс массы тела (бинарная классификация, нормальная и избыточная масса тела) и протокол исследования (Sharp CT, Soft CT, Sharp LDCT, Soft LDCT). Для определения численных значений р для различий между индивидуальными подгруппами проводили ретроспективный анализ с HSD-критерием Тьюки [15]. Для всех сравнений использовали уровень статистической значимости 0,05.
РЕЗУЛЬТАТЫ
Общее число пациентов, отобранных для исследования, ― 231, из них 230 включены в исследование (для одного пациента отсутствовали данные по ИМТ). В отобранной когорте 55,6% женщин. Средний возраст пациента составил 47±15 лет. Для каждого пациента получали данные КТ- и НДКТ-исследований, которые затем реконструировали с использованием лёгочного и мягкотканного кернелов.
Основные параметры описательной статистки для выборки в целом: размах (18,3; 48,3) кг/м2; медиана 27,5 кг/ м2, среднее 27,9±5,6 кг/м2; распределение не соответствует нормальному (p-value ≤0,01), коэффициент асимметрии равен 0,9 (существенная правосторонняя асимметрия).
Категоризация пациентов по ИМТ: пациенты без избыточного веса (ИМТ <25 кг/м2) ― 31% (71 человек); пациенты с избыточным весом (ИМТ ≥25 кг/м2) ― 69% (159 человек).
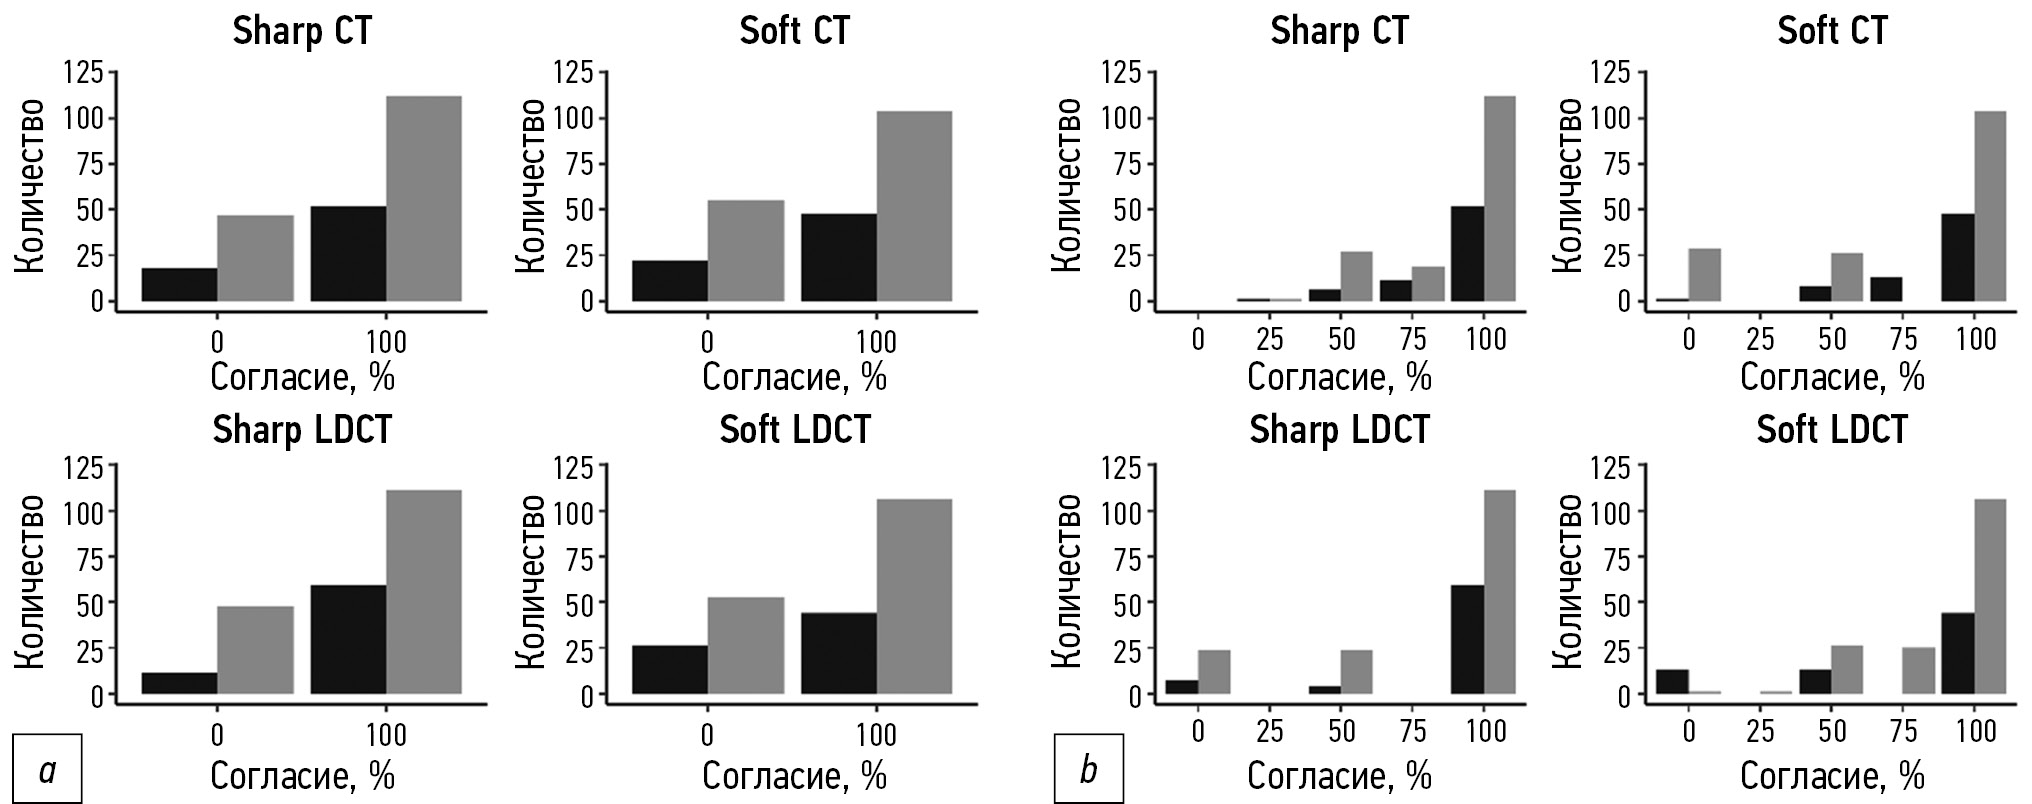
Наивысший показатель согласия для пациентов с нормальным ИМТ наблюдали при использовании протокола Sharp LDCT: 83,5% и 92,8% по бинарной и взвешенной классификации соответственно (рис. 1; таблица). Протокол Soft LDCT характеризовался наименьшим согласием для пациентов с нормальным ИМТ: 64,9% по бинарной и 86,9% по взвешенной классификации.
Для пациентов с избыточной массой тела протоколом с наивысшим согласием между экспертами был Sharp CT (71,2% и 88,4% по бинарной и взвешенной классификации соответственно). Наименьшее согласие для таких пациентов наблюдали при использовании протокола Soft CT: 64,4% по бинарной классификации и 86,4% ― по взвешенной (см. рис. 1 и таблицу).

Рис. 1. Диаграмма согласия экспертов при бинарной (а) и взвешенной (b) классификации для групп по индексу массы тела (серый цвет ― группа избыточного веса, чёрный ― группа нормального веса).
Таблица. Численные значения согласия (%) между экспертами для бинарной (светло-серый) и взвешенной (тёмно-серый) классификации
Value | Sharp CT | Soft CT | Sharp LDCT | Soft LDCT | ||||
Normal | Overweight | Normal | Overweight | Normal | Overweight | Normal | Overweight | |
Mean | 72,2 | 71,2 | 69,1 | 64,4 | 83,5 | 67,4 | 64,9 | 65,9 |
SD | 45,1 | 45,4 | 46,5 | 48,1 | 37,3 | 47,0 | 48,0 | 47,6 |
Mean | 89,4 | 88,4 | 88,4 | 86,4 | 92,8 | 88,3 | 86,9 | 86,4 |
SD | 18,7 | 19,6 | 19,8 | 19,9 | 16,9 | 18,4 | 19,5 | 21,3 |
Наибольшую разницу в гомогенности интерпретаций между группами с нормальной и избыточной массой тела наблюдали при использовании протокола Sharp LDCT (разница средних 16,1% и 4,5% по бинарной и взвешенной классификации соответственно). Наименее гетерогенной интерпретация была при использовании протоколов Sharp CT и Soft LDCT, для которых разница средних не превышала 1% по любой из классификаций (см. рис. 1 и таблицу).
Дисперсионный анализ
Для анализа различий между интерпретациями рентгенологов в зависимости от ИМТ пациента, протокола сканирования и реконструкции мы проводили однофакторный дисперсионный анализ ANOVA. Результаты анализа продемонстрировали отсутствие статистически значимых различий между средними значениями согласия для групп нормы и избыточной массы тела во всех четырёх протоколах как для бинарной классификации (p=0,13 для протокола и p=0,18 для ИМТ), так и для взвешенной (p=0,18 и p=0,14 соответственно).
Помимо сопоставления средних значений согласия, мы проводили также сравнение вариабельности оценок экспертов в зависимости от ИМТ пациента и от метода визуализации. Согласно критерию Левена, различия в бинарной и взвешенной классификациях позволяют принять гипотезу о равенстве дисперсий исследуемых групп.
Разницу между индивидуальными подгруппами изучали с помощью ретроспективного анализа с HSD-критерием Тьюки (рис. 2). Для всех пар сравнения 95% доверительные интервалы включали в себя значение «0» как для бинарной (рис. 2, а), так и для взвешенной (рис. 2, b) классификации, что свидетельствует об отсутствии статистически значимой разницы в интерпретациях рентгенологов для разных групп по индексу массы тела и методу визуализации.

Рис. 2. Постапостериорный анализ гипотезы о сходстве средних: а ― бинарная классификация; b ― нормированная классификация (Протоколы Sharp CT, Soft CT, Sharp LDCT и Soft LDCT закодированы буквами A, B, C и D соответственно, группа нормы закодирована цифрой «1», группа избыточного веса ― цифрой «2»).
Для бинарной классификации минимальное значение p составило 0,22 при сопоставлении групп Sharp LCDT для нормальной массы тела и Soft CT для избыточной массы тела, а минимальное значение p в рамках одного протокола ― 0,65 (Sharp LDCT). Для взвешенной классификации минимальное значение p составило 0,08, минимальное значение p в рамках одного протокола ― 0,36 для аналогичных групп.
Дополнительно проведённый ROC-анализ (receiver operating characteristic) исследуемых групп позволил определить оптимальный порог ИМТ для предсказания уровня согласия, равный 26,24 кг/м2. Для данного порога был повторно проведён дисперсионный анализ, который подтвердил отсутствие статистически значимых различий для дисперсий (p-value для бинарной классификации 0,13 и 0,09; для взвешенной классификации 0,18 и 0,12 по протоколу и ИМТ соответственно) и средних (значения p аналогичны) исследуемых групп в рамках каждого протокола. Для обоих видов классификации минимальное значение p было получено для сравнения групп нормального и избыточного веса в рамках протокола Sharp LDCT и составило 0,65 для бинарной и 0,15 для взвешенной классификации.
По причине смещённости исходной выборки в область «избыточного веса» (ИМТ в диапазоне [25; 30] кг/м2) был проведён дополнительный анализ с выделением групп «избыточный вес», «ожирение 1-й степени», «ожирение 2-й степени», «ожирение 3-й степени». Результаты анализа по всем протоколам показали отсутствие статистически значимых различий для обоих типов классификации (p-value было минимально для групп «норма» и «ожирение 1-й степени» и составило 0,09 и 0,08 для бинарной и взвешенной классификаций соответственно). Для максимально отличных по ИМТ групп «норма» и «ожирение 3-й степени» p-value составило 0,17.
Дополнительно выполнен анализ серий исследований, для которых расхождение в оценках экспертов по визуальной полуколичественной шкале КТ 0–4 превысило одну категорию. Всего выявлено 26 таких серий. После пересмотра каждого случая представляется возможным разделить расхождения на две группы.
В первую группу входят 15 серий (58%), для которых оба эксперта подтвердили наличие COVID-19-ассоциированных изменений (оценка КТ1 и выше), но разошлись относительно объёма поражения лёгочной ткани. Это может быть связано с предпочитаемой плос-костью анализа изображений (аксиальная/фронтальная/сагиттальная) и направлением просмотра исследования (от верхушек лёгких к диафрагме или от диафрагмы к верхушкам лёгких), а также наличием в исследовании проявлений различных темпоральных стадий вирусной пневмонии, например, одновременно «матового стекла» и «булыжной мостовой». Поскольку коронавирусная пневмония более выражена в базальных отделах лёгких, просмотр аксиальных срезов от диафрагмы к верхушкам лёгких может исказить восприятие степени тяжести изменений экспертом в сторону повышения оценки по системе КТ 0–4. Использование сагиттальных мультипларных или трёхмерных реконструкций позволяет «охватить» изменения одним взглядом, уменьшая риск завышения оценки степени поражения. Расхождения между экспертами в первой группе подчёркивают значительный уровень субъективности визуальной оценки степени тяжести заболевания и необходимость изучения возможностей систем автоматического денситометрического анализа лёгочной паренхимы.
Во вторую группу входят 11 серий (42%), для которых один из экспертов не подтвердил наличия COVID-19-ассоциированных изменений (оценка КТ0). Это было связано с ложноположительными случаями (гипостатические изменения базальных отделов лёгких на фоне высокой априорной вероятности инфекции), отсутствием в классификации КТ 0–4 способа выражения вероятности коронавирусной природы изменений. Расхождения между экспертами во второй группе подчёркивают ценность совместного применения классификаций CO-RADS и КТ 0–4.
ОБСУЖДЕНИЕ
В данном исследовании было изучено согласие врачей-рентгенологов в оценке КТ и НДКТ ОГК по шкале КТ 0–4 в зависимости от массы тела пациента и кернела реконструкции при COVID-19-ассоциированной пневмонии. Сравнительный анализ показал отсутствие статистически значимых различий. По причине необходимости балансировки размеров сопоставляемых выборок (по группам с различным ИМТ) пациенты были разделены на два класса: «норма» и «избыточный вес» по ИМТ, что могло повлиять на корректность интерпретации полученных результатов. Однако дополнительный анализ данных продемонстрировал инвариантность качественного результата («статистически значимых различий не обнаружено») к категории ожирения. С учётом ограничений исследования можно сделать вывод об отсутствии существенного влияния ИМТ пациента на согласие врачей при оценке поражения лёгких по шкале КТ 0–4. Таким образом, выбор протокола сканирования не зависит от ИМТ пациента.
Результаты настоящей работы предоставляют дополнительные обоснования в выборе минимально возможной дозы лучевой нагрузки для лиц с COVID-19, что обусловлено отсутствием влияния повышенного индекса массы тела на диагностическое качество изображений при использовании шкалы КТ 0-4. В свою очередь, выбор кернела может опираться исключительно на личные предпочтения рентгенолога.
В 2016 г. T. Kubo и соавт. [16] проводили сравнение диагностических возможностей НДКТ (50 мАс) и КТ (150 мАс) при рутинном исследовании ОГК. Три врача-рентгенолога независимо друг от друга проанализировали 118 серий изображений с толщиной среза 2 мм (по две серии для каждого пациента из выборки) с последующей оценкой следующих патологических находок: эмфизема, «матовые стёкла», ретикулярные изменения, микроузелки, бронхоэктазы, «сотовое лёгкое», узелки (>5 мм), аневризма аорты, кальцификация коронарных артерий, перикардиальный и плевральный выпот, утолщение плевры, образования средостения и увеличение лимфатических узлов. Авторы сделали вывод, что протокол НДКТ может быть использован в рутинной практике врача-рентгенолога, что согласуется с полученными нами данными.
Известно, что изображения КТ-исследований, выполненных по низкодозному протоколу, имеют более низкое качество (меньшее отношение сигнал–шум) в сравнении с исследованием, выполненным по стандартному протоколу [17]. Таким образом, возникает необходимость использования дополнительных методов повышения качества изображений, особенно у пациентов с повышенной массой тела. Одним из таких методов является использование итеративных реконструкций [18].
В исследовании D.A. Filatova и соавт. [19] проводилось сравнение КТ и НДКТ ОГК при COVID-19 с использованием итеративных реконструкций. Объём выборки ― 151 пациент. Выявлено отсутствие значимых потерь диагностической информации при НДКТ ОГК в сравнении со стандартным протоколом КТ. Таким образом, НДКТ ОГК можно использовать в рутинной практике для диагностики COVID-19 [19], что подтверждает полученные нами результаты. Однако в приведённом выше исследовании, в отличие от настоящего, оценку влияния ИМТ на качество анализа изображений не проводили.
Отдельно стоит отметить, что визуализация с использованием эффективных доз облучения <0,3 мЗв и итеративных реконструкций имеет ограничения для пациентов с интерстициальной пневмонией/эмфиземой лёгких и ИМТ >25 кг/м2 [20].
Ограничения исследования
Данная работа имеет ряд ограничений. В исследовании использовали только одну модель компьютерного томографа: рекомендованные протоколы для других моделей и производителей могут отличаться от использованных нами. Для интерпретации исследований использовали только субъективную оценку рентгенологов по шкале КТ 0–4. Выводы настоящей работы основаны на анализе выборки, без группировки по степеням ожирения. Однако, как было показано, качественный исход оказался инвариантен к данному параметру.
ЗАКЛЮЧЕНИЕ
Таким образом, с учётом вышеупомянутых ограничений исследования можно сделать вывод об отсутствии значимых влияний ИМТ на интерпретацию КТ и НДКТ ОГК при COVID-19 по визуальной полуколичественной шкале КТ 0–4.
ДОПОЛНИТЕЛЬНО
Источник финансирования. Авторы заявляют об отсутствии внешнего финансирования при проведении исследования.
Конфликт интересов. Авторы декларируют отсутствие явных и потенциальных конфликтов интересов, связанных с публикацией настоящей статьи.
Вклад авторов. Все авторы подтверждают соответствие своего авторства международным критериям ICMJE (все авторы внесли существенный вклад в разработку концепции, проведение исследования и подготовку статьи, прочли и одобрили финальную версию перед публикацией). Наибольший вклад распределён следующим образом: И.А. Блохин ― концепция и дизайн исследования, анализ полученных данных, написание текста статьи; А.П. Гончар ― написание текста статьи; М.Р. Коденко ― сбор и обработка материалов, анализ полученных данных, написание текста статьи; А.В. Соловьев, А.В. Гомболевский ― написание текста статьи; Р.В. Решетников ― концепция и дизайн исследования, написание текста статьи.
ADDITIONAL INFORMATION
Funding source. This study was not supported by any external sources of funding.
Competing interests. The authors declare that they have no competing interests.
Authors’ contribution. All authors confirm that they meet the international ICMJE criteria for authorship (all authors made substantial contributions to the concept development, conducting the research and preparation of the article, and read and approved the final version before publication). The largest contributions were as follows: I.A. Blokhin — concept and study design, data analysis, manuscript preparation; A.P. Gonchar — manuscript preparation; M.R. Kodenko — data collection and processing, data analysis, manuscript preparation; A.V. Solovev, A.V. Gombolevskiy — manuscript preparation; R.V. Reshetnikov — research concept and design, manuscript preparation.
Об авторах
Иван Андреевич Блохин
Научно-практический клинический центр диагностики и телемедицинских технологий
Email: i.blokhin@npcmr.ru
ORCID iD: 0000-0002-2681-9378
SPIN-код: 3306-1387
Россия, Москва
Анна Павловна Гончар
Научно-практический клинический центр диагностики и телемедицинских технологий
Email: a.gonchar@npcmr.ru
ORCID iD: 0000-0001-5161-6540
SPIN-код: 3513-9531
Россия, Москва
Мария Романовна Коденко
Научно-практический клинический центр диагностики и телемедицинских технологий; Московский государственный технический университет имени Н.Э. Баумана (национальный исследовательский университет)
Автор, ответственный за переписку.
Email: m.kodenko@npcmr.ru
ORCID iD: 0000-0002-0166-3768
SPIN-код: 5789-0319
Россия, Москва; Москва
Александр Владимирович Соловьев
Научно-практический клинический центр диагностики и телемедицинских технологий
Email: a.solovev@npcmr.ru
ORCID iD: 0000-0003-4485-2638
SPIN-код: 9654-4005
Россия, Москва
Виктор Александрович Гомболевский
Институт искусственного интеллекта (AIRI)
Email: g_victor@mail.ru
ORCID iD: 0000-0003-1816-1315
SPIN-код: 6810-3279
к.м.н.
Россия, МоскваРоман Владимирович Решетников
Научно-практический клинический центр диагностики и телемедицинских технологий; Первый Московский государственный медицинский университет имени И.М. Сеченова (Сеченовский Университет)
Email: reshetnikov@fbb.msu.ru
ORCID iD: 0000-0002-9661-0254
SPIN-код: 8592-0558
к.ф.-м.н.
Россия, Москва; МоскваСписок литературы
- Islam N., Ebrahimzadeh S., Salameh J.P., et al. Thoracic imaging tests for the diagnosis of COVID-19 // Cochrane Database Syst Rev. 2020. Vol. 3, N 3. P. CD013639. doi: 10.1002/14651858.CD013639.pub4
- Morozov S.P., Chernina V.Y., Blokhin I.A., Gombolevskiy V. Chest computed tomography for outcome prediction in laboratory-confirmed COVID-19: a retrospective analysis of 38,051 cases // Digital Diagnostics. 2020. Vol. 1, N 1. P. 27–36. doi: 10.17816/DD46791
- Prasad K.N., Cole W.C., Haase G.M. Radiation protection in humans: extending the concept of as low as reasonably achievable (ALARA) from dose to biological damage // Br J Radiol. 2004. Vol. 77, N 914. P. 97–99. doi: 10.1259/bjr/88081058
- Sakane H., Ishida M., Shi L., et al. Biological effects of low-dose chest CT on chromosomal DNA // Radiol. 2020. Vol. 295, N 2. P. 439–445. doi: 10.1148/radiol.2020190389
- Du Y., Lv Y., Zha W., et al. Association of body mass index (BMI) with critical COVID-19 and in-hospital mortality: a dose-response meta-analysis // Metabolism. 2021. Vol. 117. P. 154373. doi: 10.1016/j.metabol.2020.154373
- Ohana M., Ludes C., Schaal M., et al. Quel avenir pour la radiographie thoracique face au scanner ultra-low dose? // Revue Pneumologie Clinique. 2017. Vol. 73, N 1. P. 3–12. doi: 10.1016/j.pneumo.2016.09.007
- Manowitz A., Sedlar M., Griffon M., et al. Use of BMI guidelines and individual dose tracking to minimize radiation exposure from low-dose helical chest CT scanning in a lung cancer screening program // Academ Radiol. 2012. Vol. 19, N 1. P. 84–88. doi: 10.1016/j.acra.2011.09.015
- Paul N.S., Kashani H., Odedra D., et al. The influence of chest wall tissue composition in determining image noise during cardiac CT // Am J Roentgenol. 2011. Vol. 197, N 6. P. 1328–1334.
- Blokhin I., Gombolevskiy V., Chernina V., et al. Inter-observer agreement between low-dose and standard-dose CT with soft and sharp convolution kernels in COVID-19 pneumonia // J Clin Med. 2022. Vol. 11, N 3. P. 669. doi: 10.3390/jcm11030669
- Morozov S.P., Gombolevskiy V.A., Elizarov A.B., et al. A simplified cluster model and a tool adapted for collaborative labeling of lung cancer CT scans // Computer Methods Programs Biomed. 2021. Vol. 206. P. 106111. doi: 10.1016/j.cmpb.2021.106111
- Powell-Wiley T.M., Poirier P., Burke L.E., et al. Obesity and cardiovascular disease: a scientific statement from the American Heart Association // Circulation. 2021. Vol. 143, N 21. P. e984–e1010. doi: 10.1161/CIR.0000000000000973
- The R Foundation. The R Project for Statistical Computing [интернет]. Режим доступа: . Дата обращения: 15.03.2022.
- Fisher R.A. XXI. ― On the dominance ratio // Proceedings Royal Soc Edinburgh. 1923. Vol. 42. P. 321–341. doi: 10.1017/S0370164600023993
- Levene H. Robust tests for equality of variances // Olkin I., Ghurye S., Hoeffding W., et al. Contributions to probability and statistics: essays in honor of harold hotelling. Standford University Press, 1961. P. 279–292.
- Mosteller F. Data analysis and regression: a second course in statistics. Addison-Wesley Pub. Co., Boston, 1977. 588 p.
- Kubo T., Ohno Y., Nishino M., et al.; iLEAD Study Group. Low dose chest CT protocol (50 mAs) as a routine protocol for comprehensive assessment of intrathoracic abnormality // Eur J Radiol Open. 2016. Vol. 3. P. 86–94. doi: 10.1016/j.ejro.2016.04.001
- Silin А.Y., Gruzdev I.S., Morozov S.P. The influence of model iterative reconstruction on the image quality in standard and low-dose computer tomography of the chest. Experimental study // J Clin Pract. 2020. Vol. 11, N 4. P. 49–54. doi: 10.17816/clinpract34900
- Zhu Z., Ming Z.X., Feng Z.Y., et al. Feasibility study of using gemstone spectral imaging (GSI) and adaptive statistical iterative reconstruction (ASIR) for reducing radiation and iodine contrast dose in abdominal CT patients with high BMI values // PLoS One. 2015. Vol. 10, N 6. P. e0129201. doi: 10.1371/journal.pone.0129201
- Filatova D.A., Sinitsin V.E., Mershina E.A. Opportunities to reduce the radiation exposure during computed tomography to assess the changes in the lungs in patients with COVID-19: use of adaptive statistical iterative reconstruction // Digital Diagnostics. 2021. Vol. 2, N 2. P. 94–104.
- Lee S.W., Kim Y., Shim S.S., et al. Image quality assessment of ultra-low dose chest CT using sinogram-affirmed iterative reconstruction // Eur Radiol. 2014. Vol. 24, N 4. P. 817–826. doi: 10.1007/s00330-013-3090-9
Дополнительные файлы

