


Hypothesis testing using R
- Authors: Blokhin I.A.1, Kodenko M.R.1,2, Shumskaya Y.F.1,3, Gonchar A.P.1, Reshetnikov R.V.1
-
Affiliations:
- Moscow Center for Diagnostics and Telemedicine
- Bauman Moscow State Technical University
- The First Sechenov Moscow State Medical University
- Issue: Vol 4, No 2 (2023)
- Pages: 238-247
- Section: Editorials
- Submitted: 11.01.2023
- Accepted: 18.01.2023
- Published: 12.07.2023
- URL: https://jdigitaldiagnostics.com/DD/article/view/121368
- DOI: https://doi.org/10.17816/DD121368
- ID: 121368

Cite item

Abstract
Competencies in statistical data processing are becoming increasingly important for modern scientists. The apparent advantages of open-source software for statistical analysis are its accessibility and adaptability. The programming language and the corresponding software R, available as a minimalistic console interface or a complete development environment RStudio/Posit, have the widest possibilities among free solutions.
We present a practical guide for comparing two groups using the software R. This study compares the effective doses of standard computed tomography with low-dose computed tomography for COVID-19 patients. The practical guide summarizes theoretical approaches to medical data processing and recommendations for correctly formulating research tasks and selecting optimal statistical analysis methods.
The main goal of the practical guide is to introduce the reader to the Posit interface and the basic functionality of the R language by using a practical example of treating a real medical problem. The presented material can be useful as an introduction to statistical analysis using the programming language R.
Keywords
Full Text
INTRODUCTION
For modern researchers, statistical data processing has become an increasingly important competency. In 1983, understanding two-thirds of the 760 scientific papers in the esteemed New England Journal of Medicine only required basic knowledge of descriptive statistics (such as percentage, mean, and standard deviation) and one method of statistical hypothesis testing (Student’s t-test) [1]. However, over time, the scientific community has identified some limitations of this approach for data analysis. In 2014, the Journal of American Medical Association announced a special series describing the methods of statistical analysis for clinicians.1 Currently, open access review papers are available not only on the basic aspects of data analysis [2], but also on the choice of an appropriate data processing method [3]. Moreover, a detailed Statistical Analysis Method in the Biomedical Research checklist was published in 2019 [4]. However, the practical use of data analysis methods remains a sophisticated problem if programs for its automation are not actively developed.
Because there are many paid statistical analysis programs and commercial services for end-to-end data processing, open-source software has some obvious advantages, such as accessibility and versatility [5]. The most powerful free solution is the programming language and associated software R [6], which is available as a minimalist console interface [7] or as a full-fledged development environment RStudio/Posit [8].
The aim of this paper is to present some basic operations in R based on a real-life problem as follows: comparing the effective dose received by patients during standard computed tomography (CT) and low-dose computed tomography (LDCT) for COVID-19. The relevance of this task is based on the need to monitor radiation exposure [9], considering the increased number of imaging studies [10] resulting in the importance of developing [11] and clinical testing [12, 13] LDCT protocols.
Statistical analysis should include some fundamental steps.
Setting a task and generating a null hypothesis for the analysis
The null hypothesis is the starting point in the statistical analysis. When comparing two groups, the null hypothesis (H0) is generated as “no statistically significant differences.” In our case, the effective patient doses were compared when performing two types of CT scans (full and low dose) for COVID-19. Therefore, the H0 for this task would state that “radiation exposure levels for CT and LDCT are comparable.”
In addition, it is necessary to consider the “alternative hypothesis” (H1), which presents an antagonistic hypothesis for H0. These are meant to be mutually exclusive. In our case, the alternative hypothesis would state that “there is a statistically significant difference between effective radiation doses when using CT and LDCT in patients with COVID-19.”
In statistics, testing of the null hypothesis yields the p-value, which represents the probability of incorrectly rejecting H0. This parameter can be interpreted as follows: “If we repeat the experiment many times and reject the null hypothesis, we will make a mistake in the p-value cases of 100%.” For example, a p-value of 0.03 implies that we incorrectly reject H0 in favor of H1 in 3% of cases. A predetermined threshold helps to determine whether this value is high or low. According to Ronald Fischer, the threshold p-value is commonly set to 0.05 [14]. In our case, using a threshold value of 0.05, with a p-value of 0.03, we can confidently conclude that the compared samples are different.
Raw data analysis
The choice of the statistical analysis method for raw data processing depends on the type and distribution. Data can be quantitative and qualitative.2 Quantitative data characterize the magnitude of an event or the number of objects, e.g., the radiation exposure in millisieverts (mSv) during a chest CT. Qualitative or categorical data describe the association between the studied event and a particular group, e.g., patient gender or KT0-4 category.
In data analysis, it is essential to test not only the main null hypothesis, but also one more H0, which should be “data are normally distributed.” Normal distribution is one of the most important statistical phenomena, because it often characterizes naturally occurring parameters, including height, weight, shoe size, and many other population characteristics. The normal distribution is described by two parameters: the mean value and standard deviation. This assumption is the basis for statistical hypothesis testing methods.
There is no single solution for each distribution test case for normality. X. Romão et al. [15] compared 33 methods and suggested optimal solutions depending on the data type. The choice of method also depends on the size of the study sample [16]. The Kolmogorov−Smirnov and Shapiro−Wilk tests are the most important [17].
Null hypothesis testing for the study
For the correct choice of statistical analysis method, we should consider not only the data type in compared samples but also the number of compared groups and the presence of the association between them, e.g., whether CT and LDCT data were obtained from the same or different patients. More than 50 different statistical tests have already been developed, and there are special online resources for choosing the optimal method.3
In our case, samples were paired because CT and LDCT data were obtained sequentially from the same patients. It is recommended to use a paired Student’s t-test for normal distribution and a Wilcoxon test for non-normal distribution.
CASE STUDY
Statistical analysis was performed using R software package (version 4.2.2, https://cloud.r-project.org/) and Posit interface (version 353, https://posit.co/download/rstudio-desktop/, ex-RStudio).
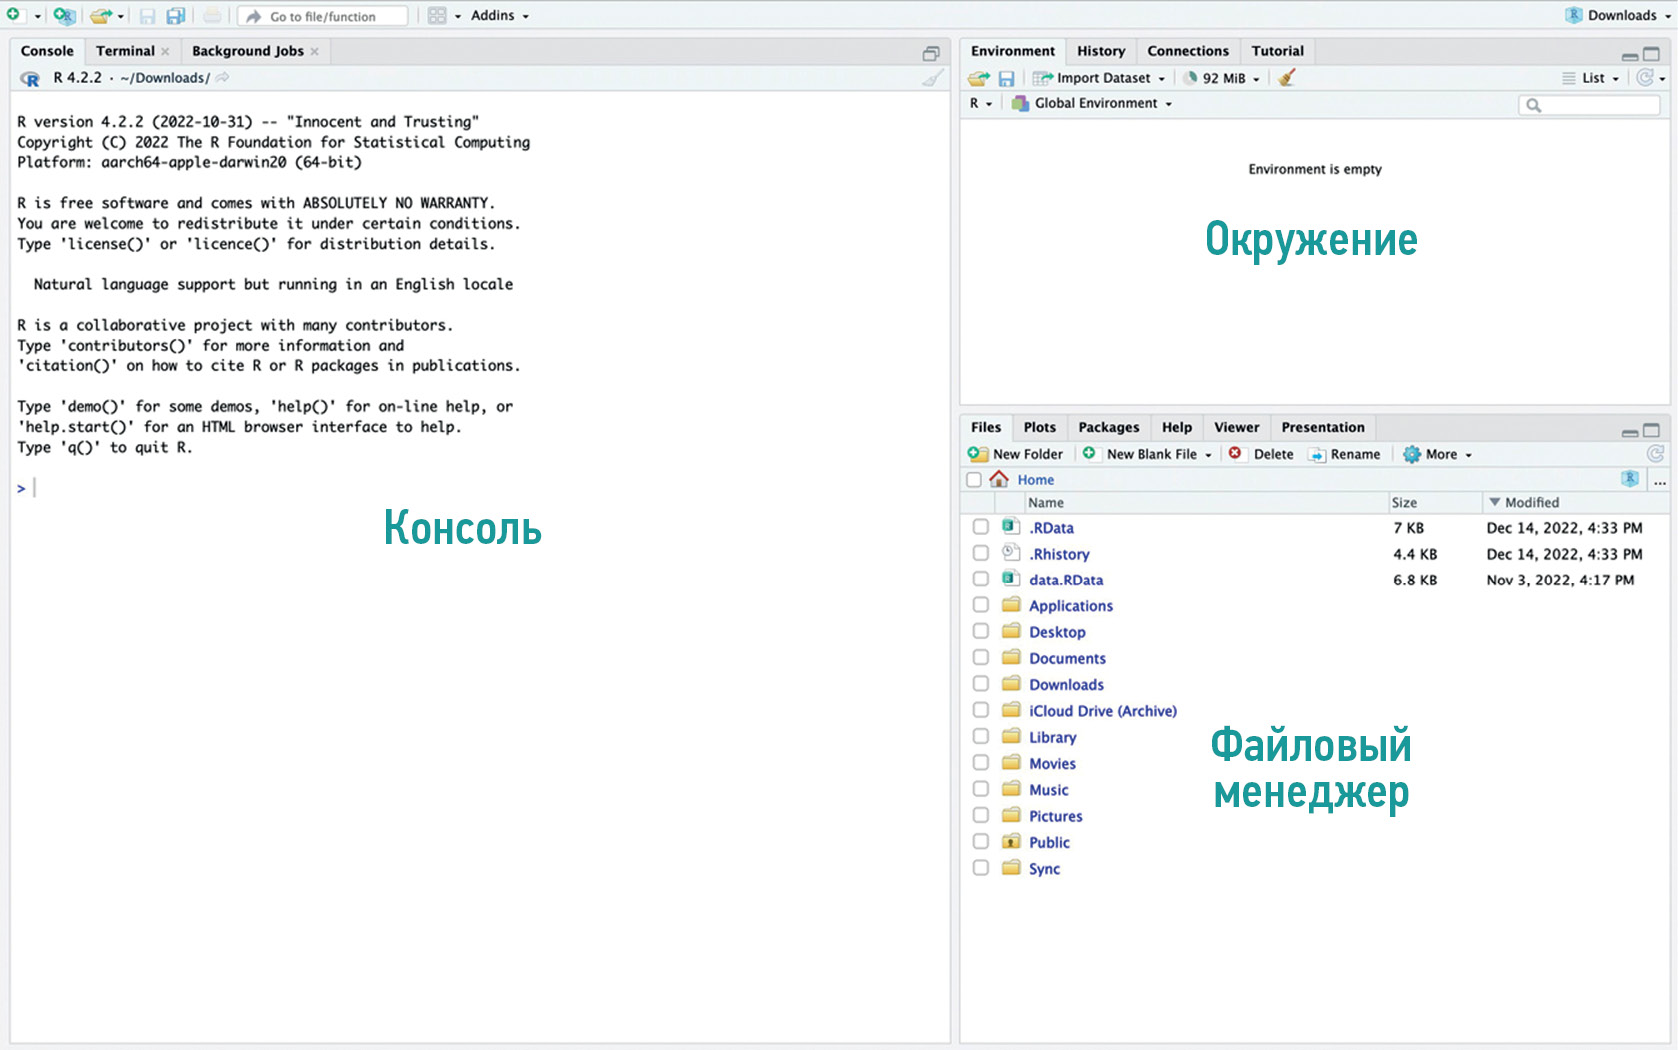
- The basic Posit interface can be divided into the console, environment, and files (Fig. 1).

Fig. 1. The Posit interface shows areas of the console, environment, and files.
Data were imported using the File-Import Dataset. In our case, we imported an Excel spreadsheet containing data on the effective doses of CT and LDCT.
After import, the program interface changes; a “data” variable is displayed in the environment block (Fig. 2). A new area also appeared in the upper left quadrant. This is a data-view block with the loaded table displayed. The comparison columns in the table are named as “Effective Dose (CT)” and “Effective Dose (LDCT).” Latin was used in the column names to avoid problems with encoding and incorrect display of characters in Posit.

Fig. 2. The Posit interface after importing the file. In the upper-left quadrant of the screen, a window with loaded columns of the data set. In the upper-right quadrant, the number of columns (variables) and rows (obs., observations).
For convenience, we created a separate variable for each of these columns by performing the commands shown in Fig. 3.

Fig. 3. Generating a separate variable for the effective dose of computed tomography with the functions of each command element is indicated.
A “$” operator (see Fig. 3) displays a drop-down menu of imported table columns to facilitate command entry. After creating the variables, they are displayed in the upper right quadrant of the interface as “values” (Fig. 4).

Fig. 4. The Posit window after importing the file and assigning values to the variables. In the upper-right quadrant, new variables with preview of the first five values in each. In the lower-left quadrant, a console interface for commands.
- The distribution of the loaded data was checked for normality using the Shapiro−Wilk test by the shapiro.test command (Fig. 5).

Fig. 5. Area with Posit console interface. Testing for normal data distribution using the Shapiro−Wilk test.
The resulting p-values for both variables were significantly less than the established threshold p-value of 0.05, so the distribution of the effective dose data for both CT and LDCT was non-normal. Therefore, the null hypothesis of this study was tested using the Wilcoxon test.
- For null hypothesis testing of paired quantitative samples with non-normal data distribution, the wilcox.test command was used (Figs. 6, 7).

Fig. 6. Using a Wilcoxon with functions of each command element indicated.

Fig. 7. Testing the null hypothesis of the study using the Wilcoxon test.
The resulting p-value was significantly less than the selected threshold p-value of 0.05; therefore, H0 could be rejected in favor of H1. This means that for CT and LDCT, the radiation exposure levels were statistically significantly different.
CONCLUSION
The main aim of this paper is to present the Posit interface and basic functions of the R language using a real-life medical case.
This paper summarizes theoretical approaches to medical data processing as well as recommendations for generating correct research tasks and selecting optimal methods for statistical analysis.
The presented material can be useful in the early stages of exploring statistical analysis methods using R language tools.
ADDITIONAL INFORMATION
Funding source. This article was prepared by a group of authors as a part of the medical research project (No. USIS [in the Unified State Information System for Accounting of Research, Development, and Technological Works]: 123031500005-2) «Scientific rationale for diagnostic radiology in oncology using radiomics».
Competing interests. The authors declare that they have no competing interests.
Authors’ contribution. All authors made a substantial contribution to the conception of the work, acquisition, analysis, interpretation of data for the work, drafting and revising the work, final approval of the version to be published and agree to be accountable for all aspects of the work. I.A. Blokhin ― writing the text of the article, editing and approval of the final version of the text of the manuscript; M.R. Kodenko, Yu.F. Shumskaya, A.P. Gonchar ― editing and approval of the final version of the text of the manuscript; R.V. Reshetnikov ― editing and approval of the final version of the text of the manuscript, advisory support.
1 JAMA guide to statistics and methods [Electronic resource]. Available from: https://jamanetwork.com/collections/44042/jama-guide-to-statistics-and-methods.
2 Medical statistics [electronic resource]. General issues of statistics. Available from: https://medstatistic.ru/statistics/statistics3.html.
3 Statistics online--checks assumptions, interprets results (https://www.statskingdom.com/); Medical statistics. Choice of statistical analysis method (https://medstatistic.ru/calculators/calcchoice.html).
About the authors
Ivan A. Blokhin
Moscow Center for Diagnostics and Telemedicine
Email: i.blokhin@npcmr.ru
ORCID iD: 0000-0002-2681-9378
SPIN-code: 3306-1387
Russian Federation, Moscow
Maria R. Kodenko
Moscow Center for Diagnostics and Telemedicine; Bauman Moscow State Technical University
Email: KodenkoMR@zdrav.mos.ru
ORCID iD: 0000-0002-0166-3768
SPIN-code: 5789-0319
Russian Federation, Moscow; Moscow
Yuliya F. Shumskaya
Moscow Center for Diagnostics and Telemedicine; The First Sechenov Moscow State Medical University
Email: ShumskayaYF@zdrav.mos.ru
ORCID iD: 0000-0002-8521-4045
SPIN-code: 3164-5518
Russian Federation, Moscow; Moscow
Anna P. Gonchar
Moscow Center for Diagnostics and Telemedicine
Email: a.gonchar@npcmr.ru
ORCID iD: 0000-0001-5161-6540
SPIN-code: 3513-9531
Russian Federation, Moscow
Roman V. Reshetnikov
Moscow Center for Diagnostics and Telemedicine
Author for correspondence.
Email: r.reshetnikov@npcmr.ru
ORCID iD: 0000-0002-9661-0254
SPIN-code: 8592-0558
Cand. Sci. (Phys-Math)
Russian Federation, MoscowReferences
- Emerson J, Colditz GA. Use of statistical analysis in the New England Journal of Medicine. New Engl J Med. 1983;309(12):709–713. doi: 10.1056/NEJM198309223091206
- Ali Z, Bhaskar SB. Basic statistical tools in research and data analysis. Indian J Anaesth. 2016;60(9):662–669. doi: 10.4103/0019-5049.190623
- Mishra P, Pandey CM, Singh U, et al. Selection of appropriate statistical methods for data analysis. Ann Card Anaesth. 2019;22(3):297–301. doi: 10.4103/aca.ACA_248_18
- Dwivedi AK, Shukla R. Evidence-based statistical analysis and methods in biomedical research (SAMBR) checklists according to design features. Cancer Rep (Hoboken). 2020;3(4):e1211. doi: 10.1002/cnr2.1211
- Rigby PC, German DM, Cowen L, et al. Peer review on open-source software projects: Parameters, statistical models, and theory. ACM Trans Softw Eng Methodol. 2014;23(4):35.
- Culpepper SA, Aguinis H. R is for revolution: A cutting-edge, free, open source statistical package. Organizational Research Methods. 2011;14(4):735–740.
- Ihaka R, Gentleman R. R: A language for data analysis and graphics. J Computational Graphical Statistics. 1996;5(3):299–314. doi: 10.1080/10618600.1996.10474713
- Niu G, Segall RS, Zhao Z, et al. A survey of open source statistical software (OSSS) and their data processing functionalities. Int J Open Source Software Processes. 2021;12(1):1–20. doi: 10.4018/IJOSSP.2021010101
- Shatenok MP, Ryzhov SA, Lantukh ZA, et al. Patient dose monitoring software in radiology. Digital Diagnostics. 2022;3(3):212–230. (In Russ). doi: 10.17816/DD106083
- Druzhinina UV, Ryzhov SA, Vodovatov AV, et al. Coronavirus Disease-2019: Changes in computed tomography radiation burden across Moscow medical facilities. Digital Diagnostics. 2022;3(1):5–15. (In Russ). doi: 10.17816/DD87628
- Gombolevskiy V, Morozov S, Chernina V, et al. A phantom study to optimise the automatic tube current modulation for chest CT in COVID-19. Eur Radiol Exp. 2021;5(1):21. doi: 10.1186/s41747-021-00218-0
- Blokhin I, Gombolevskiy V, Chernina V, et al. Inter-observer agreement between low-dose and standard-dose CT with soft and sharp convolution kernels in COVID-19 pneumonia. J Clin Med. 2022;11(3):669. doi: 10.3390/jcm11030669
- Blokhin IA, Gonchar AP, Kodenko M, et al. Impact of body mass index on the reliability of the CT0–4 grading system: A comparison of computed tomography protocols. Digital Diagnostics. 2022;3(2):108–118. (In Russ). doi: 10.17816/DD104358
- Kennedy-Shaffer L. Before p<0.05 to beyond p<0.05: Using history to contextualize p-values and significance testing. Am Stat. 2019;73(Suppl. 1):82–90. doi: 10.1080/00031305.2018.1537891
- Romão X, Delgado R, Costa A. An empirical power comparison of univariate goodness-of-fit tests for normality. J Statist Computation Simulat. 2010;80(5):545–591. doi: 10.1080/00949650902740824
- Lumley T, Diehr P, Emerson S, Chen L. The Importance of the normality assumption in large public health data sets. Ann Rev Pub Health. 2002;23(1):151–169. doi: 10.1146/annurev.publhealth.23.100901.140546
- Mishra P, Pandey CM, Singh U, et al. Descriptive statistics and normality tests for statistical data. Ann Card Anaesth. 2019;22(1):67–72. doi: 10.4103/aca.ACA_157_18
Supplementary files

