


Dosiomics in the analysis of medical images and prospects for its use in clinical practice
- Authors: Solodkiy V.A.1, Nudnov N.V.1, Ivannikov M.E.1, Shakhvalieva E.S.1, Sotnikov V.M.1, Smyslov A.Y.1
-
Affiliations:
- Russian Scientific Center of Roentgenoradiology
- Issue: Vol 4, No 3 (2023)
- Pages: 340-355
- Section: Systematic reviews
- Submitted: 15.05.2023
- Accepted: 15.06.2023
- Published: 26.09.2023
- URL: https://jdigitaldiagnostics.com/DD/article/view/420053
- DOI: https://doi.org/10.17816/DD420053
- ID: 420053

Cite item

Abstract
BACKGROUND: In recent years, there has been a notable increase in the number of articles using the term “dosiomics”. However, there are no literature reviews on this topic in the Russian language.
AIM: This study aims to describe the basic principles of dosiomics as a derivative of radiomics and to analyze studies devoted to assessing the possibilities of its application in clinical practice.
MATERIALS AND METHODS: A systematic literature search was performed in the PubMed database using the search query “dosiomics OR dosiomic”, and in the eLibrary database using the search query “dosiomics”. By April 2023, 43 foreign articles and 1 Russian article had been published.
RESULTS: The analysis encompassed 43 foreign studies investigating the use of dosiomics in clinical practice, alongside one Russian article that provided a definition of the term “dosiomics”. The analyzed papers were divided into three groups according to their subject matter, and two tables describing the results of 27 studies on the prediction of clinical outcomes were created.
CONCLUSION: Currently, dosiomics is a new and promising derivative of radiomics used in the textural analysis of medical images associated with radiation treatment of cancer patients. Dosiomics can contribute to the development of a more personalized approach to the planning of radiotherapy, the prediction of radiation damage of normal tissues, and the diagnosis of recurrence.
Full Text
INTRODUCTION
Radiation therapy is one of the most widely used treatments in cancer patients. Radiation therapy can be performed alone or in conjunction with surgery or chemotherapy, although there is a substantial risk of developing post-radiation problems [1]. As a result, toxicity assessment is an important aspect of radiation therapy planning and delivery [2].
Personalized dose selection is one approach to addressing this problem (e.g., increasing the dose for low-risk patients or optimizing treatment for patients with a high risk of complications [2]). At the planning stage of radiation therapy, prediction models are built to assess the risk of radiation damage to healthy organs and tissues based on various parameters.
Radiomics has recently gained popularity as a means of analyzing radiological data. This machine learning–based method for extracting quantitative characteristics from medical images (typically describing shape, intensity, and texture) may be used to develop prediction models [3].
Radiomics is commonly used to diagnose chest disorders such as nodules and cancer, obstructive and restrictive diseases, and infiltrative lung diseases [4–7]. Furthermore, radiomics has been successfully used to predict treatment side effects, such as pneumonitis associated with radiation therapy and immunotherapy, and distinguish between iatrogenic lung injury and tumor recurrence [7]. Radiomics has gained popularity in predicting the COVID-19 course [8–10]. Radiomics can help in diagnosis, prognosis, treatment, follow-up, and monitoring treatment response [11].
In addition to radiomics, the concept of “dosiomics” is becoming more popular. This radiomics area is used for the 3D distribution of radiation therapy doses to extract useful data for forecasting radiation therapy [12–14]. An integrated approach is becoming more popular for predicting post-radiation damage based on dosiomics, radiomics, and clinical data [13].
This study aims to describe the fundamental principles of dosiomics as a subfield of radiomics and examine a study that evaluates the potential for its use in clinical practice.
Search and inclusion criteria for literature sources
A systematic literature search was performed using a PubMed database with the search term “dosiomics OR dosiomic” and an eLibrary database with the search term “dosiomics.” By April 2023, 43 global papers have been published.
Therefore, 43 global studies evaluating the use of dosiomics in clinical practice and one Russian study defining the term “dosiomics” were analyzed [15]. The papers were divided into three groups based on their topics, and a summary table was compiled describing 27 studies according to their value for clinical outcome prediction.
BASICS OF RADIOMICS AND DOSIOMICS: METHODS FOR EXTRACTING TEXTURE CHARACTERISTICS FROM COMPUTED TOMOGRAPHIC IMAGES
Radiomics is a technology to establish a relationship between multiple quantitative characteristics extracted from medical images of organs and tissues and the clinical picture of the disease using multivariate statistical analysis [16].
Radiomics features define tissue pictures’ textural characteristics to identify image biomarkers and develop predictive rules [17].
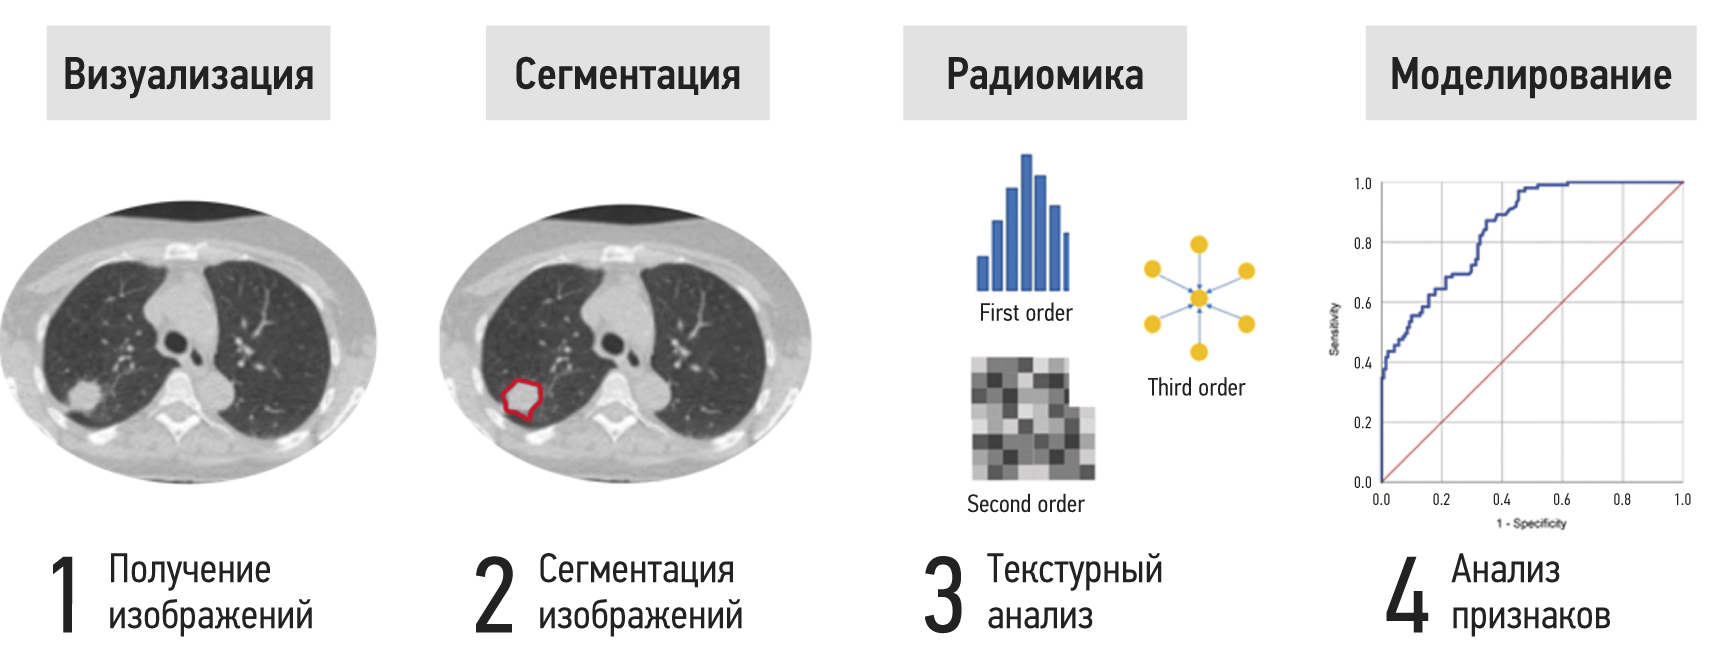
Figure 1 presents steps to extract and analyze radiomics features using lung computed tomography (CT) as an example. The area of interest is divided after a radiological assessment to isolate the lesion from the surrounding healthy tissue. For large and spatially heterogeneous lesions, 3D segmentation can provide more information. Segmentation can be done manually, semi-automatically, or automatically. The inaccessible radiomics features for visual assessment are then calculated using mathematical techniques. First-order statistics, gray-level adjacency, and homogeneity matrices are common parameters. The final stage involves reducing the sample size, statistical analysis, and selecting the most significant features while removing associated values to construct a decision rule using machine learning methods [18].

Fig. 1. Stages of extraction and analysis of radiomics features.
Key radiomics features
Radiomics features are extracted from medical images using the open-source PyRadiomics package. Radiomics uses two main groups of parameters: first-order statistics and texture matrices of adjacency and uniformity. These include the following matrices [16–18]:
- Gray-Level Co-occurrence Matrix (GLCM)
- Gray-Level Run-Length Matrix (GLRLM)
- Gray-Level Size Zone Matrix (GLSZM)
- Neighboring Gray Tone Difference Matrix (NGTDM)
- Gray-Level Dependence Matrix (GLDM)
First-order statistics use a pixel intensity histogram in a region of interest to characterize gray frequency distribution without considering spatial relationships between pixels [19]. These features are known as first-order statistics because they are based on examining a single pixel or voxel without considering the surrounding areas’ intensity.
Higher-order statistical measures consider the relative spatial location of voxels, allowing them to define texture characteristics. The most common are halftone adjacency and uniformity matrices (GLCM, GLRLM, and GLSZM). NGTDM and GLDM are less common.
GLCM is a second-order histogram of gray levels [19]. It captures spatial relationships between pixels or voxels with predefined gray-level intensities in different directions (horizontal, vertical, or diagonal for 2D analysis and 13 directions for 3D analysis) and a predefined distance between pixels or voxels (Figure 2; hereafter, the principle of calculating matrix parameters in 2D space will be presented) [20].

Fig. 2. Example of calculating GLCM parameters: three pairs of neighboring pixels with intensity levels 4 and 1 (highlighted in green).
GLRLM is a matrix described by Galloway. It represents the spatial distribution of vectors of successive pixels with the same gray-level in one or more directions in two or three dimensions (Figure 3).

Fig. 3. An example of calculating GLRLM parameters: there is one group of three pixels with the same gray-level (3), located sequentially (highlighted in orange).
GLSZM quantitatively describes image areas with the same gray-level, consisting of adjacent voxels. According to Thibault et al. [23], GLSZM is similar to GLRLM, but the first matrix is based on the calculated number of groups (so-called zones) of interconnected neighboring pixels or voxels with the same gray-level (Figure 4). A more uniform texture will result in a wider, flatter matrix. GLSZM cannot be calculated for different directions but can be calculated for varied distances between pixels or voxels in the neighborhood. GLSZM parameters can be determined in two (eight nearby pixels) or three (26 neighboring voxels) dimensions [19].

Fig. 4. Example of calculating GLSZM parameters: there is one zone consisting of four pixels with a gray-level of 2 (highlighted in green).
For NGTDM, the texture characteristics of a given matrix represent the intensity difference between adjacent voxels [24].
GLDM quantifies gray-level dependencies in an image [19, 25].
Dosiomics
Dosiomics is a relatively new area of radiomics. It is a textural study of radiation dose distribution used in radiation therapy planning.
The first scientific articles originate from 2018 when Gabry et al. [26] used this approach to predict xerostomia after radiation therapy in 15 head and neck cancer patients.
The process of obtaining dosiomics features includes two steps.
- Radiation therapy 3D planning uses a sequence of parallel X-ray CT images, with the anatomical structures and target volume defined manually or using an automatic mathematical contouring program in the planning system [27, 28].
- After acquiring 3D dose distribution models, they are processed using radiomics masks with open code implemented in Python, and quantitative textural parameters of an area of interest are generated. These parameters, which include the textural qualities outlined above (first-order statistics with adjacency and uniformity matrices), are retrieved from dose distribution models, and are referred to as dosiomics features.
Rossi et al. [29] reported a textural analysis of a 3D radiation dose distribution model in the rectal area. After mapping the radiation dose distribution, the area of interest is treated with radiomics masks, and textural characteristics are extracted. Figure 5 shows dosiomics features extracted from the area of interest.

Fig. 5. Texture analysis of a 3D model of radiation dose distribution to the rectal area: (a) 3D dose distribution in the rectum, (b) gray-level frequency histogram, (c) GLCM, (d) GLRLM, (e) GLSZM, and (f) NGTDM.
Because the studied data array often has a disproportionately large number of input variables, there is the problem of reducing the dimensions of the attribute space. One of the most prominent guidelines for the relationship between the number of features and observations is the 20 EPV rule. EPV (events per independent variable) is defined as the number of occurrences per independent variable, calculated by adding the number of patients in a smaller subgroup to the number of input characteristics used when creating a prediction model [30].
The next step is to reduce the attribute space’s dimensions using one of several methods, such as the principal component method, linear discriminant analysis, and random forest method (importance function) [31, 32]. Then, using machine learning approaches, eliminate linked values to construct a decision rule [18]. At the final stage, multivariate statistical analysis is undertaken using a forecasting model chosen based on the purpose of the examination. The accuracy of binary classification models is often assessed using a receiver operating characteristic (ROC) and denoted as the area under the curve (AUC) in studies. The curve uses sensitivity (the fraction of genuine positives) and specificity (the proportion of true negatives). The concordance index (C-index) is the most commonly used metric for evaluating the performance of survival models. Based on the Kendall correlation coefficient, this measures the rank correlation between predicted risk scores and observed scores at individual points in time.
USE OF DOSIOMICS IN CLINICAL PRACTICE
According to reviewed foreign literature, three main areas of research can be distinguished: the use of dosiomics features to predict radiation damage to healthy tissues, prediction of tumor relapses, and evaluation of the stability as well as reproducibility of dosiomic signs. Some literature reviews were also prepared; for example, groups of authors led by Sun [33] and Zhang [34] described dosiomics as a new direction in texture analysis of medical images.
Use of dosiomics features in predicting radiation damage to healthy tissues
All of these studies try to develop models (rules) for predicting cases of radiation damage in cancer patients. Most papers compared the efficacy of prognostic rules based on various types of data such as clinical factors, dose-volume histograms (DVH), indicators of radiobiological models of tumor control probability (TCP) and normal tissue complication probability (NTCP), dosiomics, radiomics, and dosimetry features.
The parameters researchers use, their combinations, and the statistical methods vary significantly from study to study. Most studies examined the ability to predict post-radiation pneumonitis in cancer patients after radiation therapy. According to the literature, the incidence of post-radiation pneumonitis ranges widely (from 5% to 58%) and it is one of the most prevalent consequences after lung cancer radiation therapy [1]. The most extensive research in this area was conducted by Zhang et al. in 2023 [35], using data from 314 retrospectively collected and 35 prospectively enrolled patients with lung cancer. The models used radiomics, dosiomics, DVHs, and clinical factors. In the external testing sample, a decision rule constructed by integrating radiomics, dosiomics, and clinical data showed the best predictive ability with an AUC of 0.855 (95% confidence interval, 0.719–0.990) [35]. According to the findings of this study, models based on integrating various parameters are more accurate.
Other researchers confirmed that a model based on a combination of dosiomics and radiomics features has the best predictive ability. Similar results were obtained by Li et al. [36, 37], who extracted metrics from specifically segmented functional areas of the lung, and Huang et al. [2]. Hence, a model by Zhou et al. [38], based on the distribution of equivalent radiation dose, demonstrated high predictive ability with the AUC of 0.799 in the test set. It should be noted that Kraus et al. [39] used a predictive model with the same combination of features, but it was based on the distribution of absorbed radiation dose, which proved to be more effective. Such differences may be related to the low reproducibility and stability of dosiomics features.
Some scientific papers have compared models based on dosimetry and dosiomics features. In studies by groups led by Puttanawarut [40] and Liang [13, 41], models based on dosiomics indicators were more effective, whereas in the study by Adachi et al. [42], the combination of dosiomics and dosimetry indicators was also clinically significant. Models integrating radiomics and dosiomics indicators have demonstrated great accuracy in predicting not only post-radiation pneumonitis but also additional post-radiation damage, such as severe weight loss (by more than 5% in 2 months), which is confirmed by Lee [43] and Han [44]. Han et al. developed a medical decision support system to help healthcare providers forecast severe weight loss more accurately. These results show that it is possible to implement decisive rules based on dosiomics in clinical practice. Zheng et al. [45] created a model for predicting acute radiation esophagitis in patients with lung cancer and obtained the highest area values under the ROC curve (0.801) using a combination of radiomics, dosiomics, and clinical features.
Ren et al. [46] showed higher efficiency of dosiomics-based decision rules than dosimetric models. Authors predicted post-radiation hypothyroidism in patients with nasopharyngeal carcinoma. Yang et al. [47] indicated radiation damage to the temporal lobe in individuals with a similar diagnosis. A model based on the patient’s age, dosimetric, and dosiomic features showed the best result with a C-index of 0.794 in the external test set.
Rossi et al. [29] used clinical data, dose-volume histogram indicators, and dosiomics features to improve the prediction of late radiation therapy complications of bladder and rectum radiation therapy, such as nocturia, rectal bleeding, and fecal incontinence. Monti [48] study should also be mentioned. It evaluated the relationship between dosiomics and genomics features in developing post-radiation lymphopenia in 186 patients with non-small cell lung cancer after chemoradiation therapy. The authors suggest that the discovered relationships will help develop more effective personalized radiation therapy strategies.
The reviewed studies showed that using dosiomics features in models increases the area under the ROC curve, indicating the predictive value of these parameters.
Described studies evaluating the ability to predict radiation damage to normal tissues are presented in Table 1.
Table 1. Studies to evaluate predicting radiation damage to normal tissues
Study | Predicted radiation damage | AUC model based on dosiomics | Model with the highest AUC |
Zhang et al. [35] | Post-radiation pneumonitis | 0.774 | R + D + C − AUC = 0.855 |
Li et al. [36] | Post-radiation pneumonitis | — | R + Ds − AUC = 0.885 |
Li et al. [37] | Post-radiation pneumonitis | 0.74 | R + D − AUC = 0.88 |
Huang et al. [2] | Post-radiation pneumonitis | 0.8462 | R + D − AUC = 0.90 |
Zhou et al. [38] | Post-radiation pneumonitis | — | R + DVH − AUC = 0.805 |
Kraus et al. [39] | Post-radiation pneumonitis | 0.70 | R + D − AUC = 0.79 |
Puttanawarut et al. [40] | Post-radiation pneumonitis | 0.71 | D − AUC = 0.71 |
Liang et al. [13] | Post-radiation pneumonitis | 0.782 | D − AUC = 0.782 |
Liang et al. [41] | Post-radiation pneumonitis | 0.782 | AUC = 0.842 |
Adachi et al. [42] | Post-radiation pneumonitis | 0.837 | Ds + D − AUC = 0.846 |
Lee et al. [43] | Weight loss | — | R + D − AUC = 0.710 |
Han et al. [44] | Weight loss | — | R + D − accuracy = 0.73, HCPs − accuracy = 0.54 |
Zheng et al. [45] | Acute radiation esophagitis | 0.604 | C + R + D − AUC = 0.801 |
Ren et al. [46] | Post-radiation hypothyroidism | 0.7 | D − AUC = 0.7 |
Yang et al. [47] | Radiation damage to the temporal lobe | — | Age + DVH + D − C-index = 0.794 |
Rossi et al. [29] | Rectal bleeding | — | C + DVH + D − AUC = 0.73 |
Fecal incontinence | C + DVH + D − AUC = 0.73 | ||
Nocturia | C + D − AUC = 0.66 | ||
Urinary incontinence | C + DVH + D − AUC = 0.73 |
Note. AUC, the area under the characteristic curve; C, clinical data of patients; D, dosiomics features; Ds, dosimetry features; DVH, dose-volume histograms; R, radiomics features.
Prediction of tumor recurrence/progression
These studies use the same general concepts to forecast radiation damage. Kamezawa et al. [49] and Wu et al. [14] evaluated the ability to predict local recurrence of head and neck cancer. Dosiomics-based models were the most effective. A similar study was conducted by Wang et al. [50], who built overall survival prediction models using texture indices extracted from CT, positron emission tomography CT (PET-CT), and dose distribution maps for radiation therapy planning. In terms of forecasting performance, the combined model was the most effective.
Murakami [12] and Pirrone [51] used different approaches for predicting prostate cancer recurrence. The first study predicted biochemical relapse. It was found that a model integrating clinical and dosiomic variables was the most effective for this purpose. The local recurrence prediction model in the second trial was based on radiomics and dosiomics indices generated from physiologically effective dose distribution maps, CT, and PET-CT images.
Buizza et al. [52] and Morelli et al. [53] demonstrated the effectiveness of dosiomic models in predicting the local recurrence of skull base chordomas and sacral localization. Similar decision rules also showed a high C-index in a study by Cai et al. [54] evaluating the ability to predict the recurrence and metastasis of nasopharyngeal carcinoma. Combined model by Wang et al. [55] demonstrated that machine learning with dosiomics features has the potential to predict complete remission of rectal cancer after radiotherapy.
Before treatment, Lam et al. [56] evaluated CT and MRI scans of 135 patients with nasopharyngeal carcinoma to predict the acceptability of adaptive radiation therapy. This was the first study to use the term “contouromics,” which refers to a method for defining intricate geometric relationships between four pairs of volumes of interest (VOI). The most accurate model was based on radiomics, with an AUC of 0.927 (95% confidence interval, 0.905–0.948).
As in the case of predicting radiation damage, these studies show the high accuracy of dosiomics-based models. Studies indicating relapse or progression of neoplasms are presented in Table 2.
Table 2. Studies to evaluate predicting tumor progression
Study | Predicted variable | Accuracy of the dosiomics-based model | Model with the highest accuracy |
Kamezawa et al. [49] | Local recurrence of head and neck cancer | AUC = 0.81 | D − AUC = 0.81 |
Wu et al. [14] | Local recurrence of head and neck cancer | C-index = 0.66 | D − C-index = 0.66 |
Wang et al. [50] | Local recurrence of head and neck cancer | — | R-PET + R-CT + Ds − C-index = 0.873 |
Murakami et al. [12] | Recurrence of prostate cancer | — | D + C − C-index = 0.67 |
Pirrone et al. [51] | Recurrence of prostate cancer | AUC = 0.68 | D − AUC = 0.68 |
Buizza et al. [52] | Recurrence of skull base chordomas | С-index = 0.79 | R − C-index = 0.80 |
Morelli et al. [53] | Recurrence of sacral chordomas | С-index = 0.86 | D − C-index = 0.86 |
Cai et al. [54] | Relapse and metastasis of nasopharyngeal carcinoma | C-index = 0.822 for relapse, C-index = 0.786 for metastasis | D − C-index = 0.822 for relapse, D − C-index = 0.786 for metastasis |
Wang et al. [55] | Remission of rectal cancer | — | AUC = 0.828 |
Lam et al. [56] | Grade ray therapy at carcinoma nasopharynx | AUC = 0.811 | R − AUC = 0.927 |
Note. AUC, area under the characteristic curve; C, clinical data of patients; CT, computed tomography; D, dosiomics features; Ds, dosimetry features; PET, positron emission tomography; R, radiomics features.
Reproducibility of dosiomics features
The statistical models and methods used in this group of studies are quite different, yet they all share the problem of low dosiomics stability and reproducibility. Two studies by Puttanawarut et al. [57, 58] were devoted to this issue. The first study assessed the general applicability of radiomics and dosiomics features derived from images of cancers of various locations. A database containing data from 101 patients with esophageal cancer patients and 93 lung cancer patients was used. Four models were developed to predict post-radiation pneumonitis in patients diagnosed with esophageal cancer and then applied to a group of patients with lung cancer. In samples of patients with esophageal cancer and lung cancer, the model based on a combination of dosiomics and radiomics features produced the best results, with AUC = 0.75 and AUC = 0.68, respectively. Such results may point to the restricted applicability of decision criteria to malignancies of various locations. The second study by Puttanawarut et al. [58] assessed the stability of dosiomics features when simulating errors in dose distribution planning. The average intraclass correlation coefficient (ICC) for the 93 dosiomics features tested was 0.9, indicating stability, with five features having values below 0.75, indicating low reproducibility. Adachi et al. [59] also assessed the reproducibility of dosiomics features when using various dose calculation algorithms. When using the Acuros XB algorithm, 34.8% of the 6,808 parameters tested exhibited good reproducibility, highlighting the limitations of dosiomics when using different types of dose calculations. Simultaneously, Sun et al. [60] reported that most dosiomic features were stable to changes in dose calculations, but DVH parameters were less variable than dosiomic features. Placidi et al. [61] identified four groups of stable dosiomics features for further research. The authors later demonstrated the significance of voxel size in dosiomics data extraction [62].
Indeed, normalization, stability, and reproducibility of features remain important aspects for such studies and require further research.
DISCUSSION
The most common predictor characteristic in the studies cited (11 studies) was post-radiation pneumonitis. In nine of them, dosiomics features without combination with other signs were used to construct the decision rule. The AUC, used as a fit measure for such models, ranged from 0.67 to 0.84. Decision rules based on dosiomics also had high accuracy when predicting relapses of tumors of various locations (C-index >0.66). The accuracy increased when combined models were constructed using dosiomics, radiomics, dosimetry features, and clinical data, indicating a good predictive ability and prospects for use in clinical practice for personalized treatment planning.
At the time of writing this article, a few studies were conducted with primarily small sample sizes, indicating the necessity for additional research into dosiomics and its possible applications. Dosiomics could be incorporated into the radiation therapy planning process. In most studies, dosiomics was the most effective when combined with other qualitative and quantitative signs; thus, dosiomics should now be considered precisely as a direction of radiomics that allows for improving the efficiency of predictive models. The properties of dosiomics and radiomics depend on the software used and can vary significantly from study to study. Low stability and reproducibility of features are severe barriers to introducing dosiomics into clinical practice; therefore, they require further study.
CONCLUSION
Dosiomics is a new and promising area of radiomics used in texture analysis of medical images associated with radiation therapy of cancer patients. Dosiomics can contribute to developing a more personalized approach to planning radiation therapy, predicting radiation damage to normal tissues, and diagnosing relapses.
ADDITIONAL INFORMATION
Funding source. This article was not supported by any external sources of funding.
Competing interests. The authors declare that they have no competing interests.
Authors’ contribution. All authors made a substantial contribution to the conception of the work, acquisition, analysis, interpretation of data for the work, drafting and revising the work, final approval of the version to be published and agree to be accountable for all aspects of the work. The major contributions were distributed as follows: V.A. Solodkiy — general concept and approval of the final version of the article; N.V. Nudnov — design and diagnostic aspects of the study; M.E. Ivannikov — data collection and analysis; E.S-A. Shakhvalieva — writing the manuscript text, preparation of illustrations; V.M. Sotnikov — radiotherapeutic aspects of the study, editing of the manuscript; A.Yu. Smyslov — dosimetric and physical aspects of the study, manuscript editing.
About the authors
Vladimir A. Solodkiy
Russian Scientific Center of Roentgenoradiology
Email: direktor@rncrr.ru
ORCID iD: 0000-0002-1641-6452
SPIN-code: 9556-6556
MD, Dr. Sci. (Med.), Professor
Russian Federation, MoscowNikolay V. Nudnov
Russian Scientific Center of Roentgenoradiology
Author for correspondence.
Email: nudnov@rncrr.ru
ORCID iD: 0000-0001-5994-0468
SPIN-code: 3018-2527
MD, Dr. Sci. (Med.), Professor
Russian Federation, MoscowMikhail E. Ivannikov
Russian Scientific Center of Roentgenoradiology
Email: ivannikovmichail@gmail.com
ORCID iD: 0009-0007-0407-0953
Russian Federation, Moscow
Elina S-A. Shakhvalieva
Russian Scientific Center of Roentgenoradiology
Email: shelina9558@gmail.com
ORCID iD: 0009-0000-7535-8523
Russian Federation, Moscow
Vladimir M. Sotnikov
Russian Scientific Center of Roentgenoradiology
Email: vmsotnikov@mail.ru
ORCID iD: 0000-0003-0498-314X
SPIN-code: 3845-0154
MD, Dr. Sci. (Med.), Professor
Russian Federation, MoscowAleksei Yu. Smyslov
Russian Scientific Center of Roentgenoradiology
Email: smyslov.ay@gmail.com
ORCID iD: 0000-0002-6409-6756
SPIN-code: 9341-0037
Cand. Sci. (Engin.)
Russian Federation, MoscowReferences
- Arroyo-Hernández M, Maldonado F, Lozano-Ruiz F, et al. Radiation-induced lung injury: Current evidence. BMC Pulm Med. 2021;21(1):9. doi: 10.1186/s12890-020-01376-4
- Huang Y, Feng A, Lin Y, et al. Radiation pneumonitis prediction after stereotactic body radiation therapy based on 3D dose distribution: Dosiomics and/or deep learning-based radiomics features. Radiat Oncol. 2022;17(1):188. doi: 10.1186/s13014-022-02154-8
- Morelli L, Parrella G, Molinelli S, et al. A dosiomics analysis based on linear energy transfer and biological dose maps to predict local recurrence in sacral chordomas after carbon-ion radiotherapy. Cancers (Basel). 2022;15(1):33. doi: 10.3390/cancers15010033
- Ryan SM, Fingerlin TE, Mroz M, et al. Radiomic measures from chest high-resolution computed tomography associated with lung function in sarcoidosis. Eur Respir J. 2019;54(2):1900371. doi: 10.1183/13993003.00371-2019
- Hooda R, Mittal A, Sofat S. Segmentation of lung fields from chest radiographs: A radiomic feature-based approach. Biomed Eng Lett. 2018;9(1):109–117. doi: 10.1007/s13534-018-0086-z
- Zhang B, Ni-Jia-Ti MY, Yan R, et al. CT-based radiomics for predicting the rapid progression of coronavirus disease 2019 (COVID-19) pneumonia lesions. Br J Radiol. 2021;94(1122):20201007. doi: 10.1259/bjr.20201007
- Avanzo M, Stancanello J, Pirrone G, et al. Radiomics and deep learning in lung cancer. Strahlenther Onkol. 2020;196(10):879–887. doi: 10.1007/s00066-020-01625-9
- Ji D, Zhang D, Xu J, et al. Prediction for progression risk in patients with COVID-19 pneumonia: The CALL score. Clin Infect Dis. 2020;71(6):1393–1399. doi: 10.1093/cid/ciaa414
- Chen H, Zeng M, Wang X, et al. A CT-based radiomics nomogram for predicting prognosis of coronavirus disease 2019 (COVID-19) radiomics nomogram predicting COVID-19. Br J Radiol. 2021;94(1117):20200634. doi: 10.1259/bjr.20200634
- Wang D, Huang C, Bao S, et al. Study on the prognosis predictive model of COVID-19 patients based on CT radiomics. Sci Rep. 2021;11(1):11591. doi: 10.1038/s41598-021-90991-0
- Frix AN, Cousin F, Refaee T, et al. Radiomics in lung diseases imaging: State of the Art for Clinicians. J Pers Med. 2021;11(7):602. doi: 10.3390/jpm11070602
- Murakami Y, Soyano T, Kozuka T, et al. Dose-Based radiomic analysis (dosiomics) for intensity modulated radiation therapy in patients with prostate cancer: Correlation between planned dose distribution and biochemical failure. Int J Radiat Oncol Biol Phys. 2022;112(1):247–259. doi: 10.1016/j.ijrobp.2021.07.1714
- Liang B, Yan H, Tian Y, et al. Dosiomics: Extracting 3D spatial features from dose distribution to predict incidence of radiation pneumonitis. Front Oncol. 2019;(9):269. doi: 10.3389/fonc.2019.00269
- Wu A, Li Y, Qi M, et al. Dosiomics improves prediction of locoregional recurrence for intensity modulated radiotherapy treated head and neck cancer cases. Oral Oncol. 2020;(104):104625. doi: 10.1016/j.oraloncology.2020.104625
- Andreev DA, Zavyalov AA. The quality indicators to assess the prostate cancer radiotherapy performance (brief review). Problems Social Hygiene Public Health History Med. 2021;29(S2):1292–1297. (In Russ). doi: 10.32687/0869-866X-2021-29-s2-1292-1297
- Chen Q, Xia T, Zhang M, et al. Radiomics in stroke neuroimaging: Techniques, applications, and challenges. Aging Dis. 2021;12(1):143–154. doi: 10.14336/AD.2020.0421
- Mayerhoefer ME, Materka A, Langs G, et al. Introduction to radiomics. J Nucl Med. 2020;61(4):488–495. doi: 10.2967/jnumed.118.222893
- Van Timmeren JE, Cester D, Tanadini-Lang S, et al. Radiomics in medical imaging: “How-to” guide and critical reflection. Insights Imaging. 2020;11(1):91. doi: 10.1186/s13244-020-00887-2
- Radiomic Features ― pyradiomics v3.0.1.post15+g2791e23 documentation [Internet]. Available from: https://pyradiomics.readthedocs.io/en/latest/features.html#. Accessed: 21.04.2023.
- Al-Areqi F, Konyar MZ. Effectiveness evaluation of different feature extraction methods for classification of COVID-19 from computed tomography images: A high accuracy classification study. Biomed Signal Process Control. 2022;(76):103662. doi: 10.1016/j.bspc.2022.103662
- Zwanenburg A, Vallières M, Abdalah MA, et al. The image biomarker standardization initiative: Standardized quantitative radiomics for high-throughput image-based phenotyping. Radiology. 2020;295(2):328–338. doi: 10.1148/radiol.2020191145
- Galloway MM. Texture analysis using gray level run lengths. Comput Graph Image Process. 1975;4(2):172–179. doi: 10.1016/S0146-664X(75)80008-6
- Thibault G, Angulo J, Meyer F. Advanced statistical matrices for texture characterization: Application to cell classification. IEEE Trans Biomed Eng. 2014;61(3):630–637. doi: 10.1109/TBME.2013.2284600
- Chen S, Harmon S, Perk T, et al. Using neighborhood gray tone difference matrix texture features on dual time point PET/ CT images to differentiate malignant from benign FDG-avid solitary pulmonary nodules. Cancer Imaging. 2019;19(1):56. doi: 10.1186/s40644-019-0243-3
- He J, Ren J, Niu G, et al. Multiparametric MR radiomics in brain glioma: Models comparation to predict biomarker status. BMC Med Imaging. 2022;22(1):137. doi: 10.1186/s12880-022-00865-8
- Gabryś HS, Buettner F, Sterzing F, et al. Design and selection of machine learning methods using radiomics and dosiomics for normal tissue complication probability modeling of xerostomia. Front Oncol. 2018;8:35. doi: 10.3389/fonc.2018.00035
- Ledenev VV, Nudnov NV, Sotnikov VM, et al. The results of quantitative evaluation of postradiation changes in lung cancer patients, which were obtained using a new procedure for analysis of dynamic X-ray computed tomography imaging of thoracic organs. J Radiol Nuclear Med. 2020;101(1):30–38. (In Russ). doi: 10.20862/0042-4676-2020-101-1-30-38
- Ledenev VV, Solodkiy VA, Nudnov NV, et al. Quantitative characteristics of radiation-induced lung damage in oncological patients during radiotherapy based on RCT data. Med Visual. 2022;26(4):60–74. (In Russ). doi: 10.24835/1607-0763-1182
- Rossi L, Bijman R, Schillemans W, et al. Texture analysis of 3D dose distributions for predictive modelling of toxicity rates in radiotherapy. Radiother Oncol. 2018;129(3):548–553. doi: 10.1016/j.radonc.2018.07.027
- Liu J, Guo W, Zeng P, et al. Vertebral MRI-based radiomics model to differentiate multiple myeloma from metastases: Influence of features number on logistic regression model performance. Eur Radiol. 2022;32(1):572–581. doi: 10.1007/s00330-021-08150-y
- Dhir CS, Lee SY. Discriminant independent component analysis. IEEE Trans Neural Netw. 2011;22(6):845–857. doi: 10.1109/TNN.2011.2122266
- Random Forest Feature Importance Computed in 3 Ways with Python | MLJAR [Internet]. Available from: https://mljar.com/blog/feature-importance-in-random-forest/. Accessed: 21.04.2023.
- Sun R, Lerousseau M, Henry T, et al. Intelligence artificielle en radiothérapie: Radiomique, pathomique, et prédiction de la survie et de la réponse aux traitements. Cancer Radiother. 2021;25(6-7):630–637. doi: 10.1016/j.canrad.2021.06.027
- Zhang X, Zhang Y, Zhang G, et al. Deep learning with radiomics for disease diagnosis and treatment: challenges and potential. Front Oncol. 2022;(12):773840. doi: 10.3389/fonc.2022.773840
- Zhang Z, Wang Z, Yan M, et al. Radiomics and dosiomics signature from whole lung predicts radiation pneumonitis: A model development study with prospective external validation and decision-curve analysis. Int J Radiat Oncol Biol Phys. 2023;115(3):746–758. doi: 10.1016/j.ijrobp.2022.08.047
- Li B, Ren G, Guo W, et al. Function-Wise dual-omics analysis for radiation pneumonitis prediction in lung cancer patients. Front Pharmacol. 2022;(13):971849. doi: 10.3389/fphar.2022.971849
- Li B, Zheng X, Zhang J, et al. Lung subregion partitioning by incremental dose intervals improves omics-based prediction for acute radiation pneumonitis in non-small-cell lung cancer patients. Cancers (Basel). 2022;14(19):4889. doi: 10.3390/cancers14194889
- Zhou L, Wen Y, Zhang G, et al. Machine learning-based multiomics prediction model for radiation pneumonitis. J Oncol. 2023;2023:5328927. doi: 10.1155/2023/5328927
- Kraus KM, Oreshko M, Bernhardt D, et al. Dosiomics and radiomics to predict pneumonitis after thoracic stereotactic body radiotherapy and immune checkpoint inhibition. Front Oncol. 2023;(13):1124592. doi: 10.3389/fonc.2023.1124592
- Puttanawarut C, Sirirutbunkajorn N, Khachonkham S, et al. Biological dosiomic features for the prediction of radiation pneumonitis in esophageal cancer patients. Radiat Oncol. 2021;16(1):220. doi: 10.1186/s13014-021-01950-y
- Liang B, Tian Y, Chen X, et al. Prediction of radiation pneumonitis with dose distribution: A convolutional neural network (CNN) based model. Front Oncol. 2020;(9):1500. doi: 10.3389/fonc.2019.01500
- Adachi T, Nakamura M, Shintani T, et al. Multi-institutional dose-segmented dosiomic analysis for predicting radiation pneumonitis after lung stereotactic body radiation therapy. Med Phys. 2021;48(4):1781–1791. doi: 10.1002/mp.14769
- Lee SH, Han P, Hales RK, et al. Multi-view radiomics and dosiomics analysis with machine learning for predicting acute-phase weight loss in lung cancer patients treated with radiotherapy. Phys Med Biol. 2020;65(19):195015. doi: 10.1088/1361-6560/ab8531
- Han P, Lee SH, Noro K, et al. Improving early identification of significant weight loss using clinical decision support system in lung cancer radiation therapy. JCO Clin Cancer Inform. 2021;(5):944–952. doi: 10.1200/CCI.20.00189
- Zheng X, Guo W, Wang Y, et al. Multi-omics to predict acute radiation esophagitis in patients with lung cancer treated with intensity-modulated radiation therapy. Eur J Med Res. 2023;28(1):126. doi: 10.1186/s40001-023-01041-6
- Ren W, Liang B, Sun C, et al. Dosiomics-based prediction of radiation-induced hypothyroidism in nasopharyngeal carcinoma patients. Phys Med. 2021;(89):219–225. doi: 10.1016/j.ejmp.2021.08.009
- Yang SS, OuYang PY, Guo JG, et al. Dosiomics risk model for predicting radiation induced temporal lobe injury and guiding individual intensity-modulated radiation therapy. Int J Radiat Oncol Biol Phys. 2023;115(5):1291–1300. doi: 10.1016/j.ijrobp.2022.11.036
- Monti S, Xu T, Liao Z, et al. On the interplay between dosiomics and genomics in radiation-induced lymphopenia of lung cancer patients. Radiother Oncol. 2022;(167):219–225. doi: 10.1016/j.radonc.2021.12.038
- Kamezawa H, Arimura H. Recurrence prediction with local binary pattern-based dosiomics in patients with head and neck squamous cell carcinoma. Phys Eng Sci Med. 2023;46(1):99–107. doi: 10.1007/s13246-022-01201-8
- Wang B, Liu J, Zhang X, et al. Prognostic value of 18F-FDG PET/CT-based radiomics combining dosiomics and dose volume histogram for head and neck cancer. EJNMMI Res. 2023;13(1):14. doi: 10.1186/s13550-023-00959-6
- Pirrone G, Matrone F, Chiovati P, et al. Predicting local failure after partial prostate re-irradiation using a dosiomic-based machine learning model. J Pers Med. 2022;12(9):1491. doi: 10.3390/jpm12091491
- Buizza G, Paganelli C, D’Ippolito E, et al. Radiomics and dosiomics for predicting local control after carbon-ion radiotherapy in skull-base chordoma. Cancers (Basel). 2021;13(2):339. doi: 10.3390/cancers13020339
- Morelli L, Parrella G, Molinelli S, et al. A dosiomics analysis based on linear energy transfer and biological dose maps to predict local recurrence in sacral chordomas after carbon-ion radiotherapy. Cancers (Basel). 2022;15(1):33. doi: 10.3390/cancers15010033
- Cai C, Lv W, Chi F, et al. Prognostic generalization of multi-level CT-dose fusion dosiomics from primary tumor and lymph node in nasopharyngeal carcinoma. Med Phys. 2023;50(2):922–934. doi: 10.1002/mp.16044
- Wang D, Lee SH, Geng H, et al. Interpretable machine learning for predicting pathologic complete response in patients treated with chemoradiation therapy for rectal adenocarcinoma. Front Artif Intell. 2022;(5):1059033. doi: 10.3389/frai.2022.1059033
- Lam SK, Zhang Y, Zhang J, et al. Multi-Organ omics-based prediction for adaptive radiation therapy eligibility in nasopharyngeal carcinoma patients undergoing concurrent chemoradiotherapy. Front Oncol. 2022;(11):792024. doi: 10.3389/fonc.2021.792024
- Puttanawarut C, Sirirutbunkajorn N, Tawong N, et al. Radiomic and dosiomic features for the prediction of radiation pneumonitis across esophageal cancer and lung cancer. Front Oncol. 2022;(12):768152. doi: 10.3389/fonc.2022.768152
- Puttanawarut C, Sirirutbunkajorn N, Tawong N, et al. Impact of interfractional error on dosiomic features. Front Oncol. 2022;(12):726896. doi: 10.3389/fonc.2022.726896
- Adachi T, Nakamura M, Kakino R, et al. Dosiomic feature comparison between dose-calculation algorithms used for lung stereotactic body radiation therapy. Radiol Phys Technol. 2022;15(1):63–71. doi: 10.1007/s12194-022-00651-9
- Sun L, Smith W, Kirkby C. Stability of dosiomic features against variations in dose calculation: An analysis based on a cohort of prostate external beam radiotherapy patients. J Appl Clin Med Phys. 2023;24(5):e13904. doi: 10.1002/acm2.13904
- Placidi L, Gioscio E, Garibaldi C, et al. A Multicentre evaluation of dosiomics features reproducibility, stability and sensitivity. Cancers (Basel). 2021;13(15):3835. doi: 10.3390/cancers13153835
- Placidi L, Cusumano D, Lenkowicz J, et al. On dose cube pixel spacing pre-processing for features extraction stability in dosiomic studies. Phys Med. 2021;(90):108–114. doi: 10.1016/j.ejmp.2021.09.010
Supplementary files

