


Conventional magnetic resonance imaging of peripheral nerves: MR-neurography
- Authors: Morozova S.N.1, Sinkova V.V.1, Grishina D.A.1, Tumilovich T.A.1, Chechetkin A.O.1, Krotenkova M.V.1, Suponeva N.A.1
-
Affiliations:
- Research Center of Neurology
- Issue: Vol 4, No 3 (2023)
- Pages: 356-368
- Section: Reviews
- Submitted: 17.05.2023
- Accepted: 04.07.2023
- Published: 26.09.2023
- URL: https://jdigitaldiagnostics.com/DD/article/view/430292
- DOI: https://doi.org/10.17816/DD430292
- ID: 430292

Cite item

Abstract
Peripheral neuropathy is known to be one of the most common neurological disorders. Despite the great diagnostic value of electroneuromyography and ultrasound, addressing the diagnostics and differential diagnostics of peripheral nerve diseases of different origin could be challenging. In recent years, magnetic resonance tomography has been increasingly used for evaluating cases of suspected or established peripheral neuropathy with excellent results.
This manuscript mainly deals with the advantages and limitations of the aforementioned diagnostic instruments, technical considerations according to different anatomy of peripheral nerves, along with state-of-the-art technical decisions, frequently used magnetic resonance imaging sequences and their diagnostic value based on own observation, and recommendations for contrast enhancement use and different methods of fat suppression.
Currently, there is practically no standardized description of normal magnetic resonance imaging features of peripheral nerves, as well as their changes in different diseases. The evaluation of images is mainly based on the radiologist experience, which obviously decreases method’s diagnostic value. Studies of large numbers involving healthy volunteers and patients with peripheral neuropathies of different origin are required to address this issue.
Full Text
INTRODUCTION
Peripheral neuropathy, one of the most common neurological conditions, is an umbrella term covering peripheral nerve diseases [1]. It is classified as mononeuropathy, multiple (multifocal) mononeuropathy, or polyneuropathy based on the number of nerve fibers involved. Ischemia and compression, trauma, infections, neoplasms, dysmetabolism, disimmunity, toxicity, and insufficiency can all contribute to peripheral neuropathy [2, 3].
If peripheral neuropathy is suspected, a complete medical history and complaints, including a family history, should be obtained [4]. In most cases, the cause may be determined using laboratory tests. At present, electroneuromyography is the gold standard of research. It evaluates the conductive function of upper and lower extremity motor and sensory nerves, their proximal sections (indirectly), and innervated muscles (denervation activity) [5]. These studies can help determine the location, extent, degree, and lesion type [6, 7].
However, electrophysiology has several limitations, such as the inability to diagnose difficult-to-reach proximal areas of the peripheral nervous system [8]. Furthermore, in acute and chronic peripheral neuropathies with previously affected distal parts, they are often highly degenerated at the first visit of a patient, making diagnosis challenging (this is the so-called floor effect that occurs when a data-gathering instrument has a lower limit to the data values it can reliably specify) [3]. For the same reason, certain complications can arise when attempting to differentiate between the entirely afflicted cross-section of the distal nerve and the more proximal lesion of the peripheral fascicle [9]. Another important limiting factor is that results are operator-dependent, which refers to variations in effects caused by a healthcare professional’s (HCP) levels of competence when doing an electroneuromyography.
High-resolution ultrasonography is a highly informative, supportive approach for real-time prolonged imaging of peripheral nerve conditions, identifying intraneural changes, and evaluating perineural tissues [10, 11]. Ultrasound of the peripheral nerves is now widely used to diagnose post-traumatic, compression, dysimmune, hereditary neuropathies, and nerve tumors [12]. However, the efficiency and reproducibility of this procedure largely depend on HCP experience [13], the type of ultrasound device, and the transducer frequency used. Unlike electrophysiological techniques, ultrasound does not identify the type of nerve fiber injury. Furthermore, deep-lying peripheral nerves near bone structures and internal organs may be difficult to see or inaccessible to ultrasonography [14].
Magnetic resonance imaging (MRI) is not commonly used to diagnose peripheral nervous system problems. The reasons for this are as follows: (a) the need to obtain very high-resolution 3D images to visualize morphological changes in the nerve structure, which lengthens the examination and increases the potential of artifacts, and (b) the lack of detailed description of the normal state of the peripheral nervous system visualized that complicates interpretation of the data obtained. However, with recent technological advances, MRI is now considered an alternative modality for diagnosing peripheral nerve disorders and can be recommended in cases of suspected lesions that are difficult to reach with conventional methods, surgical procedure planning, controversial electroneuromyography, ultrasound data, trauma, radiation therapy, and surgery history [15].
USE OF MRI FOR PERIPHERAL NERVOUS SYSTEM VISUALIZATION
Although even today, MRI is prescribed to patients with suspected peripheral neuropathy rather to exclude a mass lesion inside or directly adjacent to the nerve [16], as early as in the 1990s, a research group led by Filler and Howe [17, 18] developed the first MR sequences with higher spatial resolution, and increased the contrast of peripheral nerves for their optimal visualization. This procedure was known as magnetic resonance neurography (MR neurography).
Magnetic resonance neurography is used in clinical practice to diagnose traumatic nerve injuries and carpal tunnel syndromes and plan the treatment. In the first case, MR neurography distinguishes a complete nerve transection with all supporting connective tissue structures affected (neurotmesis), requiring surgical intervention and damage to the axon without its sheath destruction (axonotmesis) or local demyelination due to compression or traction with axonal structures preserved (neuropraxia), which can recover spontaneously [19]. MR neurography may also be used for nerve recovery monitoring in controversial cases. This approach is often used to locate and determine the specific location of a lesion in tunnel syndromes (compression neuropathies). If surgical treatment fails, MR neurography is also recommended.
This diagnostic area is developing more rapidly than other areas related to the peripheral nervous system [3]. Therefore, plexus MRI is now part of the confirming diagnostic criteria for chronic inflammatory demyelinating polyneuropathy and multifocal motor neuropathy [20, 21]. Noninvasiveness, low operator dependency, the specific location of pathological alterations and their clear relationship with adjacent anatomical structures, a full assessment of all anatomical structures in the area studied, and monitoring over time are all advantages.
BASIC TECHNICAL REQUIREMENTS FOR MRI PROTOCOL
Magnetic resonance neurography is a technique for optimizing peripheral nerve visualization that uses nerve-selective (imaging nerve trunks with suppressed signals from surrounding tissues and vasculature [22]) and nerve-nonselective sequences with high-resolution and contrast augmentation.
There are also some limitations. First, because the transverse size of a nerve is typically only a few millimeters and the thickness of individual fascicles is approximately ≤1 mm, individual nerve trunks may only be visualized using high-resolution techniques. Longer acquisition periods and lower signal-to-noise ratios are required for such images. Furthermore, adipose tissue around and inside neural systems makes qualitative and quantitative examinations of peripheral nerve structures challenging. Therefore, various fat suppression techniques are used to visualize them, which can also affect the image evaluation and the signal-to-noise ratio. Because of the intricate anatomical course of some peripheral nerves, three-dimensional sequences are required; however, images may become noisy and grainy due to overlapping vascular signals. In contrast, MRI of the peripheral nervous system is currently being intensively developed [23, 24].
To visualize individual nerve fascicles within the nerve, equipment with a magnetic field of 3 Tesla (T) [3] provides sufficient spatial resolution. They have a higher signal-to-noise ratio, allowing for stronger contrast, higher resolution in the scan plane, and the smallest slice thickness. The smallest slice thickness is required for higher end-to-end resolution in 2D sequences and higher isotropic resolution in 3D sequences [25]. However, 1.5-T MRI tomographs can be used, particularly in patients with metallic implants in the scanning field [26].
To reduce the effect of partial volume, and to visualize individual nerve structures surrounded by loose connective and fat tissues, the spatial resolution should be ≥0.1–0.4 × 0.1–0.4 mm, and slice thickness for two-dimensional sequences should be >2.0–3.5 mm for plexuses and 4–5 mm for extremities, with minimal or no interslice gap [3, 25]. Although 2D sequences are still the gold standard for the first evaluation, 3D sequences (with the ability to reconstruct images in different planes) are critical for viewing and addressing difficulties when the anatomical nerve course is convoluted, and the available data are contentious. Slices should be designated relative to the long axes, that is, parallel or perpendicular to the nerve’s extremity or course as far as feasible [25].
Optimal imaging results are achieved by using multichannel coils for specific body parts, but other solutions are possible by replacing missing coils with existing coils, provided that the patient is positioned correctly. Special multichannel coils with accelerating factors can be used with soft surface coils to increase the field of view. A combination of spinal embedded and soft surface coils is recommended for performing examinations at the trunk level [27].
Before organizing an examination, consider the broadest possible covering area, and that the more slices there are the longer the examination will last. The field of view should be restricted as much as possible to achieve improved spatial resolution, with the empty space around the area of interest being no more than 20% of its size for effective assessment of small-diameter nerves [25].
To eliminate motion artifacts, the patient should be appropriately and comfortably positioned [3]. To avoid interference with the bladder signal on maximum intensity projection reconstructions, the bladder should be emptied before studying the lumbar and sacral plexuses.
CONVENTIONAL MR NEUROGRAPHY TECHNIQUES AND THEIR CLINICAL USE
The most commonly used techniques in routine clinical practice include qualitative assessment of T1- and T2-weighted images and proton density-weighted images, which are contrasted using T1 and T2 relaxation processes and proton density localization in human tissues with spin or gradient echo sequences. Various fat suppression strategies are used (discussed in more detail below). Regardless of the area of interest, at least two scanning planes, preferably with at least one 3D sequence, are recommended.
T1-weighted images
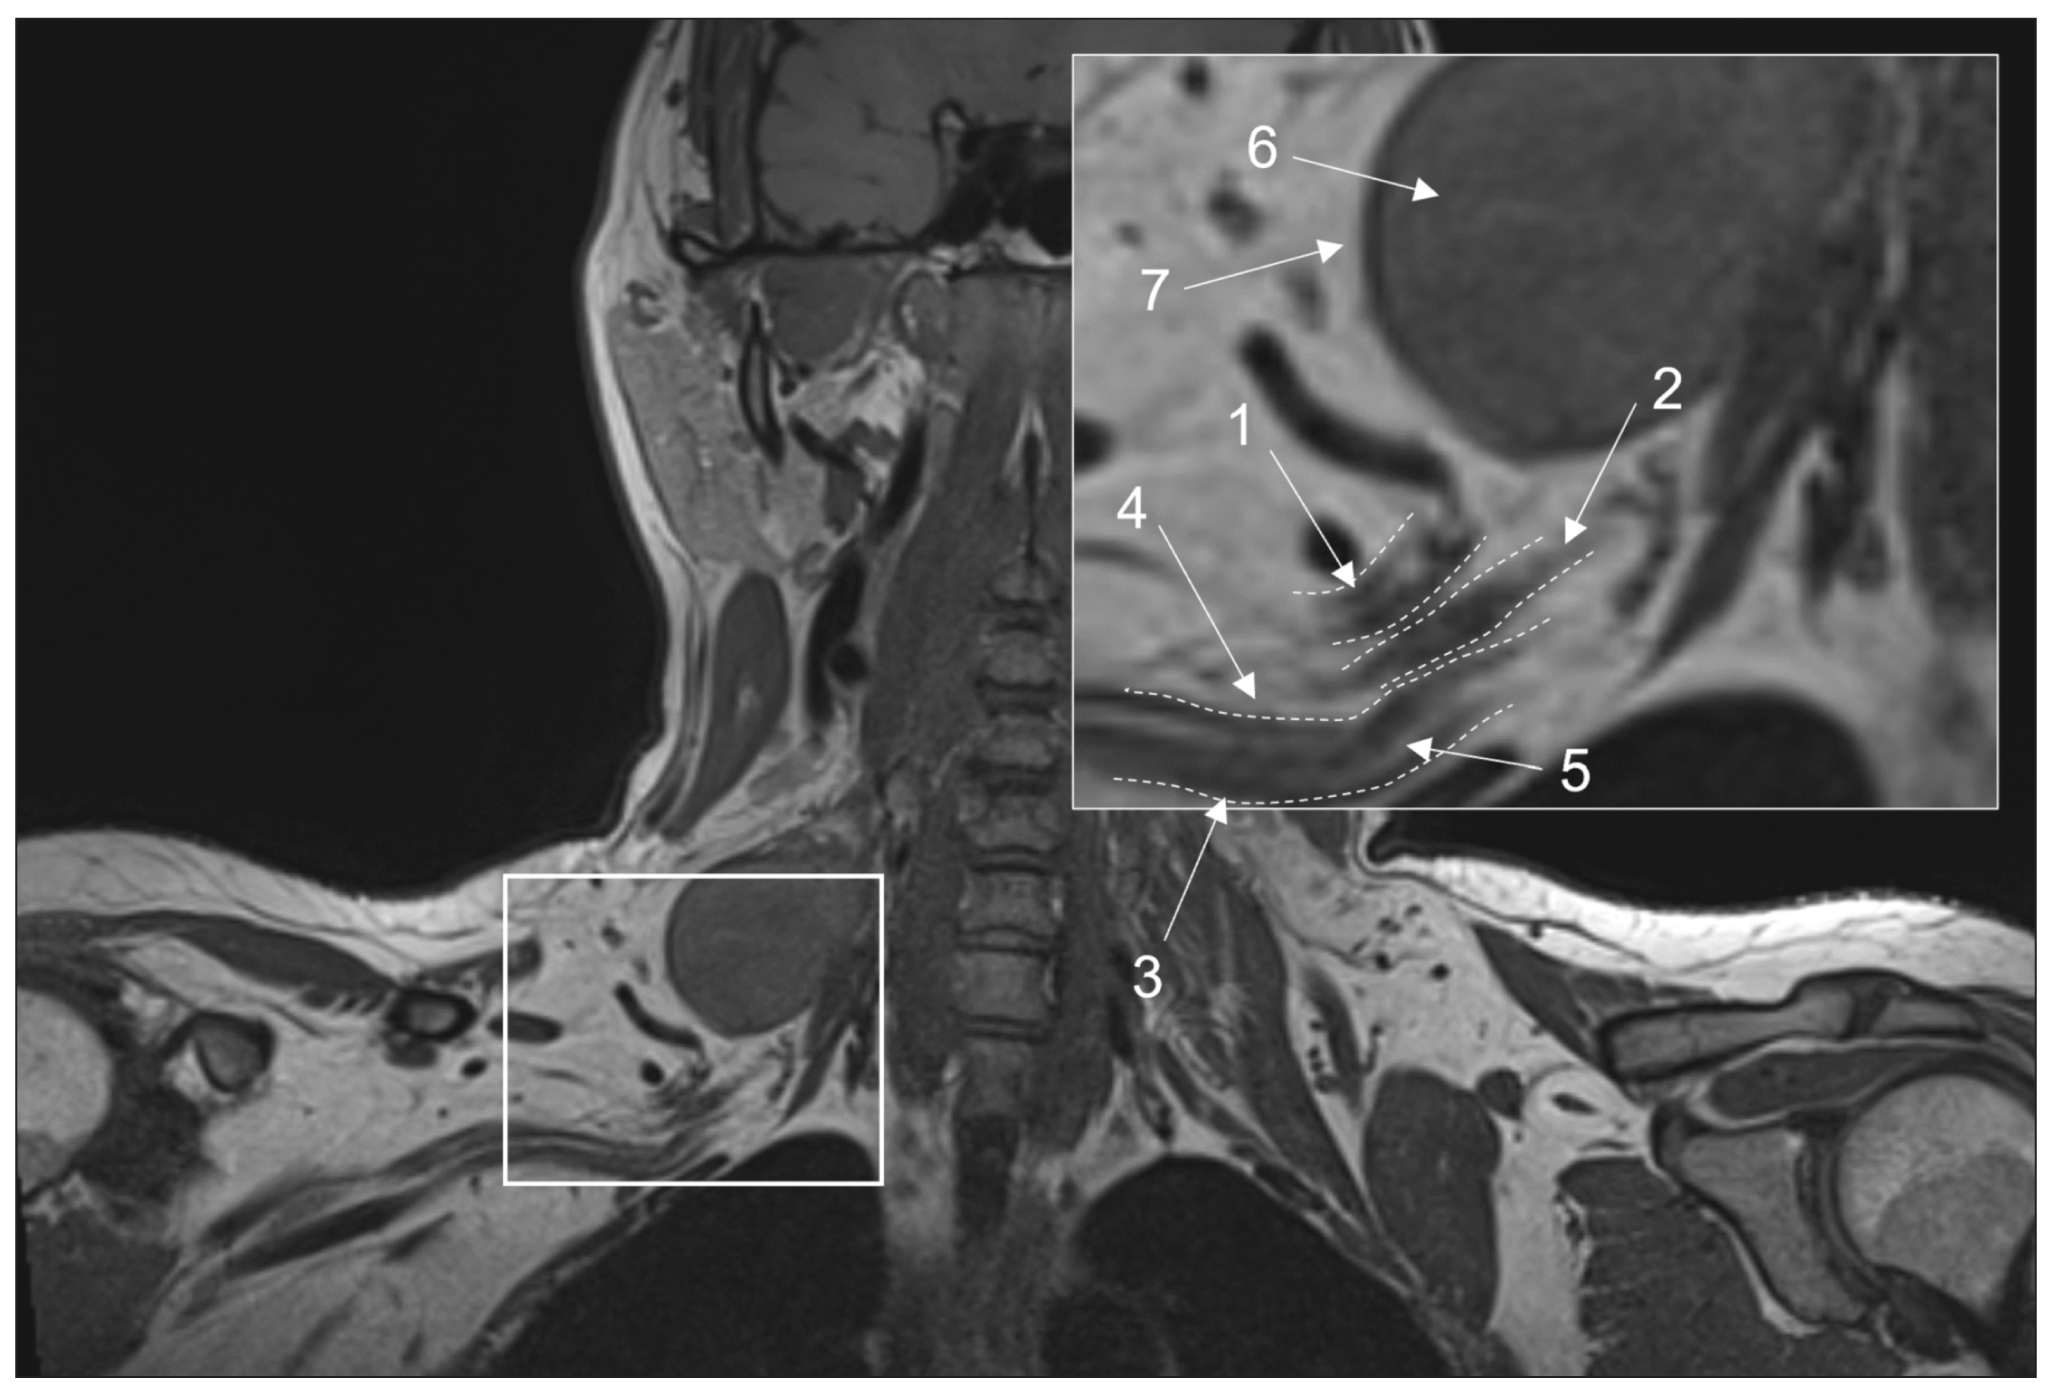
These images are essential for neurography and can be acquired using spin echo or free fluid suppression inversion recovery sequences in the axial plane for extremity nerves and the coronal plane for plexuses. The length of the echo complex varies from three to eight for 2D images and from 33 to 68 for 3D images. A scanning plane resolution of 0.3 to 0.4 mm ensures optimal visibility of intraneural fat, epineurium thickening, and elimination of perineural fat due to mass lesion development or fibrosis (Fig. 1) [28]. Furthermore, these images are critical for determining fatty infiltration and muscular atrophy. They are also less susceptible to motion and magnetic susceptibility aberrations and can typically detect edema, tract interruption, or changes in cross-sectional nerve configuration due to compression [3].

Fig. 1. Magnetic resonance imaging of the brachial plexuses in 3D-T1 mode. A coronal projection: (1) the upper trunk, (2) the middle trunk, (3) the lower trunk, (4) the perineural fatty tissue, (5) the endoneurial fat, (6) a mass lesion (schwannoma), and (7) the intact fatty tissue around the lesion.
Contrast-enhanced MR neurography
T1-weighted 3D gradient echo sequences with fat tissue signal suppression and possible subsequent image removal are recommended for pre- and post-contrast imaging. Otherwise, their use for 3D imaging can be limited due to greater artifact susceptibility and lower contrast enhancement.
After intravenous contrast agent injection, a blood–nerve barrier prevents intact nerve signals from altering [24]. Contrast enhancement has little diagnostic benefit in the case of traumatic alterations or carpal tunnel syndromes because these conditions are often investigated with MRI in the subacute period. Only denervated muscles can be increased under these conditions. However, they are well visualized on fat-suppressed images sensitive to fluid signals [25]. Contrast enhancement is related to nerve signal alterations in hereditary and demyelinating polyneuropathies; this is also unnecessary.
In some circumstances, such as a suspected neural or perineural mass lesion, lymphoma, inflammatory processes related to perineural infection, and other disorders associated with damage to the blood–nerve, a contrast-enhanced examination may be recommended [29]. In addition to the disorders listed, a contrast-enhanced examination may be done following decompressive surgery to rule out the overproduction of fibrous tissue if clinical symptoms persist [30].
Nerve-specific contrast agents, such as agents with selective accumulation in areas of demyelination that gradually decreases as the fiber regenerates, are currently being developed, but related MRI techniques have not yet been approved for clinical use [24].
T2-weighted images
Early observations showed that T2 images are the most important for diagnosing peripheral nerve injuries [31]. Non-fat-suppressed sequences, typically 2D, are useful for observing the epineurium (Fig. 2). Fat suppression differentiates the relatively high nerve signal and the surrounding fat tissue. For T2-weighted images without fat suppression, the recommended echo time is >90 ms (milliseconds), ideally 100–105 ms. For fat-suppressed sequences, it can be reduced to 60–80 ms. The latter, so-called fluid-sensitive images, provide ideal nerve visualization (Fig. 3) with increased signals in the area of pathological changes [32]. Fat suppression strategies are based on the difference in water–fat precession frequency and fat tissue having a longer T2 relaxation time and shorter T1 relaxation time than muscle tissue or nerve fibers [2].

Fig. 2. Magnetic resonance imaging of the hand in T2 mode in a patient with carpal tunnel syndrome. An axial projection: (a) at the level of proximal epiphyses of metacarpal bonesand (b) at the level of distal parts of the capitate bone (1: individual fascicles as part of the median nerve, 2: epineurium, and 3: flexor retinaculum with a thickness of up to 1.29 mm).

Fig. 3. Various techniques of fat suppression for magnetic resonance imaging: (a) brachial plexuses in T2-FatSat mode, an axial projection: the anterior branches of C5, C6, and C7 spinal nerves are noted, without abnormalities, with a slightly increased signal; heterogeneous fat suppression with unsatisfactory signal along the periphery of the area of interest (arrowed); (b) brachial plexuses in STIR mode, a coronal projection: homogenous fat suppression throughout the entire field of view, typical elements of brachial plexuses with a slightly increased signal (arrowed); and (c) sciatic nerves in T2-Dixon mode, a coronal projection: homogenous fat suppression, normal sciatic nerves with a slightly increased MR signal (arrowed).
The required fat suppression can be performed by spectrally selective fat suppression (FatSat) in T2-weighted spin echo sequences with high contrast, nearly no pulsation artifacts, and reduced magnetic susceptibility artifacts [33]. However, if there are metal structures in the field of vision, this technique should be avoided. The main disadvantage is poor fat suppression away from the center of the field of view or inhomogeneous fat suppression along the curves of the body [25].
Short-TI inversion recovery (STIR, where TI is the inversion time in milliseconds) provides excellent homogeneous fat suppression at various levels of magnetic induction and field homogeneity, but it is nonselective (it suppresses signal from all, not only fat, tissues with short T1). It cannot be used following intravenous contrast enhancement (as this sequence sums T2 and T1 contrast, providing only T2-weighted images). In many circumstances, it is susceptible to pulsation artifacts, erroneous nerve signal augmentation due to increased signal from intraneural fluid, and a low signal-to-noise ratio. Therefore, this sequence is more commonly used for plexus visualization, where spectrally selective fat suppression is ineffective for a variety of reasons, including the presence of metal in the field of view, using various modifications, such as shorter echo time (30–40 ms), a greater number of echo times, and a wider transmission frequency (400–500 Hz/Px).
T2 SPAIR (T2-weighted SPectral Attenuated Inversion Recovery), a combination of FatSat and STIR techniques, is the best sequence for extremity MR neurography because it suppresses fat signals similarly to STIR, but it is more selective in the center and periphery of the field of view with higher SNR and fewer pulsation artifacts. The signal from a normal nerve usually is isointense to the signal from skeletal muscle on T2-SPAIR images. Depending on the user’s preferences, weak and strong contrast types are available, with the weak giving higher signal homogeneity and the strong providing greater isointensity of the nerve signal. The main disadvantage of this sequence is the possibility of poor fat suppression in some edge slices, particularly along the scanning area’s boundary, and the inability to use this technique with low-field devices and significant magnetic field inhomogeneity. Although T2-SPAIR is less sensitive to metal artifacts than frequency-selective fat suppression sequences, the STIR sequence should still be used if the metal is in the scanning area.
The Dixon approach achieves optimal fat suppression, but image quality may be reduced from the central scanning area [25]. Thomas Dixon proposed this approach in 1984 [34]. The chemical shift effect was predicated on a difference in the resonance frequency of fat and water protons. A two-echo sequence is used. Water and fat signals occur in-phase and antiphase during the first and second echo times. Dixon demonstrated that additional images can be computationally created based on these images with simply the water signal (dixonW) and the fat signal (dixonF). The fat signal is suppressed in dixonW images. These images are commonly used in clinical practice because they provide homogeneous fat suppression, and the only notable artifact is a fat–water exchange caused by magnetic field inhomogeneity, which occurs frequently around the coil coverage area’s border [35]. However, due to the long scanning time, the use of this neurography technique is limited to 2D imaging.
On T2-weighted images, a diseased peripheral nerve has a larger diameter and higher signal intensity, which is more visible with various fat suppression approaches. The structure and size of the nerve can be evaluated in comparison with surrounding nerves and a vascular fascicle, which can be used as an internal reference [36]. For the sciatic nerve, for example, an increase in the nerve diameter to vessel diameter ratio of >0.89 can be considered abnormal [37]. In addition to the nerve signal, special attention should be paid to signals from the adjacent muscles; increased intensity of such signals is an imaging correlate of denervation changes that can be noticed 5 days after nerve injury [3].
Some potential problems should be noted while interpreting MR neurography data. First, most healthy volunteers (approximately 60%) have locally increased signal intensity at sites of physiological constriction on fluid-sensitive images; hence, in addition to signal changes, it is necessary to evaluate their prevalence and swelling and thickening of the corresponding nerve. Another important factor is a so-called “magic angle” effect, which means the increased intensity of MR signal from structures located at the angle of 55° relative to the direction of the magnetic field B0 in short TE sequences (<32 ms) [3].
Increased signal on T2-weighted images is a sensitive but nonspecific marker of peripheral nerve injury that cannot be quantified and requires careful interpretation considering diverse patterns of lesions, including their magnitude and changes in diameter.
NS-RADS SCALE
There are guidelines for using the MRI-based Neuropathy Score Reporting and Data System (NS-RADS) scale [39]. According to the authors, it can be used for more standardized measurement of the type and severity of peripheral neuropathy using medical history and examination data. This scale is used to assess the severity of traumatic injuries (NS-RADS I1–5), compression syndromes (NS-RADS E1–3), neoplasms (NS-RADS N1–4), diffuse neuropathies (NS-RADS D1, 2), and postoperative conditions (NS-RADS PI1–3). Furthermore, it can be used in the setting of denervation changes in regional muscles (NS-RADS M0–3), insufficient data to assess changes (NS-RADS 0), and absence of changes or minor clinically insignificant changes (NS-RADS U). Furthermore, NS-RADS NOS (not otherwise specified) is a separate category for patients with clinically suspected neuropathy and contentious medical history or examination data. This classification is expected to provide the standardized assessment of MRI changes in peripheral nerves and improve interdisciplinary collaboration for optimal clinical and research outcomes. The original publication contains a more complete classification, but the authors believe that following active implementation, new categories and sections may be established to optimize its use in clinical practice [40].
CONCLUSION
Despite the possibility of greater metal artifacts, 3-T tomographs are preferable for peripheral nerve visualization due to their higher S/N ratio. It is proposed that minimum MRI protocol requirements be established. Three-dimensional sequences are indicated for plexus imaging, whereas 2D images with a small slice thickness (2.5–3.5 mm) are appropriate for extremities nerve viewing. It is important to ensure high resolution of evaluated data (0.2–0.8 mm in the scanning plane). The protocol should include fat-suppressed, fluid-sensitive imaging sequences (STIR, T2SPAIR, T2FatSat, and T2Dixon) and T1- and T2-weighted images, with at least one mode with slices perpendicular to the long axis of nerves.
Despite all the difficulties and limitations, MRI remains the highly informative method for peripheral nervous system examination, and it is increasingly being introduced into clinical practice due to its ability both to detect pathological changes in the peripheral nerves and to perform a comprehensive assessment of the surrounding structures, as well as to make a differential diagnosis in some diseases. The use of standard MR neurography techniques is related to increased informative value and wider usage of MRI, beginning with forming a population-based age normative base with a description of nerve signal sizes and characteristics. A detailed description of nerve damage patterns in various disorders is still required.
ADDITIONAL INFORMATION
Funding source. This article was not supported by any external sources of funding.
Competing interests. The authors declare that they have no competing interests.
Authors’ contribution. All authors made a substantial contribution to the conception of the work, acquisition, analysis, interpretation of data for the work, drafting and revising the work, final approval of the version to be published and agree to be accountable for all aspects of the work. S.N. Morozova — search for publications on the topic, manuscript text writing, figures preparation, V.V. Sinkova — search for publications on the topic, figures preparation, D.A. Grishina — scientific consult, manuscript text editing, T.A. Tumilovich — search for publications on the topic, figures preparation, A.O. Chechetkin — scientific consult, manuscript text editing, approval of the final version, M.V. Krotenkova, N.A. Suponeva — the concept of the study, scientific consult, approval of the final version.
About the authors
Sofya N. Morozova
Research Center of Neurology
Author for correspondence.
Email: kulikovasn@gmail.com
ORCID iD: 0000-0002-9093-344X
SPIN-code: 2434-7827
MD, Cand. Sci. (Med.)
Russian Federation, MoscowViktoriya V. Sinkova
Research Center of Neurology
Email: 000564321@mail.ru
ORCID iD: 0000-0003-2285-2725
Russian Federation, Moscow
Darya A. Grishina
Research Center of Neurology
Email: dgrishina82@gmail.com
ORCID iD: 0000-0002-7924-3405
SPIN-code: 6577-1799
MD, Cand. Sci. (Med.)
Russian Federation, MoscowTaisia A. Tumilovich
Research Center of Neurology
Email: tumilovich.taisiya@bk.ru
ORCID iD: 0000-0002-9538-9690
SPIN-code: 2264-9457
Russian Federation, Moscow
Andrey O. Chechetkin
Research Center of Neurology
Email: andreychechetkin@gmail.com
ORCID iD: 0000-0002-8726-8928
SPIN-code: 9394-6995
MD, Dr. Sci. (Med.)
Russian Federation, MoscowMarina V. Krotenkova
Research Center of Neurology
Email: krotenkova_mrt@mail.ru
ORCID iD: 0000-0003-3820-4554
SPIN-code: 9663-8828
MD, Dr. Sci. (Med.)
Russian Federation, MoscowNatalya A. Suponeva
Research Center of Neurology
Email: nasu2709@mail.ru
ORCID iD: 0000-0003-3956-6362
SPIN-code: 3223-6006
MD, Dr. Sci. (Med.), Professor, Corresponding member of the Russian Academy of Sciences
Russian Federation, MoscowReferences
- Hammi C, Yeung B. Neuropathy. [Updated 2022 Oct 15]. In: StatPearls [Internet]. Treasure Island (FL): StatPearls Publishing; 2023. Available from: https://www.ncbi.nlm.nih.gov/books/NBK542220/.
- Chen Y, Haacke EM, Li J. Peripheral nerve magnetic resonance imaging. F1000Research. 2019;(8):1803. doi: 10.12688/f1000research.19695.1
- Kollmer J, Bendszus M. Magnetic resonance neurography: Improved diagnosis of peripheral neuropathies. Neurotherapeutics. 2021;18(4):2368–2383. doi: 10.1007/s13311-021-01166-8
- Thompson PD, Thomas PK. Clinical patterns of peripheral neuropathy. In: Dyck PJ, Thomas PK, editors. Peripheral neuropathy. 4th ed. Elsevier Saunders, Philadelphia: 2005. Р. 1137–1161.
- Piradov MA, Suponeva NA, Grishina DA, Pavlov YeV. Electroneuromyography: Algorithms and recommendations in polyneuropathies. Moscow: Goryachaya liniya-Telecom; 2021. 198 р. (In Russ).
- Li J. Molecular regulators of nerve conduction: Lessons from inherited neuropathies and rodent genetic models. Exp Neurol. 2015;(267):209–218. doi: 10.1016/j.expneurol.2015.03.009
- Chung T, Prasad K, Lloyd TE. Peripheral neuropathy: Clinical and electrophysiological considerations. Neuroimaging Clin N Am. 2014;24(1):49–65. doi: 10.1016/j.nic.2013.03.023
- Dyck PJ, Oviatt KF, Lambert EH. Intensive evaluation of referred unclassified neuropathies yields improved diagnosis. Ann Neurol. 1981;10(3):222–226. doi: 10.1002/ana.410100304
- Stewart JD. Peripheral nerve fascicles: Anatomy and clinical relevance. Muscle Nerve. 2003;28(5):525–541. doi: 10.1002/mus.10454
- Mansurova AV, Chechetkin AO, Suponeva NA, et al. Possibilities of ultrasound in the diagnosis and differential diagnosis of amyotrophic lateral sclerosis: A literature review. Neuromuscular diseases. 2022;12(1):21–28. (In Russ). doi: 10.17650/2222-8721-2022-12-1-21-28
- Gasparotti R, Padua L, Briani C, Lauria G. New technolo-gies for the assessment of neuropathies. Nat Rev Neurol. 2017;13(4):203–216. doi: 10.1038/nrneurol.2017.31
- Deshmukh S, Sun K, Komarraju A, et al. Peripheral nerve imaging: Magnetic resonance and ultrasound correlation. Magn Reson Imaging Clin N Am. 2023;31(2):181–191. doi: 10.1016/j.mric.2023.01.003
- Ohana M, Moser T, Moussaouï A, et al. Current and future imaging of the peripheral nervous system. Diagn Interv Imaging. 2014;95(1):17–26. doi: 10.1016/j.diii.2013.05.008
- Muller I, Miguel M, Bong DA, et al. The peripheral nerves: Update on Ultrasound and magnetic resonance imaging. Clin Exp Rheumatol. 2018; 36(Suppl 114):145–58.
- Aggarwal A, Chhabra A. Magnetic resonance neurography: Is it so complicated that it needs a touch of genius? Eur Radiol. 2022;32(6):3912–3914. doi: 10.1007/s00330-021-08525-1
- Singh T, Kliot M. Imaging of peripheral nerve tumors. Neurosurg Focus. 2007;22(6):E6. doi: 10.3171/foc.2007.22.6.7
- Filler AG, Howe FA, Hayes CE, et al. Magnetic resonance neurography. Lancet. 1993;341(8846):659–661. doi: 10.1016/0140-6736(93)90422-d
- Howe FA, Filler AG, Bell BA, Griffiths JR. Magnetic resonance neurography. Magn Reson Med. 1992;28(2):328–338. doi: 10.1002/mrm.1910280215
- Mazal AT, Faramarzalian A, Samet JD, et al. MR neurography of the brachial plexus in adult and pediatric age groups: Evolution, recent advances, and future directions. Exp Rev Med Devices. 2020;17(2):111–122. doi: 10.1080/17434440.2020.1719830
- Joint Task Force of the EFNS and the PNS. European Federation of Neurological Societies/Peripheral Nerve Society guideline on management of multifocal motor neuropathy. Report of a joint task force of the European Federation of Neurological Societies and the Peripheral Nerve Society--first revision. J Peripher Nerv Syst. 2010;15(4):295–301. doi: 10.1111/j.1529-8027.2010.00290.x
- Van den Bergh PY, van Doorn PA, Hadden RD, et al. European Academy of Neurology/Peripheral Nerve Society guideline on diagnosis and treatment of chronic inflammatory demyelinating polyradiculoneuropathy: Report of a joint Task Force-Second revision. J Peripher Nerv Syst. 2021;26(3):242–268. doi: 10.1111/jns.12455
- Chhabra A, Madhuranthakam AJ, Andreisek G. Magnetic resonance neurography: Current perspectives and literature review. Eur Radiol. 2018;28(2):698–707. doi: 10.1007/s00330-017-4976-8
- Szaro P, McGrath A, Ciszek B, Geijer M. Magnetic resonance imaging of the brachial plexus. Part 1: Anatomical considerations, magnetic resonance techniques, and non-traumatic lesions. Eur J Radiol. 2022;20(9):100392. doi: 10.1016/j.ejro.2021.100392
- Holzgrefe RE, Wagner ER, Singer AD, Daly ChA. Imaging of the peripheral nerve: Concepts and future direction of magnetic resonance neurography and ultrasound. Curr Concepts. 2019;44(12):1066–1079. doi: 10.1016/j.jhsa.2019.06.021
- Chhabra A, Flammang A, Padua A, et al. Magnetic resonance neurography: Technical considerations. Neuroimaging Clin N Am. 2014;24(1):67–78. doi: 10.1016/j.nic.2013.03.032
- Chalian M, Chhabra A. Top-10 tips for getting started with magnetic resonance neurography. Semin Musculoskelet Radiol. 2019;23(4):347–360. doi: 10.1055/s-0039-1677727
- Sneag DB, Queler S. Technological advancements in magnetic resonance neurography. Curr Neurol Neurosci Rep. 2019;19(10):75. doi: 10.1007/s11910-019-0996-x
- Thakkar RS, Del Grande F, Thawait GK, et al. Spectrum of high-resolution MRI findings in diabetic neuropathy. AJR Am J Roentgenol. 2012;199(2):407–412. doi: 10.2214/AJR.11.7893
- Thawait SK, Chaudhry V, Thawait GK, et al. Highresolution MR neurography of diffuse peripheral nerve lesions. AJNR Am J Neuroradiol. 2011;32(8):1365–1372. doi: 10.3174/ajnr.A2257
- McDonald CM, Carter GT, Fritz RC, et al. Magnetic resonance imaging of denervated muscle: Comparison to electromyography. Muscle Nerve. 2000;23(9):1431–1434. doi: 10.1002/1097-4598(200009)23:9<1431::aid-mus16>3.0.co;2-p
- Stoll G, Bendszus M, Perez J, Pham M. Magnetic resonance imaging of the peripheral nervous system. J Neurol. 2009;256(7):1043–1051. doi: 10.1007/s00415-009-5064-z
- Chhabra A, Thawait GK, Soldatos T, et al. High-resolution 3T MR neurography of the brachial plexus and its branches, with emphasis on 3D imaging. AJNR Am J Neuroradiol. 2013;34(3):486–497. doi: 10.3174/ajnr.A3287
- Bischoff C, Kollmer J, Schulte-Mattler W. State-of-the-art diagnosis of peripheral nerve trauma: Clinical examination, electrodiagnostic, and imaging. In: Haaster-Talini KA, Antoniadis G, editors. Modern concepts of peripheral nerve repair. 1st ed. Springer International Publishing; 2017. doi: 10.1007/978-3-319-52319-4_2
- Dixon WT. Simple proton spectroscopic imaging. Radiology. 1984;153(1):189–194. doi: 10.1148/radiology.153.1.6089263
- Grimm A, Meyer H, Nickel MD, et al. Evaluation of 2-point, 3-point, and 6-point Dixon magnetic resonance imaging with flexible echo timing for muscle fat quantification. Eur J Radiol. 2018;(103):57–64. doi: 10.1016/j.ejrad.2018.04.011
- Subhawong TK, Wang KC, Thawait SK, et al. High-resolution imaging of tunnels by magnetic resonance neurography. Skeletal Radiol. 2012;41(1):15–31. doi: 10.1007/s00256-011-1143-1
- Chhabra A, Chalian M, Soldatos T, et al. 3-T high-resolution MR neurography of sciatic neuropathy. Am J Roentgenol. 2012;198(4):357–364. doi: 10.2214/AJR.11.6981
- Kollmer J, Bendszus M, Pham M. MR neurography: Diagnostic imaging in the PNS. Clin Neuroradiol. 2015;25(Suppl 2):283–289. doi: 10.1007/s00062-015-0412-0
- Chhabra A, Deshmukh SD, Lutz AM, et al. Neuropathy score reporting and data system: A reporting guideline for MRI of peripheral neuropathy with a multicenter validation study. AJR Am J Roentgenol. 2022;219(2):279–291. doi: 10.2214/AJR.22.27422
- Chhabra A, Deshmukh SD, Lutz AM, et al. Neuropathy score reporting and data system (NS-RADS): MRI reporting guideline of peripheral neuropathy explained and reviewed. Skeletal Radiol. 2022;51(10):1909–1922. doi: 10.1007/s00256-022-04061-1
Supplementary files

