








 Email this article


Fundamentals of dual-energy computed tomography and its emerging applications in bladder cancer
- Authors: Masino F.1, Eusebi L.2, Montatore M.1, Muscatella G.1, Gifuni R.1, Ferrara V.2, Marcellini M.3, Guglielmi G.1,4,5
-
Affiliations:
- Foggia University School of Medicine
- “Carlo Urbani” Hospital
- “Senigallia” Hospital
- “Dimiccoli” Hospital
- “IRCCS Casa Sollievo della Sofferenza” Hospital
- Issue: Vol 5, No 3 (2024)
- Pages: 551-566
- Section: Reviews
- Submitted: 29.12.2023
- Accepted: 06.02.2024
- Published: 04.12.2024
- URL: https://jdigitaldiagnostics.com/DD/article/view/625405
- DOI: https://doi.org/10.17816/DD625405
- ID: 625405

Cite item
Full Text

Abstract
Nowadays, computed tomography urography and multiparametric magnetic resonance are the most often used imaging techniques in patients with bladder cancer; however, dual-energy computed tomography is making its way into the oncological field. This narrative review article aimed to show the fundamentals of dual-energy computed tomography by outlining its physical principles, techniques, protocols, and postprocessing images to help those who used this cutting-edge technology as the first approach to fully understand its emerging applications in the evaluation of bladder cancer, a field yet to be explored. In particular, we discuss the usefulness of dual-energy computed tomography by focusing on the main images obtained, such as the iodine map, comparing them to the images obtained with conventional computed tomography scans.
Dual-energy computed tomography applications may be beneficial for bladder cancer diagnosis, staging, and treatment planning. Nevertheless, its application is limited to its availability in healthcare structures and the training of healthcare personnel who can perform and interpret the scans correctly.
Full Text
РАК МОЧЕВОГО ПУЗЫРЯ
Рак мочевого пузыря (РМП) занимает десятое по распространённости место в мире среди злокачественных новообразований. Среди опухолей мочеполовой системы РМП занимает второе место по распространённости, уступая раку предстательной железы [1]. Он чаще встречается у представителей европеоидной расы, пациентов пожилого возраста (пик заболеваемости приходится на людей в возрасте 70 лет) и у мужчин (соотношение заболеваемости у мужчин и женщин 4:1). Уротелиальный рак — наиболее распространённый вид РМП, на который приходится 90% всех случаев заболевания [2]. Он развивается из клеток эпителия мочевыводящих путей. Для данной опухоли характерно наличие нескольких очагов и высокая частота рецидивов [3, 4].
Факторами риска развития РМП являются табакокурение, употребление некоторых растительных средств, воздействие ароматических аминов (в частности, бета-нафтиламина, бензедрина и 4-аминобифенила) в связи с профессиональной деятельностью, лучевая терапия органов малого таза в анамнезе, хронические заболевания мочевого пузыря и шистосомоз [5, 6].
Первичной жалобой, требующей безотлагательного обследования, является обычно так называемая безболезненная гематурия. Речь идёт о наличии крови в моче (не сопровождающемся какими-либо иными симптомами), которую можно увидеть невооружённым глазом (макроскопическая гематурия) или обнаруживать только с помощью микроскопа (микроскопическая гематурия).
По мере поражения мочевыделительной системы возникают также другие симптомы: учащённое мочеиспускание, боль в малом тазу, инфекции мочевыводящих путей. В случае локализации опухоли в области отверстия устья мочеточника пациент может жаловаться на боль в боковой части поясницы, которая возникает вследствие обструкции мочеточника и последующего развития гидронефроза. Позднее наблюдаются системные проявления, такие как утомляемость, лихорадка и уменьшение массы тела, которые указывают на метастатическое прогрессирование заболевания.
Морфологическая классификация РМП основана на степени поражения мышечного слоя [7]. Немышечно-инвазивный РМП характеризуется поверхностным поражением, как правило, в области почечных сосочков. Встречается у 70–80% пациентов с РМП. Поверхностный характер обусловлен возникновением из гиперпластичных эпителиальных клеток и локализацией в пределах слизистой оболочки и собственной пластинки. Высокую степень злокачественности немышечно-инвазивного РМП отмечают приблизительно в 33% случаев (злокачественная карцинома in situ). Такая опухоль плоская по форме, быстро проникает в мышечный слой и даёт метастазы [8, 9].
Мышечно-инвазивный РМП встречается в 20–30% случаев и не сопровождается поражением почечных сосочков. Опухоль быстро прорастает в глубокий мышечный слой, на всю толщу стенки мочевого пузыря и за её пределы, поэтому такая опухоль считается агрессивной и имеет неблагоприятный прогноз. Поражение лимфатических узлов начинается на местнорегионарном уровне, после чего опухолевые клетки проникают в общие подвздошные, паракавальные и пояснично-аортальные лимфатические узлы. В результате отдалённого распространения с кровью чаще всего поражаются лёгкие, кости, печень и надпочечники [10, 11].
Для стадирования РМП в настоящее время используется 8-я редакция классификационной системы TNM, которая предлагает разделять РМП на следующие группы по степени тяжести [12, 13] (табл. 1 и табл. 2).
Таблица 1. Стадирование по TNM (8-я редакция)
Степень | Описание |
T | |
Ta | Неинвазивная папиллярная опухоль |
Tis | Неинвазивная «плоская» опухоль in situ |
T1 | Прорастание через собственную пластинку слизистой оболочки в субэпителиальные соединительные ткани |
T2 | Прорастание в мышечный слой |
T2a — прорастание только в поверхностный мышечный слой T2b — прорастание в глубокий мышечный слой | |
T3 | Прорастание в паравезикальную клетчатку |
T3a — микроскопическое прорастание за пределы мочевого пузыря T3b — прорастание в наружную половину мышечного слоя | |
T4 | Прямое прорастание в прилегающие структуры |
T4a — предстательная железа, семенные пузырьки, матка, свод влагалища T4b — стенка таза и (или) брюшная стенка | |
N | |
N0 | Отсутствие поражения лимфатических узлов |
N1 | Поражение одного лимфатического узла в области малого таза (запирательного, внутреннего и наружного подвздошного или крестцового) |
N2 | Поражение нескольких лимфатических узлов в области малого таза |
N3 | Метастаз в общий подвздошный лимфатический узел |
M | |
M0 | Отсутствие метастазов |
M1a | Нерегионарное поражение лимфатических узлов |
M1b | Прочие отдалённые метастазы |
Таблица 2. Группы рака мочевого пузыря по стадиям
Стадия | |
0 | Ta или Tis, N0 и M0 |
I | T1, N0 и M0 |
II | T2 (a или b), N0 и M0 |
III | T3 (a или b) или T4a, N0 и M0 |
IV | T4b, любое N, любое M любое T, N1–3 и любое M |
ДВУХЭНЕРГЕТИЧЕСКАЯ КОМПЬЮТЕРНАЯ ТОМОГРАФИЯ
Основные принципы
Двухэнергетическая компьютерная томография (ДЭКТ) — это инновационная технология получения различных наборов данных визуализации посредством одновременного использования двух рентгеновских трубок с разным напряжением. Базовые параметры этого метода не отличаются от таковых у стандартных рентгенографических методов исследования: мощность рентгеновской трубки, эффект Комптона и фотоэлектрический эффект и характеристики материала.
В основе принципа действия ДЭКТ лежит предположение о том, что разные материалы по-разному реагируют на воздействие рентгеновского излучения с разным уровнем энергии рентгеновских фотонов. Таким образом, с помощью двух разных воздействий у каждого материала получают соответствующие энергозависимые профили затухания.
Разграничение тканей на стандартной компьютерной томографии (КТ) и ДЭКТ основано на затухании фотонов по мере их прохождения через ткань и взаимодействия с нею. Затухание, выражаемое в единицах Хаунсфилда (HU), зависит от свойств материала, а именно его зарядового числа (Z) и электронной плотности. Затухание обратно пропорционально энергии излучения, генерируемого трубкой (кВп): при использовании фотонов с низким уровнем энергии затухание более выраженное, чем при использовании фотонов с высоким уровнем энергии [14].
При уровне энергии, используемом в медицинской визуализации, взаимодействие между фотонами и тканями организма зависит от фотоэлектрического эффекта и эффекта Комптона. Фотоэлектрический эффект зависит от энергии и связан с зарядовым числом (Z), а эффект Комптона не зависит от энергии и связан с плотностью (массой) электронов.
У ткани или контрастного материала в исследуемой области есть спектральные особенности, то есть в зависимости от энергии фотонов они активируются по-разному. Благодаря этому феномену ДЭКТ позволяет различать материалы.
Таким образом, воздействию фотоэлектрического эффекта подвергаются в основном материалы с высоким числом Z, например, йод (Z=53). Такое взаимодействие приводит к усилению затухания при низком уровне энергии (80–100 кВп), что обеспечивает спектральный контраст с биологическими тканями при проведении ДЭКТ. Для сравнения, эффект Комптона наблюдается в основном у материалов с низким значением Z, например, у кислорода, азота, водорода и углерода (во всех случаях Z составляет от 1 до 8). На кальций оба эффекта воздействуют почти одинаково [15].
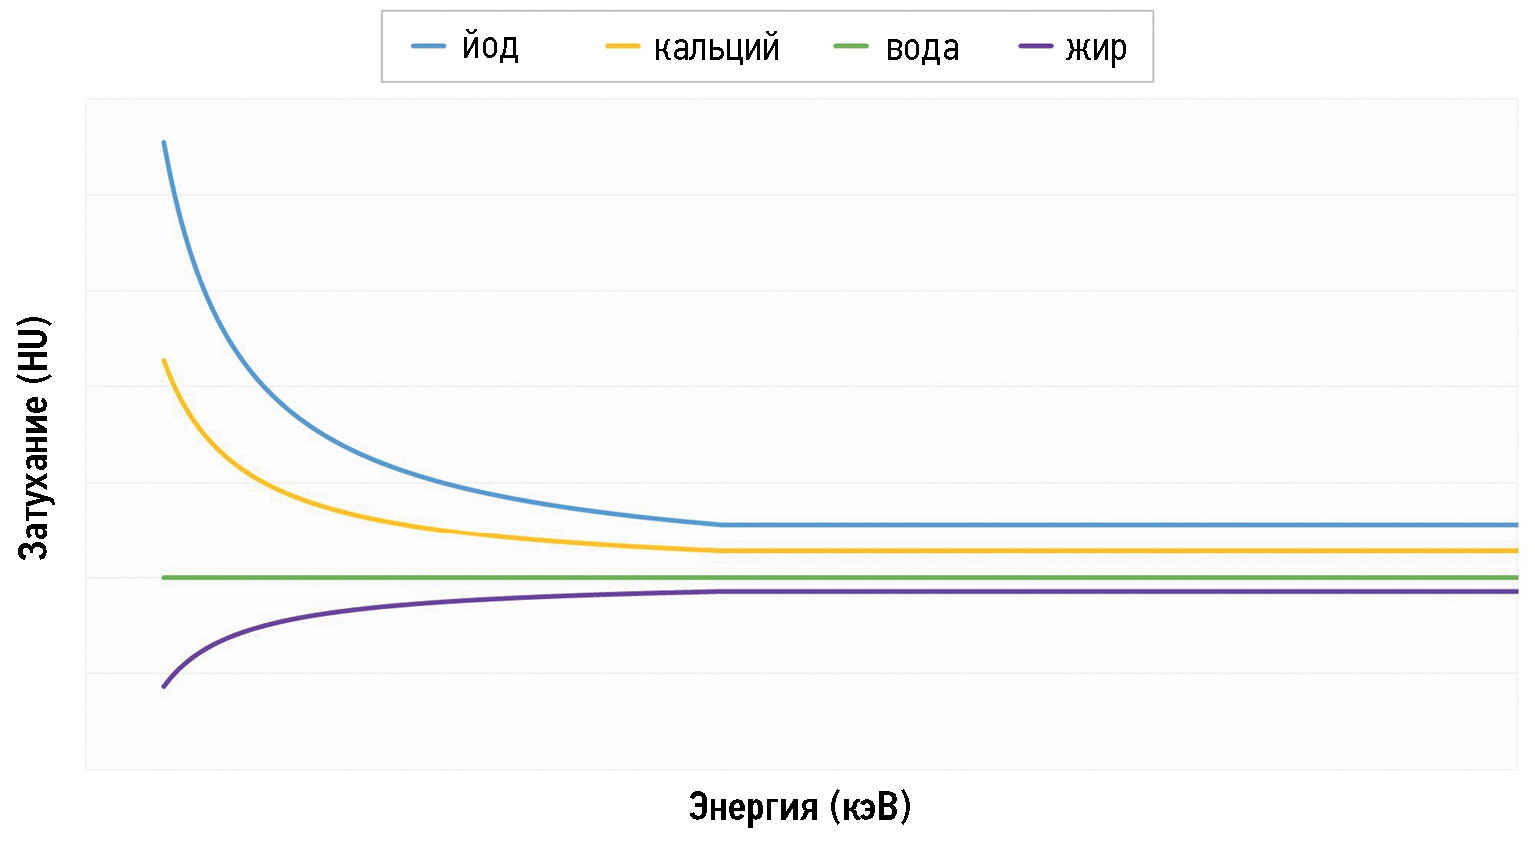
Таким образом, у каждого материала есть своё значение Z и особый профиль поглощения фотонов (затухания), который меняется в зависимости от энергии фотонов. Например, у воды линия прямая, а у жира значения затухания снижаются по мере приближения к наименьшему уровню энергии (40–45 кэВ) (рис. 1).

Рис. 1. Профили затухания йода, кальция, воды и жира при разных диапазонах энергии. При низком уровне энергии йод имеет наиболее высокое значение затухания, а жир — наиболее низкое. Значения затухания воды при разных уровнях энергии не меняются. Для кальция вариации значений менее выраженные.
Таким образом, результаты для каждой ткани определяют с учётом всех указанных переменных каждого компонента, таких как вода или жир. Например, мягкие ткани состоят из материалов с сопоставимыми значениями Z, поэтому заметных различий в затухании не наблюдается [14].
Методика
Для проведения исследований в случаях, представленных в настоящей обзорной статье, использовали томограф с одним источником рентгеновского излучения и быстрым переключением напряжения — Revolution CT GSI Xtream (GE Healthcare, США) (табл. 3).
Таблица 3. Основные характеристики системы для двухэнергетической компьютерной томографии с одним источником рентгеновского излучения
ДЭКТ с одним источником рентгеновского излучения и быстрым переключением напряжения | |
 | Схема ДЭКТ с одним источником рентгеновского излучения данного типа. Жёлтым отмечен спектр низкой энергии, голубым — спектр высокой энергии. Детектор может быстро регистрировать информацию при воздействии двух уровней энергии |
Перспективная методика | |
Одна рентгеновская трубка с переключением между высоким (140 кВп) и низким (80 кВп) уровнем энергии за 0,25 мс в пределах одного поворота гентри | |
Реконструкция в проекционном пространстве с реконструкцией изображений на основе технологии глубокого обучения | |
Полная область сканирования | |
Небольшое снижение временного разрешения из-за вращения трубки | |
Коллимация GSI 80 мм; область сканирования GSI 50 см; нейтральная доза, tumor index — индекс размера опухолевого поражения шаг HyperDrive 1,531:1; 256 детекторов; максимальное покрытие 16 см | |
Использовали многофазный протокол сбора данных. На первом этапе выполнили исследование брюшной полости и малого таза без контрастирования. Затем пациентам внутривенно ввели фуросемид для более качественной визуализации чашечно-лоханочной системы и мочеточников, а также для более равномерного контрастирования мочевого пузыря.
Выделяют следующие фазы после введения контрастного вещества:
- кортико-медуллярная фаза — через 30–40 с после введения;
- нефрографическая фаза — через 90–110 с после введения;
- пиелографическая фаза;
- поздняя экскреторная фаза через 8–12 мин после внутривенного введения (табл. 4).
Таблица 4. Схема протокола подготовки, фаз сбор данных, увеличения продольной площади по оси Z и направления сканирования
Протокол | ||
Подготовка | Фуросемид: 10–20 мг перед кортико-медуллярной фазой | |
Фазы сбора данных | Базальная | |
Кортико-медуллярная | Исследуемая область (ROI): брюшная аорта над чревным стволом; порог затухания: 150 HU; через 18–20 секунд с момента достижения порога контрастного усиления после болюсного введения контрастного вещества | |
Нефрографическая | Через 80–100 с после внутривенного введения контрастного вещества | |
Экскреторная | Через 7–10 мин после внутривенного введения контрастного вещества | |
Увеличение продольной площади по оси Z | От купола диафрагмы до лонного сочленения для базальной и нефрографической фаз От верхнего полюса почки до лонного сочленения для кортико-медуллярной и экскреторной фаз | |
Направление сканирования | Краниокаудальное | |
Каждая фаза имеет своё назначение.
- В фазу без контрастирования можно обнаружить кальцинаты и кальцинированные конкременты, которые выглядят как гиперденсивные очаги, а также кровотечения с характерной для крови плотностью. Перед введением контрастного вещества целесообразно также измерить коэффициенты затухания уротелиальных образований [16–18].
- Кортико-медуллярная фаза позволяет выявить сосудистые изменения или наличие очагов контрастирования в артериях.
- Нефрографическая фаза в наибольшей степени подходит для выявления очагов в почках [19–20].
- В рамках пиелографической фазы можно выявить изменения уротелия при растяжении по наличию очагов контрастирования в мочевыделительной системе, начиная с чашечно-лоханочной системы, с прохождением через мочеточники до мочевого пузыря [21–24].
На основании результатов КТ можно выполнить трёхмерную реконструкцию мочевыводящих путей. Такой подход, сформировавшийся в результате эволюции классической урографии, позволяет выполнить полную визуализацию мочевыделительной системы, получить информацию о морфологических характеристиках и функциональности почек и мочевыводящих путей, выявить пороки развития, конкременты или солидные новообразования. Трёхмерная реконструкция показана для установления причины гематурии, выявления опухоли почки, мочеточника или мочевого пузыря, или для выявления и локализации камня при наличии соответствующего болевого синдрома (рис. 2).

Рис. 2. Трёхмерная реконструкция по данным компьютерной томографической урографии с контрастированием: a — с визуализацией; b — без визуализации костей на фоне в коронарной плоскости.
Реконструкции
В отличие от традиционной КТ с одним источником рентгеновского излучения, позволяющей получить один набор изображений, ДЭКТ позволяет реконструировать несколько типов изображений. Ниже перечислены те, которые используются для диагностики РМП [25].
Виртуальные монохромные изображения
Виртуальные монохромные изображения (Virtual monochrome images, VMC) — это изображения, полученные в результате постобработки снимков с использованием комплексного алгоритма, обеспечивающего качество на уровне стандартных полихроматических снимков КТ с одним источником излучения, но с более достоверными значениями затухания.
Использование двух источников излучения позволяет отразить в виртуальных монохромных изображениях разные свойства. При низком уровне энергии обеспечивается более высокая контрастность смежных структур, что можно объяснить высоким значением затухания пучка в области контрастирования йодом. Такой способ упрощает исследование пристенных очагов. Вместе с тем при высоком уровне энергии наблюдается меньше шума и артефактов и менее выраженный контраст между смежными структурами.
При использовании двух источников излучения с разным напряжением (высоким и низким уровнем энергии) для виртуальных монохромных изображений получают спектральную кривую затухания в зависимости от уровня энергии. Кривую используют для оценки свойств с целью более точного описания очага.
При получении виртуальных монохромных изображений при разных уровнях энергии строят спектральную кривую затухания в зависимости от уровня энергии, которая позволяет более качественно исследовать очаг [14].
Виртуальные неконтрастные изображения (без отображения контрастирования йодом)
Виртуальные неконтрастные изображения (Virtual noncontrast images, VNC) — это обработанные изображения, полученные посредством отделения определённых материалов с целью создания изображений «без контрастирования» на основании изображений, полученных после введения контрастного вещества [26, 27]. Таким образом, такое постобработанное изображение потенциально может заменить стандартный первый снимок, получаемый без введения контрастного вещества в ходе КТ [28, 29].
С изображения удаляют сигнал от йода, и поэтому обозначают, что изображение представлено «без отображения контрастирования йодом». Это значит, что все участки поглощения йода, выявленные в ходе многофазной ДЭКТ, установлены и подавлены для получения виртуального неконтрастного изображения.
Главное преимущество этой уникальной и эксклюзивной методики визуализации, применимой только к ДЭКТ, состоит в том, что пациентам не требуется проходить несколько сканирований, что позволяет снизить общую дозу облучения.
Кроме того, таким образом можно существенно сократить время и усилия, требуемые для проведения последующих исследований [30].
Йодная карта
С помощью сложного алгоритма можно выбрать материал с определёнными характеристиками затухания и получить изображение определённого материала. Например, выбрав материал с высоким уровнем затухания, такой как йод, можно получить изображение участков контрастирования йодом — йодную карту [31].
В отличие от изображения с удалёнными участками контрастирования йодом, на йодной карте отображаются все участки поглощения йода. Таким образом, такой вид постобработанного изображения позволяет подсчитать количество йода в миллиграммах на миллилитр (мг/мл) [14, 32].
Затем данные о плотности йода, как правило, накладываются в виде цветной карты на стандартные КТ-снимки, при этом значения вокселя представляют концентрацию йода в мг/мл. Йодная карта позволяет разграничить сосудистые и несосудистые очаги. Количественное определение йода и его нормализация по количеству йода, присутствующего в аорте, позволяет косвенно измерить степень васкуляризации исследуемой области. Оптимальные пороговые значения для различения сосудистых и несосудистых поражений зависят от типа платформы ДЭКТ: 0,5 мг/мл для dsDE; 1,3 мг/мл для rsDE и 0,5 мг/мл для dlDE [31, 33].
Более эффективным представляется количественное определение йода в нефрографической фазе и его нормализация по количеству йода в аорте:
Атомная карта (Zeff)
Карта фактических зарядовых чисел применяется для количественной оценки различий материалов и измерения различий в затухании в зависимости от уровня энергии (рис. 3) [34].

Рис. 3. Атомная карта (Zeff) с гистограммой.
РАК МОЧЕВОГО ПУЗЫРЯ И ДВУХЭНЕРГЕТИЧЕСКАЯ КОМПЬЮТЕРНАЯ ТОМОГРАФИЯ
В онкологической практике визуализация с помощью КТ имеет большое значение по причине доступности метода, быстрого сбора данных и высокого качества изображения. При обследовании пациентов с подозрением на РМП наиболее часто используют КТ для выявления опухоли и предотвращения неправильной диагностики других потенциальных причин гематурии. Именно КТ представляет собой золотой стандарт диагностики для стадирования опухоли и оценки местно-регионарных и отдалённых метастазов [7, 35].
Основными ограничениями КТ являются высокая доза облучения (25–35 мЗв) и невозможность разграничить мышечно-инвазивный и немышечно-инвазивный РМП [6]. Необходимость повторения фаз для сбора данных, особенно у пациентов с онкологическими заболеваниями, которым может потребоваться контрольная КТ, сопряжена с чрезмерно высоким воздействием ионизирующего излучения и частым введением йодсодержащих контрастных веществ. Помимо опасений о дозе облучения, необходимо также учитывать риск развития нефропатии у пациентов с заболеваниями почек при прохождении многочисленных контрольных КТ-исследований. По этой причине всё больше внимания привлекают новые технологии, такие как ДЭКТ, которые можно применять для диагностики и мониторинга опухолей и снизить нагрузку не только на пациентов, но и на рентгенологов [36].
ДЭКТ — это новый метод медицинской визуализации, который, благодаря техническим характеристикам, особенно подходит для диагностики онкологических заболеваний. Очевидные преимущества ДЭКТ заключаются в возможности установления характеристик очага, обнаружения опухолей и сокращения числа дополнительных визуализирующих исследований и биопсий. Это возможно благодаря применению технологии постобработки с реконструкцией, а именно получению виртуальных неконтрастных изображений, виртуальных монохромных изображений, спектральных кривых и йодных карт.
Виртуальные неконтрастные изображения не имеют существенных отличий от изображений, полученных без введения контрастного вещества, при этом с их помощью можно обнаружить конкременты, кальцинаты и кровотечения, гиперденсивные на КТ-снимках без контрастирования. Более того, важно измерять коэффициенты затухания новообразования для сравнения его значения со значением на снимках, полученных после введения контраста [37, 38].
Спектральная кривая благодаря её свойствам подходит для более точного описания очага. Например, кривая, построенная для узлового образования стенки мочевого, идёт к максимуму при более низком уровне энергии в кэВ (рис. 4).

Рис. 4. Спектральная кривая позволяет более точно установить характеристики материала, поскольку кривые затухания у разных материалов отличаются. С помощью воздействия при разных уровнях энергии можно дифференцировать материалы на основании различий в коэффициентах затухания одного материала.
Появилась возможность для более точного исследования границ очагов: с помощью виртуальных монохромных изображений, получаемых при низком уровне энергии, достигается более благоприятное соотношение контраста и шума. Например, на таких изображениях предполагаемый очаг опухоли выделяется на фоне прилежащих тканей. Очаг с соответствующим гипо- и гиперконтрастированием лучше просматривается, чем контрастированная паренхима на фоне. Если принять во внимание возможность количественного измерения степени контрастирования, использование виртуальных монохромных изображений позволяет лучше выявлять и описывать очаги (рис. 5) [39, 40].

Рис. 5. Виртуальные монохромные изображения при уровне энергии 40 кэВ: a — с более эффективным контрастированием при более высоком уровне шума; b — при уровне энергии 140 кэВ контрастность ниже, меньше артефактов и шума.
В исследовании M. Nakagawa и соавт. было установлено, что ДЭКТ позволяет более эффективно по сравнению со стандартной КТ-урографией выявлять небольшие и слабоконтрастные очаги РМП: различия в степени контрастирования РМП и стенки мочевого пузыря становятся более очевидны на виртуальных монохромных изображениях [41].
При исследовании участков поглощения йода и его отсутствия можно использовать йодные карты для определения количества йода в каждом вокселе, чтобы таким образом обнаружить небольшие участки контрастного усиления для установления характеристик очага. Йодные карты также можно использовать для разграничения сосудистых и несосудистых поражений, тоже с целью установления характеристик очага. В этом случае в нефрографической фазе количественное определение йода следует нормализовать по содержанию йода в аорте. Порог концентрации йода ≥1,0 мг/мл демонстрирует высокую чувствительность (92%) для уротелиальных опухолей. Высокая специфичность (92%) исследования может быть достигнута при пороговом значении ≥3,0 мг/мл (рис. 6–8) [42].

Рис. 6. Пациент с гематурией на фоне антикоагулянтной терапии, с подозрением на тромб: a — йодная карта в аксиальной плоскости, полученная в артериальную фазу (Av=26,79 соответствует концентрации йода в мг/мл при пороговом значении 1,3 мг/мл). Согласно данным компьютерной томографии, очаг содержит йод, поэтому есть все основания подозревать в нём новообразования мочевого пузыря; b — йодная карта с наложением цвета, полученная в артериальную фазу компьютерной томографии в аксиальной плоскости, содержание гидроксиапатита не выявлено; c — йодная карта с наложением цвета, полученная в артериальную фазу компьютерной томографии в коронарной плоскости, содержание гидроксиапатита не выявлено.

Рис. 7. Пациент с гематурией с подозрением на опухолевый очаг в мочевом пузыре: a — при проведении компьютерной томографии в аксиальной плоскости наблюдается умеренное утолщение стенки мочевого пузыря со значительной концентрацией йода, что с высокой вероятностью указывает на присутствие очага. AV отражает концентрацию йода в мг/мл, которая составляет 6,7 и 16,48 мг/мл для участков, отмеченных синим кругом и выделенных жёлтым (пороговое значение 1,3 мг/мл) соответственно; b, c — спектральная кривая, которая позволяет описать материалы по различиям в кривой затухания.

Рис. 8. Компьютерная томография в нефрографической фазе. Её целесообразно использовать для количественной оценки концентрации йода и её нормализации по содержанию йода в аорте: a — йодная карта с демонстрацией нескольких твёрдых узелков на стенке мочевого пузыря; b — йодная карта с наложением цвета для более качественной визуализации очагов. Среднее значение на очаг составляет 1,5 мг/мл, значение Av подвздошной артерии — 8,4 мг/мл, а пороговое значение — 1,3 мг/мл.
Таким образом, можно утверждать, что йодная карта, полученная с помощью ДЭКТ, информативнее стандартной КТ, поскольку позволяет установить количество йода в очаге и более надёжно измерить степень контрастирования очага. Её можно использовать в качестве суррогатного маркёра поглощения контрастного вещества тканями, учитывая, что на неё не влияет собственное затухание ткани, и она не требует оценки истинно контрастированного изображения до и после введения контрастного вещества. Во втором случае для описания очага необходимо выполнить несколько сканирований после введения контраста, включая сканирование артерий и портальной вены [14].
ДЭКТ целесообразно использовать для стадирования опухолей. Таким образом, йодные карты позволяют оценить распространённость опухоли на местном уровне, чтобы оценить инфильтрацию всех слоёв стенки мочевого пузыря, и на отдалённом уровне, чтобы оценить поражение лимфатических узлов и наличие метастазов.
Кроме того, ДЭКТ можно использовать и для планирования лечения. Ключевое значение для выбора лечения имеет оценка степени распространённости РМП и наличия связей с сосудистыми структурами. Для этой цели наилучшим образом подходят виртуальные монохромные изображения при низком уровне энергии, поскольку они более наглядно отображают связь между очагом и окружающими сосудистыми структурами. Кроме того, поскольку возможно получить изотропные изображения, на основании данных ДЭКТ можно также реконструировать проекцию максимальной интенсивности, которая поможет хирургам найти сосудистый ориентир [14, 43].
Дополнительные преимущества ДЭКТ можно использовать для диагностики сопутствующих опухолям заболеваний, например, почечной колики, и для обнаружения связанных с опухолью патологий, в частности тромбоэмболии лёгочной артерии или ишемии кишечника [44, 45].
Тем не менее необходимо учитывать существующие ограничения ДЭКТ, а именно — отсутствие специального оборудования и технологий во многих медицинских учреждениях, что исключает возможность сравнения результатов, полученных в одном и в разных отделениях, особенно при последующем наблюдении. Кроме того, сканирование и описание изображений требуют наличия квалифицированного и обученного персонала с соответствующим высоким уровнем подготовки.
ЗАКЛЮЧЕНИЕ
ДЭКТ — это передовая технология, с помощью которой можно получить разные наборы данных посредством одновременного использования двух рентгеновских трубок при двух разных уровнях энергии, более высоком и более низком.
Недавнее начало применения ДЭКТ в онкологической практике поднимает качество диагностики на новый уровень. Так, у пациентов с подозрением на РМП постобработка изображений делает исследование более информативным с точки зрения выявления и описания очага по сравнению со стандартной КТ-урографией.
Таким образом, ДЭКТ напоминает КТ с точки зрения процесса получения изображения, однако предлагает при этом уникальный подход к постобработке изображений с возможностью получать изображения другого типа (VNC, VMC), спектральные кривые и йодные карты. Благодаря большей информативности использование изображений разных типов позволит рентгенологам ставить более точный диагноз РМП и сокращать длительность диагностики в интересах пациентов.
ДЭКТ можно применять не только для выявления потенциально злокачественных очагов, но и для стадирования и планирования лечения таких опухолей, как РМП. В частности, сочетание низкоэнергетических изображений и йодных карт поможет более точно описать и охарактеризовать первичные и вторичные очаги. Тем не менее проведение ДЭКТ возможно не во всех медицинских учреждениях и требует наличия обученных медицинских специалистов.
ДОПОЛНИТЕЛЬНАЯ ИНФОРМАЦИЯ
Источник финансирования. Авторы заявляют об отсутствии внешнего финансирования при проведении поисково-аналитической работы.
Конфликт интересов. Авторы декларируют отсутствие явных и потенциальных конфликтов интересов, связанных с публикацией настоящей статьи.
Вклад авторов. Все авторы подтверждают соответствие своего авторства международным критериям ICMJE (все авторы внесли существенный вклад в разработку концепции, проведение поисково-аналитической работы и подготовку статьи, прочли и одобрили финальную версию перед публикацией). Наибольший вклад распределён следующим образом: L. Eusebi, F. Masino, G. Guglielmi — концепция и дизайн работы; V. Ferrara, M. Marcellini, L. Eusebi — сборт литературных данных; F. Masino, L. Eusebi, M. Montatore, G. Muscatella, R. Gifuni — написание и редактирование рукописи.
ADDITIONAL INFORMATION
Funding source. This article was not supported by any external sources of funding.
Competing interests. The authors declare that they have no competing interests.
Authors’ contribution. All authors made a substantial contribution to the conception of the work, acquisition, analysis, interpretation of data for the work, drafting and revising the work, final approval of the version to be published and agree to be accountable for all aspects of the work. L. Eusebi, F. Masino, G. Guglielmi — work conception and design; V. Ferrara, M. Marcellini, L. Eusebi — data collection; F. Masino, L. Eusebi, M. Montatore, G. Muscatella, R. Gifuni — manuscript writing and editing.
About the authors
Federica Masino
Foggia University School of Medicine
Email: federicamasino@gmail.com
ORCID iD: 0009-0004-4289-3289
MD
Italy, FoggiaLaura Eusebi
“Carlo Urbani” Hospital
Email: lauraeu@virgilio.it
ORCID iD: 0000-0002-4172-5126
MD
Italy, JesiManuela Montatore
Foggia University School of Medicine
Email: manuela.montatore@unifg.it
ORCID iD: 0009-0002-1526-5047
MD
Italy, FoggiaGianmichele Muscatella
Foggia University School of Medicine
Email: muscatella94@gmail.com
ORCID iD: 0009-0004-3535-5802
MD
Italy, FoggiaRossella Gifuni
Foggia University School of Medicine
Email: rossella.gifuni@unifg.it
ORCID iD: 0009-0009-9679-3861
MD
Italy, FoggiaVincenzo Ferrara
“Carlo Urbani” Hospital
Email: vincenzoferrara4@gmail.com
ORCID iD: 0000-0001-8625-4308
MD
Italy, JesiMassimo Marcellini
“Senigallia” Hospital
Email: massimo.marcellini@sanita.marche.it
ORCID iD: 0000-0002-5281-7819
MD
Italy, SenigalliaGiuseppe Guglielmi
Foggia University School of Medicine; “Dimiccoli” Hospital; “IRCCS Casa Sollievo della Sofferenza” Hospital
Author for correspondence.
Email: giuseppe.guglielmi@unifg.it
ORCID iD: 0000-0002-4325-8330
MD, Professor
Italy, Foggia; Barletta; San Giovanni RotondoReferences
- Sung H, Ferlay J, Siegel RL, et al. Global Cancer Statistics 2020: GLOBOCAN Estimates of Incidence and Mortality Worldwide for 36 Cancers in 185 Countries. CA Cancer J Clin. 2021;71(3):209–249. doi: 10.3322/caac.21660
- Siegel RL, Miller KD, Jemal A. Cancer statistics, 2020. CA Cancer J Clin. 2020;70(1):7–30. doi: 10.3322/caac.21590
- Soria F, Shariat SF, Lerner SP, et al. Epidemiology, diagnosis, preoperative evaluation and prognostic assessment of upper-tract urothelial carcinoma (UTUC). World J Urol. 2017;35(3):379–387. doi: 10.1007/s00345-016-1928-x
- Verma S, Rajesh A, Prasad SR, et al. Urinary bladder cancer: role of MR imaging. Radiographics. 2012;32(2):371–387. doi: 10.1148/rg.322115125
- Rouprêt M, Babjuk M, Burger M, et al. European Association of Urology Guidelines on Upper Urinary Tract Urothelial Carcinoma: 2020 Update. Eur Urol. 2021;79(1):62–79. doi: 10.1016/j.eururo.2020.05.042
- Farling KB. Bladder cancer: Risk factors, diagnosis, and management. Nurse Pract. 2017;42(3):26–33. doi: 10.1097/01.NPR.0000512251.61454.5c
- Eusebi L, Masino F, Gifuni R, et al. Role of multiparametric-MRI in bladder cancer. Current Radiology Reports. 2023;11(5):69–80. doi: 10.1007/s40134-023-00412-5
- Babjuk M, Burger M, Capoun O, et al. European Association of Urology Guidelines on Non-muscle-invasive Bladder Cancer (Ta, T1, and Carcinoma in Situ). Eur Urol. 2022;81(1):75–94. doi: 10.1016/j.eururo.2021.08.010
- Babjuk M, Böhle A, Burger M, et al. EAU Guidelines on Non-Muscle-invasive Urothelial Carcinoma of the Bladder: Update 2016. Eur Urol. 2017;71(3):447–461. doi: 10.1016/j.eururo.2016.05.041
- Kamoun A, de Reyniès A, Allory Y, et al. A consensus molecular classification of muscle-invasive bladder cancer. European Urology. 2020;77(4):420–433. doi: 10.1016/j.eururo.2019.09.006
- Wang Z, Shang Y, Luan T, et al. Evaluation of the value of the VI-rads scoring system in assessing muscle infiltration by bladder cancer. Cancer Imaging. 2020;20(1). doi: 10.1186/s40644-020-00304-3
- Husband JE, Olliff JF, Williams MP, Heron CW, Cherryman GR. Bladder cancer: staging with CT and MR imaging. Radiology. 1989;173(2):435–440. doi: 10.1148/radiology.173.2.2798874
- Wong VK, Ganeshan D, Jensen CT, Devine CE. Imaging and management of Bladder Cancer. Cancers. 2021;13(6):1396. doi: 10.3390/cancers13061396
- Agrawal MD, Pinho DF, Kulkarni NM, et al. Oncologic applications of dual-energy CT in the abdomen. Radiographics. 2014;34(3):589–612. doi: 10.1148/rg.343135041
- Johnson T. Dual-Energy CT: General Principles. AJR Am J Roentgenol. 2012;199(5 Suppl):S3–S8. doi: 10.2214/AJR.12.9116
- Potenta SE, D’Agostino R, Sternberg KM, Tatsumi K, Perusse K. CT Urography for Evaluation of the Ureter. Radiogr Rev Publ Radiol Soc N Am Inc. 2015;35:709–726. doi: 10.1148/rg.2015140209
- Kawashima A, Vrtiska TJ, Leroy AJ, et al. CT Urography. Radiogr Rev Publ Radiol Soc N Am Inc. 2004;24:S35–S54. doi: 10.1148/rg.24si045513
- Caoili EM, Cohan RH. CT urography in evaluation of urothelial tumors of the kidney. Abdom. Radiol. 2016;41:1100–1107. doi: 10.1007/s00261-016-0695-x
- Cheng K, Cassidy F, Aganovic L, Taddonio M, Vahdat N. CT urography: How to optimize the technique. Abdom. Radiol. 2019;44:3786–3799. doi: 10.1007/s00261-019-02111-2
- Silverman SG, Leyendecker JR, Amis ES. What Is the Current Role of CT Urography and MR Urography in the Evaluation of the Urinary Tract? Radiology. 2009;250:309–323. doi: 10.1148/radiol.2502080534
- Shampain KL, Cohan RH, Caoili EM, Davenport MS, Ellis JH. Benign diseases of the urinary tract at CT and CT urography. Abdom. Radiol. 2019;44:3811–3826. doi: 10.1007/s00261-019-02108-x
- Metser U, Goldstein MA, Chawla TP, et al. Detection of urothelial tumors: Comparison of urothelial phase with excretory phase CT urography — a prospective study. Radiology. 2012;264(1):110–118. doi: 10.1148/radiol.12111623
- Kim JK, Park SY, Ahn HJ, Kim CS, Cho KS. Bladder cancer: analysis of multi-detector row helical CT enhancement pattern and accuracy in tumor detection and perivesical staging. Radiology. 2004;231(3):725–731. doi: 10.1148/radiol.2313021253
- Saksena MA, Dahl DM, Harisinghani MG. New imaging modalities in bladder cancer. World J Urol. 2006;24(5):473–480. doi: 10.1007/s00345-006-0118-7
- Parakh A, Lennartz S, An C, et al. Dual-Energy CT Images: Pearls and Pitfalls. Radiographics. 2021;41(1):98–119. doi: 10.1148/rg.2021200102
- Sauter A, Muenzel D, Dangelmaier J, et al. Dual-Layer Spectral Computed Tomography: Virtual Non-Contrast in Comparison to True Non-Contrast Images. Eur J Radiol. 2018;104:108–114. doi: 10.1016/j.ejrad.2018.05.007
- Ananthakrishnan L, Rajiah P, Ahn R, et al. Spectral Detector CT-Derived Virtual Non-Contrast Images: Comparison of Attenuation Values with Unenhanced CT. Abdom Radiol (NY). 2017;42(3):702–709. doi: 10.1007/s00261-016-1036-9
- Fornaro J, Leschka S, Hibbeln D, et al. Dual- and multi-energy CT: approach to functional imaging. Insights Imaging. 2011;2(2):149–159. doi: 10.1007/s13244-010-0057-0
- Silva AC, Morse BG, Hara AK, et al. Dual-energy (spectral) CT: applications in abdominal imaging. Radiographics. 2011;31(4):1031–1050. doi: 10.1148/rg.314105159
- Salameh JP, McInnes MDF, McGrath TA, Salameh G, Schieda N. Diagnostic Accuracy of Dual-Energy CT for Evaluation of Renal Masses: Systematic Review and Meta-Analysis. AJR Am J Roentgenol. 2019;212(4):W100–W105. doi: 10.2214/AJR.18.20527
- Ascenti G, Mazziotti S, Mileto A, et al. Dual-source dual-energy CT evaluation of complex cystic renal masses. AJR Am J Roentgenol. 2012;199(5):1026–1034. doi: 10.2214/AJR.11.7711
- Mileto A, Nelson RC, Samei E, et al. Impact of dual-energy multi-detector row CT with virtual monochromatic imaging on renal cyst pseudoenhancement: in vitro and in vivo study. Radiology. 2014;272(3):767–776. doi: 10.1148/radiol.14132856
- Chandarana H, Megibow AJ, Cohen BA, et al. Iodine quantification with dual-energy CT: phantom study and preliminary experience with renal masses. AJR Am J Roentgenol. 2011;196(6):W693–W700. doi: 10.2214/AJR.10.5541
- Tatsugami F, Higaki T, Nakamura Y, Honda Y, Awai K. Dual-energy CT: minimal essentials for radiologists. Jpn J Radiol. 2022;40(6):547–559. doi: 10.1007/s11604-021-01233-2
- Nolte-Ernsting C, Cowan N. Understanding multislice CT urography techniques: Many roads lead to Rome. Eur Radiol. 2006;16(12):2670–2686. doi: 10.1007/s00330-006-0386-z
- Ge X, Lan ZK, Chen J, Zhu SY. Effectiveness of contrast-enhanced ultrasound for detecting the staging and grading of bladder cancer: a systematic review and meta-analysis. Med Ultrason. 2021;23(1):29–35. doi: 10.11152/mu-2730
- Takahashi N, Vrtiska TJ, Kawashima A, et al. Detectability of urinary stones on virtual nonenhanced images generated at pyelographic-phase dual-energy CT. Radiology. 2010;256(1):184–190. doi: 10.1148/radiol.10091411
- Mangold S, Thomas C, Fenchel M, et al. Virtual nonenhanced dual-energy CT urography with tin-filter technology: determinants of detection of urinary calculi in the renal collecting system. Radiology. 2012;264(1):119–125. doi: 10.1148/radiol.12110851
- Coursey CA, Nelson RC, Boll DT, et al. Dual-energy multidetector CT: how does it work, what can it tell us, and when can we use it in abdominopelvic imaging? Radiographics. 2010;30(4):1037–1055. doi: 10.1148/rg.304095175
- Graser A, Johnson TR, Hecht EM, et al. Dual-energy CT in patients suspected of having renal masses: can virtual nonenhanced images replace true nonenhanced images? Radiology. 2009;252(2):433–440. doi: 10.1148/radiol.2522080557
- Nakagawa M, Naiki T, Naiki-Ito A, et al. Usefulness of advanced monoenergetic reconstruction technique in dual-energy computed tomography for detecting bladder cancer. Jpn J Radiol. 2022;40(2):177–183. doi: 10.1007/s11604-021-01195-5
- Patel BN, Vernuccio F, Meyer M, et al. Dual-Energy CT Material Density Iodine Quantification for Distinguishing Vascular From Nonvascular Renal Lesions: Normalization Reduces Intermanufacturer Threshold Variability. AJR Am J Roentgenol. 2019;212(2):366–376. doi: 10.2214/AJR.18.20115
- De Cecco CN, Darnell A, Rengo M, et al. Dual-energy CT: oncologic applications. AJR Am J Roentgenol. 2012;199(5S):S98–S105. doi: 10.2214/AJR.12.9207
- Vrtiska TJ, Takahashi N, Fletcher JG, et al. Genitourinary applications of dual-energy CT. AJR Am J Roentgenol. 2010;194(6):1434–1442. doi: 10.2214/AJR.10.4404
- Montatore M, Muscatella G, Eusebi L, et al. Current status on new technique and protocol in urinary stone disease. Current Radiology Reports. 2023;11:161–176. doi: 10.1007/s40134-023-00420-5
Supplementary files


