








 Email this article


Surface-based morphometry of the cerebral cortex in cognitive impairments of varying severity in patients with age-related cerebral small vessel disease
- Authors: Kremneva E.I.1, Dobrynina L.A.1, Shamtieva K.V.1, Trubitsyna V.V.1, Gadzhieva Z.S.1, Makarova A.G.1, Tsypushtanova M.M.1, Krotenkova M.V.1
-
Affiliations:
- Research Center of Neurology
- Issue: Vol 5, No 3 (2024)
- Pages: 436-449
- Section: Original Study Articles
- Submitted: 26.04.2024
- Accepted: 19.06.2024
- Published: 04.12.2024
- URL: https://jdigitaldiagnostics.com/DD/article/view/631162
- DOI: https://doi.org/10.17816/DD631162
- ID: 631162

Cite item
Full Text

Abstract
BACKGROUND: Analysis of structural magnetic resonance images is essential to assessing the main substrate of cognitive impairment in sporadic age-related cerebral small vessel disease, accounting for up to 45% of all dementia cases. Variations in the results of magnetic resonance morphometry applied in cerebral small vessel disease require extensive studies and clinical correlation.
AIM: To assess cerebral atrophy features in cognitive impairment in patients with cerebral small vessel disease by surface-based morphometry.
MATERIALS AND METHODS: A prospective study was conducted to assess patients with cerebral small vessel disease and cognitive impairments of varying severity levels (subjective, moderate, and dementia) and sex- and age-matched groups of volunteers. The assessment included the analysis of signs of cerebral small vessel disease based on the results of magnetic resonance imaging with the computation of general cerebral small vessel disease index and processing T1 multiplanar reconstruction images by surface-based morphometry to quantify general and regional brain parameters, including the thickness of the cerebral cortex.
RESULTS: The main group consisted of 173 patients with cerebral small vessel disease, whereas the control group included 47 healthy volunteers. As the severity of brain structural changes and cognitive impairments increased, a significant (p <0.05) decrease in the cortical thickness of certain regions following a similar pattern was reported, particularly in the cingulate gyri, mainly their posterior sections; medial and middle sections of the frontal lobes, various areas of the insular cortex, and temporoparietal areas, particularly the supramarginal gyri. The brain volumes (overall, gray matter, and white matter volumes) in cerebral small vessel disease were significantly different only in controls but not between patients with cognitive impairment of different severity levels. The hyperintense white matter volume was significantly different between patients with dementia and moderate cognitive impairment, dementia, and subjective cognitive impairment (p <0.0001).
CONCLUSIONS: The results confirm secondary/mixed atrophy in cerebral small vessel disease. The clarification of the severity level of cognitive impairment in cerebral small vessel disease based on atrophy data is limited by the wide variety of regions with significant cortical thinning. Thus, the quantification of the cortex can only be a supplementary method in predicting cerebral small vessel disease progression.
Full Text
Список аббревиатур и сокращений
МРТ ― магнитно-резонансная томография
FWE (family-wise error) ― ошибка первого рода
MPR (Multi-Planar Reconstruction) ― мультипланарная реконструкция
MP-RAGE (Magnetization Prepared RApid Gradient Echo Imaging) ― быстрое получение данных с намагничиванием с помощью градиентного эха
MP2RAGE (Magnetization Prepared 2 Rapid Acquisition Gradient Echoes) ― подготовленная с помощью 3D-намагничивания (2) последовательность быстрого градиентного эха
STRIVE (STandards for ReportIng Vascular changes on nEuroimaging) ― стандарты описания сосудистых изменений при нейровизуализации
ROI (region of interest) ― область интереса
ОБОСНОВАНИЕ
Возраст-зависимая церебральная микроангиопатия ― комплекс нейровизуализационно-морфологических и ассоциированных с ними клинических проявлений, обусловленных поражением мелких (диаметром до 500 мкм) церебральных сосудов [1]. Данное заболевание играет важную роль в развитии деменции (до 45% новых регистрируемых случаев деменции ежегодно), инвалидизации и смертности пациентов (до 20–25% всех инсультов) [2]. При этом сохраняются пробелы в понимании механизмов развития и прогрессирования церебральной микроангиопатии, что и обусловливает рост интереса к ней, особенно в сфере нейровизуализации, поскольку технический прогресс и широкая распространённость магнитно-резонансной томографии (МРТ) позволяет изучать структурные и функциональные аспекты изменений головного мозга при церебральной микроангиопатии in vivo.
Большинство МРТ-исследований церебральной микроангиопатии посвящено изучению таких её проявлений, как гиперинтенсивность белого вещества, малые недавние инфаркты и лакуны, микрокровоизлияния, периваскулярные пространства [3], и меньшее внимание уделяется атрофии вещества головного мозга. В контексте рассматриваемой сосудистой патологии предполагается, что атрофия и истончение коры развиваются вследствие гибели нейронов, разряжения и уменьшения в объёме белого вещества на фоне артериолосклероза, венозного коллагеноза с развитием вторичных дегенеративных изменений [4]. Допускается также, что атрофия коры у пациентов с церебральной микроангиопатией может являться следствием её первичного повреждения при развитии микроинфарктов с последующей валлеровской дегенерацией аксонов и демиелинизацией [5]. Наиболее же вероятно, что для большинства случаев церебральной микроангиопатии оба процесса первичного и вторичного поражения коры сосуществуют [6].
Анализ структурных МРТ-изображений играет ключевую роль в оценке основного субстрата когнитивных расстройств при церебральной микроангиопатии, и в частности деменции. Качественная оценка атрофии по степени расширения ликворных пространств и вентрикулокраниальным индексам субъективна, тогда как количественные методы ― волюмометрия и морфометрия ― позволяют получать точные оператор-независимые значения. При этом оцениваются как общий объём мозга, серого и белого вещества, так и изменения отдельных регионов и структур.
Феномен общей атрофии мозга при церебральной микроангиопатии может быть использован как маркер прогрессирования заболевания и ухудшения когнитивных функций [7] даже при учёте естественных возрастных изменений [8]. Для оценки региональных изменений часто используется метод морфометрии, под которым в нейровизуализации в настоящее время понимается количественная оценка серого вещества головного мозга (с возможностью анализа отдельных извилин/ядер и их сегментов) при помощи автоматических методов обработки изотропных T1-взвешенных изображений (Т1-ВИ) высокого разрешения (стандартный размер воксела ― 1×1×1 мм, режимы типа MPR, MP-RAGE, MP2RAGE) и двух наиболее распространённых методов ― повоксельной морфометрии (voxel-based morphometry) [9] и поверхностной морфометрии (surface-based morphometry) [10]. Метод повоксельной морфометрии направлен на оценку объёма серого вещества (как коры, так и подкорковых структур), однако большинство программ, работающих с повоксельной морфометрией, рассчитаны и на выделение объёмов белого вещества и цереброспинальной жидкости. Метод поверхностной морфометрии направлен на выделение и оценку поверхности коры, в частности её объём, толщину, площадь и прочие количественные параметры [11].
В исследованиях церебральной микроангиопатии фигурирует довольно большое число разных областей, атрофия которых, по данным методов морфометрии, коррелирует с тяжестью когнитивных расстройств: кора лобных и височных долей [7]; затылочные доли и гиппокампы; нижние теменные дольки; левая прецентральная извилина и правая нижняя лобная извилина [12]; левая верхняя теменная долька и левый островок [13]; передние отделы поясной извилины справа; правый клин; островок билатерально и правая средняя височная извилина [14].
Разнообразие результатов применения МР-морфометрии при церебральной микроангиопатии с учётом особенностей самого метода требует дальнейших исследований и сопоставления с клиническими данными. Перспективным представляется поиск регионов коры, наиболее тесно связанных с общей тяжестью поражения головного мозга при церебральной микроангиопатии, а также с характерными для данного заболевания когнитивными расстройствами в плане дифференциальной диагностики с нейродегенеративными и смешанными формами деменции.
Цель исследования ― оценка особенностей атрофии головного мозга при когнитивных нарушениях у пациентов со спорадической возрастзависимой церебральной микроангиопатией с помощью метода поверхностной морфометрии, как более аккуратного для группового анализа по сравнению с методом повоксельной морфометрии в условиях выраженной атрофии [15].
МАТЕРИАЛЫ И МЕТОДЫ
Дизайн исследования
Проведено экспериментальное одноцентровое одномоментное выборочное контролируемое исследование.
Критерии соответствия
Критерии включения (основная группа): возраст от 46 до 75 лет; изменения на МРТ, соответствующие признакам STRIVE для церебральной микроангиопатии [3]; когнитивные жалобы (снижение памяти, концентрации, внимания и др.).
Критерии невключения (основная группа): выраженное снижение когнитивных функций, которое затрудняет участие в исследовании и/или их развитие вследствие болезни Альцгеймера; прочие причины церебральной микроангиопатии (воспалительные, токсические, тромбофилические, системные, генетические); тяжёлая мигрень в анамнезе; другая причина инсульта и сопутствующая патология головного мозга, кроме церебральной микроангиопатии, а также атеросклеротическое поражение экстра- или интракраниальных артерий со стенозом >50%; супратенториальные инфаркты >15 мм в диаметре; тяжёлая соматическая патология; противопоказания для проведения МРТ-исследования.
Критерии включения (группа контроля): здоровые добровольцы без патологии головного мозга по данным клинического и нейровизуализационного обследований, без тяжёлой соматической патологии и с отсутствием противопоказаний для проведения МРТ.
Условия проведения
Исследование проведено в федеральном государственном бюджетном научном учреждении «Научный центр неврологии» на базе отдела лучевой диагностики и 3-го неврологического отделения.
Продолжительность исследования
Исследование проводилось в период с 2016 по 2022 год.
Описание медицинского вмешательства
Клиническое обследование всех участников включало сбор анамнеза, оценку основных клинических сосудистых факторов риска, общий осмотр и оценку соматического, неврологического и когнитивного статуса. Тяжесть когнитивных расстройств определяли при помощи Монреальской когнитивной шкалы (Montreal Cognitive Assessment, МоСа) с учётом независимости в повседневной жизни, с выделением групп пациентов с субъективными когнитивными расстройствами: когнитивные жалобы (MоCA ≥26); умеренные когнитивные расстройства (МоCA <26; независимость в повседневной жизни); деменция (МоCA <26, утрата независимости в повседневной жизни).
МРТ головного мозга проводилась на томографе c величиной магнитной индукции 3 Тесла Siemens Magnetom Verio (Siemens AG, Erlargen, Германия) на 8-канальной головной катушке. Протокол сканирования включал режимы Т2-ВИ (аксиальная плоскость, толщина среза 5 мм), 3D-T2FLAIR (сагиттальная плоскость, толщина среза 1 мм), SWI (аксиальная плоскость, толщина 1,2 мм), диффузионно-взвешенные изображения (аксиальная плоскость, толщина среза 5 мм) для оценки основных признаков структурного поражения мозга при церебральной микроангиопатии, а также режим 3D T1-градиентное эхо (T1 MPR) в сагиттальной плоскости с толщиной 1 мм для проведения последующей морфометрии (основные параметры режима: TR ― 1900 мс, TE ― 2,47 мс, 176 срезов, поле обзора 250×250 мм, матрица 256×246 пикселей).
У всех пациентов проводилась качественная оценка МРТ-признаков церебральной микроангиопатии по данным стандартной МРТ головного мозга по критериям STRIVE [3] в программе для работы с медицинскими изображениями eFilm Workstation 4.2.2 (IBM Watson Health, США) c последующим расчётом общего индекса церебральной микроангиопатии по суммарному наличию следующих признаков [16]: гиперинтенсивность белого вещества степени Фазекас 2 или 3 (Fazekas), наличие 1 или более микрокровоизлияний, наличие 1 или более лакун, наличие периваскулярных пространств в подкорковых структурах диаметром от 2 мм и больше. Таким образом, общий индекс церебральной микроангиопатии имел четырёхбалльную градацию, где 0 ― отсутствие указанных параметров признаков, 4 ― наличие всех четырёх признаков с указанными параметрами.
Для получения данных волюмометрии и морфометрии исходные данные обследуемых (3D Т1-ВИ) проходили предобработку с применением программы CAT12 [17] на базе пакета SPM12. Первый шаг включал сегментацию (разделение) исходных 3D T1-ВИ на серое, белое вещество и цереброспинальную жидкость, а также выделение сетки поверхности полушарий большого мозга (surface mesh) с созданием файлов поверхности головного мозга c оценкой толщины коры. Для каждого субъекта формировался отчёт с указанием объёмов каждого из компартментов (отдельно ― для гиперинтенсивности белого вещества), а также интракраниального объёма, по которому в дальнейшем происходило нормирование указанных объёмов для предотвращения влияния межполовых различий (волюмометрия основных интракраниальных компонентов). Затем полученные поверхности корегистрировались с шаблоном FreeSurfer FsAverage template (https://surfer.nmr.mgh.harvard.edu/fswiki/FsAverage) с дальнейшим сглаживанием при помощи кернеля с ядром 15×15×15 мм для группового анализа с оценкой изменений толщины коры. Кроме того, в процессе получения файлов поверхности полушарий большого мозга автоматически проводился ROI-анализ с вычислением толщины коры отдельных областей полушарий большого мозга по Desikan-Killiany-40 атласу [18]. Результаты поверхностной морфометрии были представлены в программе CAT12 в виде 3D-реконструкций поверхности головного мозга, где цветной шкалой кодировались зоны статистически значимых различий толщины коры между группами сравнения (анализ FWE при p <0,05 с поправкой на множественные сравнения). Для расчёта объёмов гиперинтенсивности белого вещества и боковых желудочков использовали файлы гиперинтенсивности белого вещества и цереброспинальной жидкости, полученные на первом шаге препроцессинга, с последующей ручной коррекцией гиперинтенсивности белого вещества и выделением боковых желудочков в программе ITKSnap.
Этическая экспертиза
Исследование одобрено локальным этическим комитетом Федерального государственного бюджетного научного учреждения «Научный центр неврологии» (протокол № 2-4/16 от 17.02.2016) с получением информированного согласия от всех обследуемых.
Статистический анализ
Статистические расчёты для показателей волюмометрии и областей интереса (ROI) проводились в программе SPSS Statistics 26.0 (IBM, США). Применялись двусторонние варианты статистических критериев. Нулевую гипотезу отвергали при p <0,05. Проверка гипотезы о нормальности распределения признаков производилась с использованием критериев Шапиро–Уилка, Колмогорова–Смирнова, а также при помощи построения и оценки частотных гистограмм. Учитывая объём выборки, предпочтение отдавалось параметрическим методам. Количественные показатели с нормальным типом распределения сравнивали при помощи t-критерия Стьюдента или одномерного дисперсионного анализа с последующим внутригрупповым анализом по методу Бонферрони; с отличным от нормального распределения ― при помощи критерия Манна–Уитни или Краскела–Уоллиса с последующим внутригрупповым анализом по методу Манна–Уитни. Для оценки предсказательных возможностей ряда показателей в развитии ожидаемых исходов применялась бинарная логистическая регрессия с последующим ROC-анализом (receiver operator characteristic) и определением площади под кривой (area under the curve, AUC), оптимального порога и его чувствительности и специфичности.
РЕЗУЛЬТАТЫ
Объекты (участники) исследования
Основную группу составили 173 пациента с церебральной микроангиопатией (средний возраст 60,5±7,5 года; 54% женщин) и когнитивными расстройствами различной степени тяжести: с субъективными когнитивными расстройствами ― 54 человека, умеренными когнитивными расстройствами ― 78, деменцией ― 41. Группу контроля составили 47 здоровых добровольцев (средний возраст 56,8±6 лет; 66% женщин).
Группы значимо не отличались по полу (p=0,07) и возрасту (р=0,06), в обеих группах преобладали женщины (66% и 54% соответственно). По степени выраженности гиперинтенсивности белого вещества у пациентов основной группы отмечались изменения стадии Фазекас 1 в 19 случаях, Фазекас 2 ― в 45, Фазекас 3 ― в 109.
Основные результаты исследования
Волюмометрия интракраниальных компонентов мозга в группах церебральной микроангиопатии и контроля
Сопоставительный анализ по основным интракраниальным волюмометрическим показателям для групп с церебральной микроангиопатией и контроля показал значимые различия по всем параметрам (p <0,05) с уменьшением объёма головного мозга и его составляющих ― серого и белого вещества ― в группе церебральной микроангиопатии (p <0,0001) и викарным расширением ликворных пространств (p <0,0001); табл. 1.
Таблица 1. Сопоставительный анализ основных интракраниальных волюмометрических показателей между группами исследования, Me [Q25%; Q75%]
Показатель | Церебральная микроангиопатия n=173 | Контроль n=47 | p |
Гиперинтенсивность белого вещества, см3 | – | – | |
Объём мозга/ИКО | <0,0001 | ||
Серое вещество/ИКО | <0,0001 | ||
Белое вещество/ИКО | <0,0001 | ||
Цереброспинальная жидкость/ИКО | <0,0001 | ||
Объём боковых желудочков, см3 | <0,0001 |
Примечание. ИКО ― интракраниальный объём.
Проводилось сопоставление основных интракраниальных объёмных характеристик между группами пациентов с разной тяжестью когнитивных расстройств. Только показатели цереброспинальной жидкости ― объём боковых желудочков и всей цереброспинальной жидкости ― имели значимые (p <0,0001) различия между группами пациентов с деменцией и субъективными когнитивными расстройствами в виде бóльших значений при деменции. Объём самогó головного мозга (общий объём, серое и белое вещество) при церебральной микроангиопатии имел значимые различия только с контролем, но не между группами пациентов с разной тяжестью когнитивных расстройств. Объём гиперинтенсивности белого вещества значимо различался между группами пациентов с деменцией и умеренными когнитивными расстройствами, деменцией и субъективными когнитивными расстройствами (p <0,0001).
Толщина коры мозга и тяжесть структурного поражения мозга при церебральной микроангиопатии
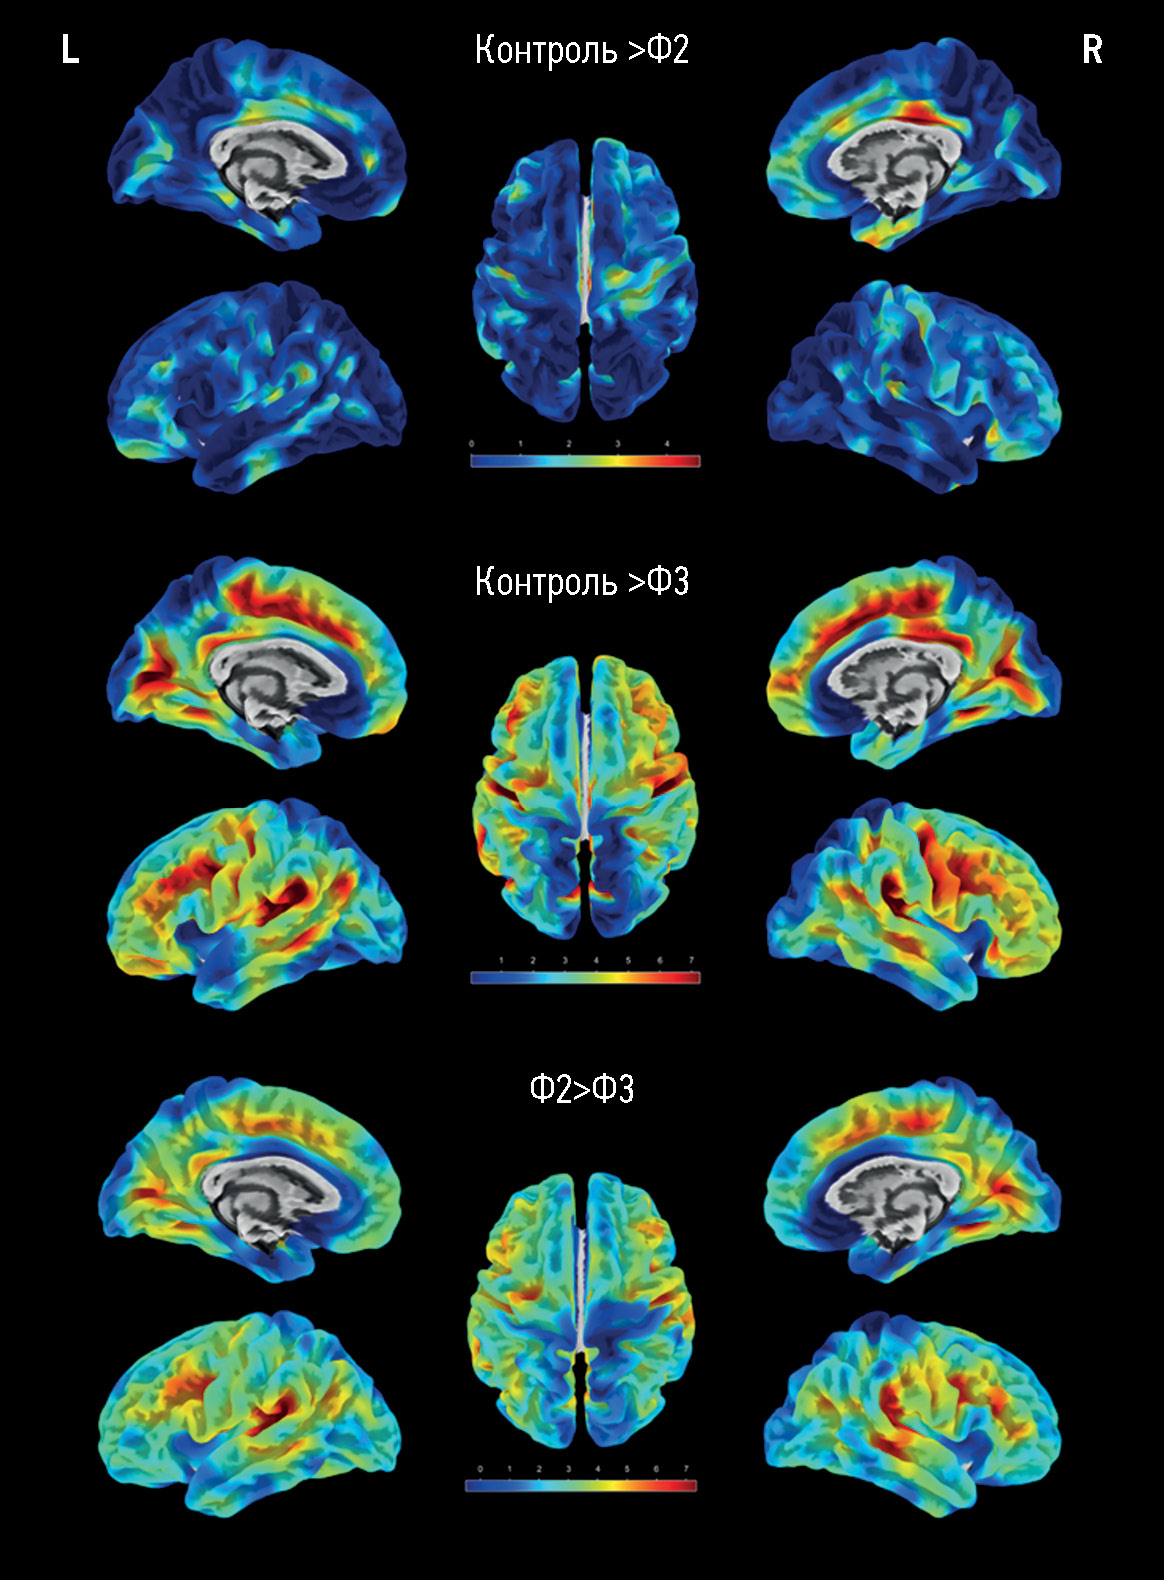
При попарном сравнении изображений групп с разной выраженностью гиперинтенсивности белого вещества значимых (FWE, pcorr <0,05) различий в толщине коры между пациентами группы Фазекас 1 и контролем не было, в группе Фазекас 2 максимально выраженные изменения по сравнению с группой контроля отмечались в центрально-передних и центрально-задних отделах правой поясной извилины (рис. 1). Максимальная разница в толщине коры для групп Фазекас 2 и Фазекас 3 отмечалась в области средних лобных извилин и височно-теменных областях, а также в задних отделах поясных извилин и медиальных отделах лобных долей. Прогрессирование гиперинтенсивности белого вещества до стадии Фазекас 3 по сравнению с группой контроля характеризовалось изменением в более обширных регионах коры (см. рис. 1). Максимальные изменения отмечались в тех же регионах, что и при сравнении групп Фазекас 2 и Фазекас 3 между собой ― в области средних лобных извилин и височно-теменных областях, а также в задних отделах поясных извилин и медиальных отделах лобных долей.

Рис. 1. Визуальное отображение результатов поверхностной морфометрии после статистического анализа изображений групп контроля и Фазекас 2 (первый ряд, Ф2), контроля и Фазекас 3 (средний ряд, Ф3), Фазекас 2 и Фазекас 3 (нижний ряд) в программе CAT12 с выделением красно-жёлтой градации цвета (согласно шкале) регионов со значимо большими различиями толщины коры между группами (FWE, pcorr <0,05). L ― левое полушарие, R ― правое полушарие.
Результаты цифровых измерений толщины отдельных областей коры полушарий большого мозга (ROI-анализ) были проанализированы методом бинарной логистической регрессии для определения наиболее соответствующих общему бремени церебральной микроангиопатии, где за 1 было принято 4 балла, за 0 ― все остальные градации (табл. 2). Уменьшение коры нескольких отделов лобных долей, клина, перешейка поясной извилины справа, парацентральной дольки слева показали наиболее тесную связь с общим баллом церебральной микроангиопатии.
Таблица 2. Регионы коры полушарий большого мозга, уменьшение толщины которых наиболее связано с общим баллом церебральной микроангиопатии (бинарная логистическая регрессия)
Регионы коры | В | р |
Задние отделы средней лобной извилины, L | -5,501 | 0,015 |
Клин, R | 8,201 | 0,000 |
Перешеек поясной извилины, R | -3,079 | 0,011 |
Парацентральная долька, L | -2,874 | 0,027 |
Нижняя лобная извилина, покрышечная часть, R | -11,268 | 0,000 |
Нижняя лобная извилина, орбитальная часть, R | 6,001 | 0,004 |
Примечание. В ― коэффициент, на который нужно умножить параметр предиктора для расчёта линейной функции экспоненты в анализе вероятности развития выраженного поражения головного мозга у пациентов с церебральной микроангиопатией; R ― правое полушарие; L ― левое полушарие большого мозга.
Толщина коры полушарий большого мозга в зависимости от тяжести когнитивных расстройств при церебральной микроангиопатии
При оценке различий в толщине отдельных зон коры между группой контроля и пациентами с когнитивными расстройствами паттерн различий для групп контроль–умеренные когнитивные расстройства и контроль–деменция включал преимущественно медиальную лобную кору, задние отделы поясных извилин, а также средние лобные извилины и височно-теменные области; значимые отличия для групп контроль–субъективные когнитивные расстройства касались пре- и постцентральных извилин, поясной извилины, отдельных регионов лобных долей (p <0,05); рис. 2.

Рис. 2. Результаты поверхностной морфометрии: a ― сравнение толщины коры между пациентами групп контроля и субъективных когнитивных расстройств (субКР) и деменции; b ― внутри группы церебральной микроангиопатии ― между умеренными когнитивными расстройствами (УКР) и деменцией, субъективными (субКР) и умеренными (УКР) когнитивными расстройствами. Жёлто-красным цветом закодированы регионы, где толщина коры достоверно больше для группы контроля (a), умеренных когнитивных расстройств по сравнению с деменцией (b, вверху) и субъективных когнитивных расстройств по сравнению с умеренными (b, внизу) соответственно (FWE, pcorr <0,05). L ― левое полушарие; R ― правое полушарие большого мозга.
При сопоставлении показателей внутри группы пациентов с церебральной микроангиопатией с разной тяжестью когнитивных расстройств отмечалось большее количество зон с достоверным отличием по толщине коры между всеми группами. Наиболее значимыми зонами, отличающими группы пациентов с деменцией и умеренными когнитивными расстройствами, была кора задних отделов поясных извилин и надкраевая извилина слева (см. рис. 2), пациентов с умеренными и субъективными когнитивными расстройствами ― надкраевые извилины, пациентов с субъективными когнитивными расстройствами и группы контроля ― задние отделы правой поясной извилины. Различия в толщине коры между группами пациентов с деменцией и субъективными когнитивными расстройствами (p <0,0001) имели большое число зон в обоих полушариях (верхние, средние и нижние лобные извилины, клин, предклинье, нижние и верхние теменные дольки, задние отделы поясной извилины, парагиппокампы, средние височные извилины, парацентральные дольки, надкраевые извилины, островок; медиальная орбитофронтальная кора справа, постцентральная извилина слева).
Для выделения областей коры, атрофия которых наиболее значима для тяжести когнитивных расстройств при церебральной микроангиопатии, результаты ROI-анализа были проанализированы методом бинарной логистической регрессии, где за 1 было принято развитие деменции, с последующим ROC-анализом. Лучшие характеристики показали области перешейка поясной извилины слева (AUC 0,826, доверительный интервал 0,8–0,9; пороговое значение 2,23 мм; чувствительность 73%, специфичность 85%) и надкраевой извилины слева (AUC 0,778, доверительный интервал 0,7–0,9; пороговое значение 2,26 мм; чувствительность 77%, специфичность 73%), что соответствует хорошей предсказательной способности толщины коры в данных областях в прогнозировании развития деменции при церебральной микроангиопатии.
ОБСУЖДЕНИЕ
Резюме основного результата исследования
В нашей работе проанализирована толщина коры полушарий большого мозга у пациентов с возрастзависимой церебральной микроангиопатией и когнитивными расстройствами различной степени тяжести методом поверхностной морфометрии. Показано, что по мере нарастания выраженности структурных изменений головного мозга и тяжести когнитивных расстройств уменьшается толщина коры отдельных регионов по схожему паттерну (поясные извилины, преимущественно задние их отделы; медиальные и средние отделы лобных долей; различные участки коры островка; височно-теменные области, особенно надкраевые извилины).
Обсуждение основного результата исследования
Выявленный в ходе исследования паттерн атрофии коры при церебральной микроангиопатии согласуется с данными предыдущих морфометрических исследований [12–14, 19]. В частности, E.E. Smith и соавт. [19] показали, что для ранних стадий церебральной микроангиопатии характерно вовлечение таких регионов, как верхние и нижние лобные извилины, задние отделы верхних и средних височных извилин, надкраевые извилины и нижние теменные дольки, причём объём их вовлечения увеличивается с возрастом. В нашем исследовании все эти регионы в той или иной мере показали значимые различия между подгруппами основной группы, при этом возможное влияние возрастных изменений нивелируется сравнением подгрупп с разной тяжестью когнитивных расстройств, сопоставимых по возрасту.
Нужно отметить, что изменения отдельных указанных регионов не являются специфичными именно для церебральной микроангиопатии, и имеют место в той или иной степени при других возрастзависимых заболеваниях, несмотря на хорошие показатели чувствительности и специфичности проведённого нами ROC-анализа. Однако изменения указанных регионов в совокупности хорошо соотносятся как с полученными нами данными при измерении другими методами МРТ, так и с клинической картиной, что подчёркивает паттерн структурно-функционального поражения головного мозга при церебральной микроангиопатии [20, 21]. Так, уменьшение толщины коры средних и задних отделов поясных извилин по мере прогрессирования когнитивных расстройств при церебральной микроангиопатии отмечается и при повоксельной МР-морфометрии с измерением объёмов коры соответствующих регионов [20], а метод диффузионной МРТ с оценкой показателей микроструктурных изменений белого вещества по данным различных моделей показал наибольшие изменения также в средних отделах поясной извилины справа [21]. Поясная извилина активно вовлечена в регуляцию памяти, эмоционального поведения, управляющих функций мозга [22]. Так, изменение толщины её коры и региональной гомогенности при функциональной МРТ покоя (ReHo) связано с ухудшением запоминания [14]. Наряду с медиальными отделами лобных долей, также показавших значимые изменения по мере прогрессирования церебральной микроангиопатии и её клинических проявлений, поясные извилины участвуют в осуществлении управляющих функций мозга, которые страдают при церебральной микроангиопатии [23]. В целом же, с позиции функциональной нейрорадиологии и нейропсихологии, передние отделы островка и поясной извилины составляют функциональную сеть выявления значимости (salience network), связанной с оценкой новых и значимых стимулов; структуры лобных долей и нижней теменной коры объединены в сеть управляющего контроля (executive-control network, frontoparietal network), которая обеспечивает динамический контроль и переключение внимания к значимым стимулам, принятие решений в соответствии с целями и ожидаемыми результатами. В свою очередь, описанные сети и их компоненты объединяются в сеть многокомпонентных задач (multiple-demand network), поражаемую при церебральной микроангиопатии [23], что находит своё отражение в изменении когнитивных функций, а также подтверждено результатами с использованием функциональных МРТ-методик [24], а в настоящей работе ― полученными структурными данными МР-морфометрии. В частности, считается, что изменения в лобных и теменных долях связаны с нарушением скорости передачи информации, что влияет на нейропсихологический профиль пациентов с церебральной микроангиопатией [25].
Уже упомянутое выше соответствие истончения коры части регионов с МРТ микро- и макроструктурными изменениями белого вещества на более ранних стадиях заболевания [21] свидетельствует в пользу преобладания вторичного или смешанного генеза атрофии мозга при церебральной микроангиопатии. Это подтверждают данные количественных измерений, где в группе с церебральной микроангиопатией по сравнению с контролем отмечалось достоверное уменьшение объёмов головного мозга, серого и белого вещества с нарастанием объёма цереброспинальной жидкости и боковых желудочков. В работах других исследователей показана связь между тяжестью церебральной микроангиопатии (оцениваемой преимущественно по субкортикальным инфарктам) и общей атрофией мозга, а также атрофией его отдельных структур и соответствующим расширением прилежащих внутренних и наружных ликворных пространств (мозолистого тела, базальных ганглиев, среднего мозга, гиппокампов), а также локальное истончение коры, связанной с участками, где расположены лакуны [26]. В популяционном исследовании LADIS [27] выявлена роль общей атрофии головного мозга, атрофии коры, подкорковых структур и мозолистого тела в развитии когнитивных расстройств независимо от гиперинтенсивности белого вещества, медиальной височной атрофии или общей атрофии полушарий большого мозга.
По нашим результатам интересным является наблюдение, что, несмотря на наличие значимых волюмометрических изменений между группами нормы и церебральной микроангиопатии, внутри самой группы церебральной микроангиопатии более выраженные когнитивные расстройства не сопровождались значимым уменьшением этих показателей, как и объём цереброспинальной жидкости, который увеличивался при церебральной микроангиопатии по сравнению с контролем, и лишь для группы деменции отмечалось его значимое повышение по сравнению с группой субъективных когнитивных расстройств (медиана индекса цереброспинальной жидкости/интракраниального объёма 0,31 для деменции и 0,27 для субъективных когнитивных расстройств). Факт отсутствия уменьшения в объёме белого вещества при церебральной микроангиопатии даже по мере увеличения объёма гиперинтенсивности белого вещества может объясняться параллельным течением двух процессов ― демиелинизации и потери миелина, с одной стороны, и нейровоспалением и отёком ― с другой [28]. Атрофия коры при сосудистой патологии всё же рассматривается больше как вторичный процесс вследствие поражения больших объёмов белого вещества или наличия корковых микроинфарктов [6]. Именно поэтому уменьшение серого вещества и викарное расширение наружных ликворных пространств не носят такого выраженного характера, как при классических нейродегенеративных процессах [5]. Церебральная микроангиопатия характеризуется превалированием расширения желудочков над наружными ликворными пространствами: объём боковых желудочков при деменции в 3 раза превышал таковой при отсутствии когнитивных расстройств и в 1,5 раза ― при наличии умеренных когнитивных расстройств (медианный объём в норме ― 14 см3, при умеренных когнитивных расстройствах ― 29 см3, при деменции ― 42 см3) [29]. Причиной такого расширения могут являться как первичная, так и вторичная атрофия подкорковых структур вследствие множественных лакун и микрокровоизлияний [3], а также викарное их расширение при повреждении перивентрикулярного белого вещества.
Полученные нами данные могут быть использованы для отслеживания процесса в динамике, оценки эффективности лечения или дифференциальной диагностики различных заболеваний, в частности нейродегенеративных [30]. Что касается самого метода поверхностной морфометрии, однозначными плюсами методики являются автоматизация и стандартизация процесса, возможность быстрых обработки и анализа больших массивов данных, оценка отдельных областей серого вещества по соответствующим атласам. Большинство исследователей предпочитают именно этот метод для оценки возрастных когнитивных нарушений и церебральной микроангиопатии [14, 19, 30], имеющих большую чувствительность по сравнению с повоксельной морфометрией.
Ограничения исследования
Как и для любого автоматического метода анализа данных МРТ, для поверхностной морфометрии имеются ограничения, связанные с особенностями строения центральных извилин, влияющими на результат поверхностной морфометрии для данных областей [17]. При динамическом наблюдении худшими регионами в плане воспроизводимости результатов при повторных сканированиях являются области энторинальной, медиальной орбитофронтальной коры, язычных извилин и ростральные отделы средних лобных извилин [31]. На результаты и их воспроизводимость влияют также напряжённость магнитного поля, тип и параметры МР-режимов (например, параллельное сканирование снижает надёжность результатов измерения толщины коры в области теменных долей и поясных извилин [31]). С учётом множества шагов предобработки и большого объёма данных их статистический анализ, как правило, не лишён ложноположительных и ложноотрицательных результатов, именно поэтому многие исследователи советуют использовать несколько морфометрических методов и критически интерпретировать данные [11].
ЗАКЛЮЧЕНИЕ
Полученные в ходе исследования данные подтверждают вторичный/смешанный характер атрофии при церебральной микроангиопатии. Большое разнообразие регионов, выходящих за рамки структур сети многокомпонентных задач, задействованных при церебральной микроангиопатии, ограничивает уточнение прогрессирования когнитивных расстройств по их атрофии при церебральной микроангиопатии. Это позволяет использовать количественное измерение коры только как вспомогательный метод при оценке прогнозирования течения церебральной микроангиопатии.
ДОПОЛНИТЕЛЬНАЯ ИНФОРМАЦИЯ
Источник финансирования. Научное исследование выполнено при финансовой поддержке гранта Российского научного фонда № 22-15-00183 (https://rscf.ru/project/22-15-00183/.
Конфликт интересов. Авторы декларируют отсутствие явных и потенциальных конфликтов интересов, связанных с публикацией настоящей статьи.
Вклад авторов. Все авторы подтверждают соответствие своего авторства международным критериям ICMJE (все авторы внесли существенный вклад в разработку концепции, проведение исследования и подготовку статьи, прочли и одобрили финальную версию перед публикацией). Наибольший вклад распределён следующим образом: Е.И. Кремнева ― обработка данных морфометрии, анализ и интерпретация МРТ-данных, написание и подготовка статьи; Л.А. Добрынина ― общая концепция исследования, курирование пациентов, обсуждение результатов, написание статьи; К.В. Шамтиева ― клиническая оценка пациентов, статистическая обработка данных, подготовка статьи; В.В. Трубицына ― проведение МРТ-исследований, сбор и подготовка МРТ-данных для анализа; З.Ш. Гаджиева ― клиническая оценка пациентов, методология исследования, обсуждение результатов; А.Г. Макарова ― клиническая оценка пациентов, контроль проведения МРТ и сбора данных, М.М. Цыпуштанова ― клиническая оценка пациентов, контроль проведения МРТ и сбора данных; М.В. Кротенкова ― разработка методологии МРТ-исследования, курирование сбора МРТ-данных, обсуждение и анализ результатов, написание статьи.
ADDITIONAL INFORMATION
Funding source. This work was supported by the Russian Science Foundation grant № 22-15-00183 (https://rscf.ru/project/22-15-00183/.
Competing interests. The authors declare that they have no competing interests.
Authors’ contribution. All authors made a substantial contribution to the conception of the work, acquisition, analysis, interpretation of data for the work, drafting and revising the work, final approval of the version to be published and agree to be accountable for all aspects of the work. E.I. Kremneva ― processing of morphometric data, analysis and interpretation of MRI data, writing and preparation of the article; L.A. Dobrynina ― general concept of the study, supervision of patients, discussion of results, writing the article; K.V. Shamtieva ― clinical assessment of patients, statistical data processing, preparation of the article; V.V. Trubitsyna ― conducting MRI studies, collecting and preparing MRI data for analysis; Z.Sh. Gadzhieva ― clinical assessment of patients, research methodology, discussion of results; A.G. Makarova ― clinical assessment of patients, control of MRI and data collection, M.M. Tsypushtanova ― clinical assessment of patients, control of MRI and data collection; M.V. Krotenkova ― development of MRI research methodology, supervising the collection of MRI data, discussion and analysis of the results, writing the article.
About the authors
Elena I. Kremneva
Research Center of Neurology
Author for correspondence.
Email: kremneva@neurology.ru
ORCID iD: 0000-0001-9396-6063
SPIN-code: 8799-8092
MD, Dr. Sci. (Medicine)
Russian Federation, MoscowLarisa A. Dobrynina
Research Center of Neurology
Email: dobrla@mail.ru
ORCID iD: 0000-0001-9929-2725
SPIN-code: 2824-8750
MD, Dr. Sci. (Medicine), Assistant Professor
Russian Federation, MoscowKamila V. Shamtieva
Research Center of Neurology
Email: kamila.shamt@gmail.com
ORCID iD: 0000-0002-6995-1352
SPIN-code: 5645-8768
MD, Cand. Sci. (Medicine)
Russian Federation, MoscowVictoria V. Trubitsyna
Research Center of Neurology
Email: pobeda-1994@mail.ru
ORCID iD: 0000-0001-7898-6541
Russian Federation, Moscow
Zukhra S. Gadzhieva
Research Center of Neurology
Email: zuhradoc@mail.ru
ORCID iD: 0000-0001-7498-4063
SPIN-code: 7015-5970
MD, Cand. Sci. (Medicine)
Russian Federation, MoscowAngelina G. Makarova
Research Center of Neurology
Email: angelinagm@mail.ru
ORCID iD: 0000-0001-8862-654X
MD, Cand. Sci. (Medicine)
Russian Federation, MoscowMaria M. Tsypushtanova
Research Center of Neurology
Email: tzipushtanova@mail.ru
ORCID iD: 0000-0002-4231-3895
MD, Cand. Sci. (Medicine)
Russian Federation, MoscowMarina V. Krotenkova
Research Center of Neurology
Email: krotenkova_mrt@mail.ru
ORCID iD: 0000-0003-3820-4554
SPIN-code: 9663-8828
MD, Dr. Sci. (Medicine), Assistant Professor
Russian Federation, MoscowReferences
- Pantoni L, Gorelick PB. Cerebral small vessel disease. Cambridge University Press; 2014.
- Gorelick PB, Scuteri A, Black SE, et al. Vascular contributions to cognitive impairment and dementia: A statement for healthcare professionals from the American Heart Association/American Stroke Association. Stroke. 2011;42(9):2672–2713. EDN: PIHATP doi: 10.1161/STR.0b013e3182299496
- Duering M, Biessels GJ, Brodtmann A, et al. Neuroimaging standards for research into small vessel disease-advances since 2013. Lancet Neurol. 2023;22(7):602–618. EDN: AEXCGU doi: 10.1016/S1474-4422(23)00131-X
- Jagust WJ, Zheng L, Harvey DJ, et al. Neuropathological basis of magnetic resonance images in aging and dementia. Ann Neurol. 2008;63(1):72–80. doi: 10.1002/ana.21296
- Godin O, Maillard P, Crivello F, et al. Association of white-matter lesions with brain atrophy markers: The three-city Dijon MRI study. Cerebrovascular Dis. 2009;28(2):177–184. doi: 10.1159/000226117
- Peres R, De Guio F, Chabriat H, et al. Alterations of the cerebral cortex in sporadic small vessel disease: A systematic review of in vivo MRI data. J Cerebral Blood Flow Metabolism. 2016;36(4):681–695. doi: 10.1177/0271678X15625352
- Tuladhar AM, van Norden AG, de Laat KF, et al. White matter integrity in small vessel disease is related to cognition. NeuroImage Clin. 2015;7:518–524. doi: 10.1016/j.nicl.2015.02.003
- Bethlehem RA, Seidlitz J, White SR, et al. Brain charts for the human lifespan. Nature. 2022;604(7906):525–533. EDN: BEAJBV doi: 10.1038/s41586-022-04554-y
- Ashburner J, Friston KJ. Voxel-based morphometry: the methods. Neuroimage. 2000;11(6):805–821. doi: 10.1006/nimg.2000.0582
- Dale AM, Fischl B, Sereno MI. Cortical surface-based analysis. I. Segmentation and surface reconstruction. Neuroimage. 1999;9(2):179–194. doi: 10.1006/nimg.1998.0395
- Goto M, Abe O, Hagiwara A, et al. Advantages of using both voxel-and surface-based morphometry in cortical morphology analysis: A review of various applications. Magnetic Res Med Sci. 2022;21(1):41–57. EDN: VWVUEU doi: 10.2463/mrms.rev.2021-0096
- Damulina AI, Konovalov RN, Kadykov AS. Significance of voxel-based morphometry in studying mild cognitive impairments. Ann Clin Experimental Neurol. 2015;9(3):42–48. EDN: VKPNWD
- Ozzoude M, Ramirez J, Raamana PR, et al. Cortical thickness estimation in individuals with cerebral small vessel disease, focal atrophy, and chronic stroke lesions. Front Neurosci. 2020;14:598868. EDN: QRNNGX doi: 10.3389/fnins.2020.598868
- Mo Y, Huang L, Qin R, et al. Decreased cortical thickness and normal regional homogeneity underlying cognitive impairment in cerebral small vessel disease. Adv Neuro. 2022;1(1):48. doi: 10.36922/an.v1i1.48
- Bookstein FL. “Voxel-based morphometry” should not be used with imperfectly registered images. Neuroimage. 2001;14(6):1454–1462. doi: 10.1006/nimg.2001.0770
- Staals J, Booth T, Morris Z, et al. Total MRI load of cerebral small vessel disease and cognitive ability in older people. Neurobiol Aging. 2015;36(10):2806–2811. doi: 10.1016/j.neurobiolaging.2015.06.024
- Gaser C, Dahnke R, Kurth K, et al. CAT-a computational anatomy toolbox for the analysis of structural MRI data. BioRxiv. 2022. doi: 10.1101/2022.06.11.495736
- Desikan RS, Ségonne F, Fischl B, et al. An automated labeling system for subdividing the human cerebral cortex on MRI scans into gyral based regions of interest. Neuroimage. 2006;31(3): 968–980. doi: 10.1016/j.neuroimage.2006.01.021
- Smith EE, Beaudin AE. New insights into cerebral small vessel disease and vascular cognitive impairment from MRI. Curr Opinion Neurol. 2018;31(1):36–43. doi: 10.1097/WCO.0000000000000513
- Dobrynina LA, Gadzhieva ZSh, Kremneva EI, et al. Survival, cognitive functions, and brain MRI in patients with cSVD: 5-year observation. Ann Clin Exp Neurol. 2022;16(4):18–28. EDN: EZEIVD doi: 10.54101/ACEN.2022.4.3
- Kremneva EI, Maximov II, Dobrynina LA, Krotenkova MV. The assessment of cerebral white matter microstructure in cerebral small vessel disease based on the diffusion-weighted magnetic resonance imaging. Ann Clin Exp Neurol. 2020;14(1):33–43. EDN: RXKAYI doi: 10.25692/ACEN.2020.1.4
- Gasquoine PG. Localization of function in anterior cingulate cortex: From psychosurgery to functional neuroimaging. Neurosci Biobehavioral Rev. 2013;37(3):340–348. doi: 10.1016/j.neubiorev.2013.01.002
- Dobrynina LA, Gadzhieva ZS, Morozova SN, et al. Executive functions: FMRI of healthy volunteers during stroop test and the serial count test. S.S Korsakov J Neurol Psychiatry. 2018;118(11):64–71. EDN: YRLKTZ doi: 10.17116/jnevro201811811164
- Sergeeva AN, Seliverstova EV, Dobrynina LA, et al. Pulsed arterial spin labeling (pasl) in receiving perfusion and functional data: Technique abilities. Russ Electronic J Radiol. 2019;9(1):148–159. EDN: ZJQHTK doi: 10.21569/2222-7415-2019-9-1-148-159
- Liu R, Wu W, Ye Q, et al. Distinctive and pervasive alterations of functional brain networks in cerebral small vessel disease with and without cognitive impairment. Dementia Geriatric Cognitive Disorders. 2019;47(1-2):55–67. doi: 10.1159/000496455
- Aribisala BS, Hernandez MC, Royle NA, et al. Brain atrophy associations with white matter lesions in the ageing brain: The Lothian birth cohort 1936. Eur Radiol. 2013;23(4):1084–1092. EDN: UYIACD doi: 10.1007/s00330-012-2677-x
- LADIS Study Group. 2001–2011: A decade of the LADIS (Leukoaraiosis and DISability) Study: What have we learned about white matter changes and small-vessel disease? Cerebrovascular Dis. 2011;32(6):577–588. doi: 10.1159/000334498
- Lawrence AJ, Patel B, Morris RG, et al. Mechanisms of cognitive impairment in cerebral small vessel disease: Multimodal MRI results from the St George’s cognition and neuroimaging in stroke (SCANS) study. PloS One. 2013;8(4):e61014. doi: 10.1371/journal.pone.0061014
- Kremneva EI. Age-dependent cerebral microangiopathy: MRI equivalents of cognitive disorders, severity and mechanisms of progression [dissertation]: 3.1.24; 3.1.25. Place of protection: Scientific Centre of Neurology. Moscow; 2023. (In Russ.) Available from: https://neurology.ru/upload/medialibrary/e7e/kas58vctp2as9tqb8pobkp30jztwpbrt/Kremneva-Elena-Igorevna-_-dissertatsiya.pdf. Accessed: 21.04.2024.
- Struyfs H, Sima DM, Wittens M. Automated MRI volumetry as a diagnostic tool for Alzheimer’s disease: Validation of icobrain dm. Neuroimage Clin. 2020;26:102243. doi: 10.1016/j.nicl.2020.102243
- Wonderlick JS, Ziegler DA, Hosseini-Varnamkhasti P, et al. Reliability of MRI-derived cortical and subcortical morphometric measures: Effects of pulse sequence, voxel geometry, and parallel imaging. Neuroimage. 2009;44(4):1324–1333. doi: 10.1016/j.neuroimage.2008.10.037
Supplementary files


