

")


The role of dual-energy computed tomography in the diagnosis of gout and other crystalline arthropathies: A review
- Authors: Onoyko M.V.1, Mershina E.A.1, Georginova O.A.1, Plotnikova M.L.1, Panyukova A.V.1, Sinitsyn V.E.1
-
Affiliations:
- Lomonosov Moscow State University
- Issue: Vol 4, No 2 (2023)
- Pages: 197-213
- Section: Reviews
- Submitted: 08.04.2023
- Accepted: 11.05.2023
- Published: 12.07.2023
- URL: https://jdigitaldiagnostics.com/DD/article/view/322758
- DOI: https://doi.org/10.17816/DD322758
- ID: 322758

Cite item

Abstract
The importance of dual-energy computed tomography in the diagnosis of gout, the principles of dual-energy computed tomography, the accuracy of the methodology, and the types of artifacts are discussed in this study. The possible dependence of the presence of deposits of sodium monourate on other clinical data and the role of dual-energy computed tomography in the differential diagnosis of other crystalline arthropathies are considered.
The dual-energy computed tomography has several advantages, including noninvasiveness, speed of execution, and a significant reduction in the risk of iatrogenic consequences compared with diagnostic arthrocentesis, which is the gold standard in diagnosing gout. Dual-energy computed tomography can accomplish gout detection, treatment, and differential diagnosis.
Full Text
INTRODUCTION
Gout is a systemic rheumatological disease in which monosodium urate crystals accumulate in the articular, bone, cartilage, or soft tissues following an elevation in uric acid levels in the blood serum (hyperuricemia). Gouty arthritis and gouty nephropathy or urate nephrolithiasis might develop, depending on the lesion type.
GOUT: A SYSTEMIC TOPHACEOUS DISEASE
Over the last decade, accumulated data have made hyperuricemia more than just a marker of gout and urolithiasis. Hyperuricemia plays a role in the onset and progression of various metabolic and hemodynamic diseases, including metabolic syndrome, chronic heart failure, hypertension, atherosclerosis, early infarction and stroke, and diabetes mellitus.
The American College of Rheumatology (ACR) and European Alliance of Associations for Rheumatology (EULAR) (2015) classification criteria include clinical, laboratory, and instrumental data to diagnose gout [1]. The sensitivity and specificity of these criteria are 92% and 89%, respectively [1].
These criteria can be used if the patient has an “input sign”: at least one episode of pain and edema in a peripheral joint or joint capsule. The presence of monosodium urate crystals in the synovial fluid or tophaceous tissue (macroscopic conglomerates of monosodium urate surrounded by granulomatous inflammation) by polarized light microscopy is a sufficient criterion for diagnosing gout, making this method the gold standard. In the absence of a sufficient criterion, clinical (typical clinical symptoms of gout, tophi detection, and temporal pattern of an attack), laboratory (serum uric acid level and synovial fluid analysis), and instrumental (ultrasonography of the affected joint and dual-energy computed tomography [CT]) diagnosis methods must be used. Each criterion is assigned a certain number of points, based on its degree of specificity. The ACR/EULAR-2015 classification criteria evaluate the visual determination of signs of urate deposits during dual-energy CT (DECT) as 4 points, and 8 of 23 points are sufficient to confirm gout. Thus, DECT plays a substantial role in confirming the diagnosis.
Joint puncture with synovial fluid aspiration is an invasive and painful method associated with various limitations and complications, necessitating the search for alternative diagnostic methods to make an accurate diagnosis [2, 3]. DECT, a non-invasive procedure for distinguishing urate deposits from surrounding tissues with excellent sensitivity and specificity, is one of the alternative diagnostic methods [4].
Hyperuricemia and monosodium urate crystals
Gout is a systemic tophaceous disease defined by monosodium urate crystal deposition in various tissues, which causes inflammation in patients with hyperuricemia caused by environmental and/or hereditary factors [5].
Regardless of hereditary predisposition, gout must be viewed as a staged disease [6], with hyperuricemia as the starting point. In hyperuricemia, the uric acid levels in the blood serum increase to >420 µmol/L or 6 mg/dL, resulting in the formation of monosodium urate crystals [7].
According to clinical, laboratory, and instrumental findings, gout has four distinct stages that do not necessarily transition from one to the next: (a) hyperuricemia with no symptoms or history of gout and no urate crystal deposits, (b) asymptomatic hyperuricemia with signs of urate crystal deposits, (c) hyperuricemia with a current or previous episode of gouty arthritis, and (d) hyperuricemia with tophi, chronic arthritis, or erosive arthritis [5].
The disease progresses in the absence of effective urate-lowering therapy. Initially, conglomerates of monosodium urate crystals form, which are detected in specific tissues and are dependent on environmental factors. Monosodium urate is soluble at 7 mg/dL (416 µmol/L) in normal saline at 37°C. As the monosodium urate concentration in synovial fluid increases, it subsequently deposits on the cartilage surface, with further destruction and penetration of monosodium urate crystals into the subchondral bone [8], which eventually leads to active bone remodeling. Long-term monosodium urate crystal saturation of synovial fluid results in the formation of macroscopic monosodium urate deposits surrounded by granulomatous inflammation (tophi) [9]. They are most commonly present in proteoglycan-rich tissues (joint capsule, tubular bones, tendons, and skin); however, they can be (infrequently) also found in parenchymal organ tissues. The tissue reaction to monosodium urate deposition is chronic inflammation, involving both innate and adaptive immunity [10].
In chronic gout, the frequency, duration, and severity of attacks increase, tophi form, severe deforming arthropathy develops, and concomitant diseases progress.
According to recent epidemiological studies, the prevalence of hyperuricemia in adults is gradually increasing. High uric acid levels are found in 0.68–3.9% of cases in Europe and the United States, which range from 6.4% to 21.04% in some parts of China [11]. In Russia, this value is 16.8% [7]; however, hyperuricemia might remain asymptomatic for a long time in 5%–8% of the population. Hyperuricemia increases the risk of chronic kidney disease, obesity, type 2 diabetes, cardiovascular risk, and death [12, 13].
Gout diagnosis methods
Gout is diagnosed by at least one episode of joint arthritis (one metatarsophalangeal joint, ankle joint, or midfoot) or joint capsule inflammation. The second sufficient criterion for diagnosing is the determination of uric acid levels in the blood serum, synovial fluid analysis of the affected joint, or tofus aspiration for the detection of monosodium urate crystals by polarized light microscopy [14]. Joint puncture for diagnostic purposes can be performed in both the acute and attack-free periods. However, processing and long-term storage of the synovial fluid and urate-lowering therapy in some cases can affect the reliability and sensitivity of detecting monosodium urate [15]. Serum uric acid levels fluctuate in all patients with gout. However, in 30% of patients with hyperuricemia, serum uric acid elevation is not detected even during an acute gout attack [16]; thus, the diagnosis of gout should not be based solely on serum uric acid levels. In patients with an atypical clinical course of inflammatory arthropathy, various imaging methods must be used for diagnosing gout, including radiography, ultrasound diagnosis, and DECT. This is critical for differential diagnosis, including when synovial fluid analysis by polarized light microscopy is impossible.
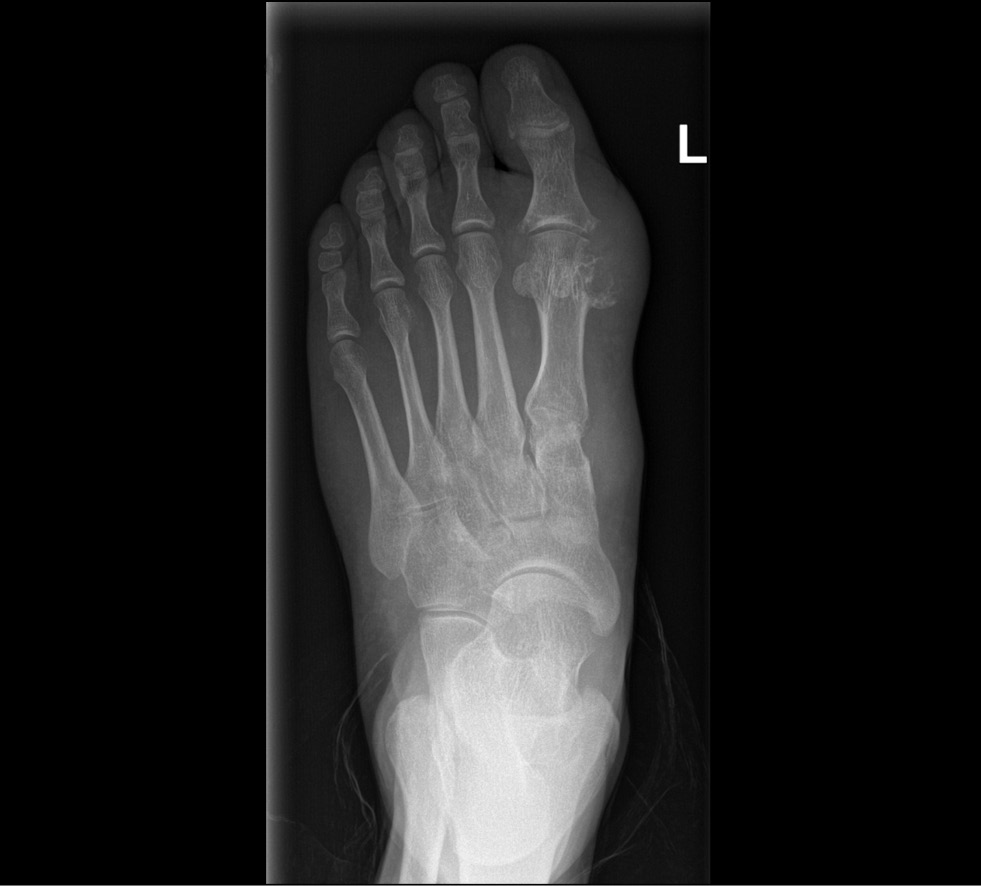
Typical radiographic signs of gout are punched-out bone erosions with sclerotic contours and overhanging borders, also known as “rat bite” or “gull wing” erosions (Fig. 1).

Fig. 1. Bone erosions in a patient with gout (radiography findings of the Medical Research and Education Center of the Lomonosov Moscow State University).
Articular tophi, which resemble inhomogeneous soft tissue indurations, can be seen in chronic gout. X-ray changes are seen several years after gout onset and may be useful in confirming the diagnosis later in the disease progression [16, 17].
DUAL-ENERGY COMPUTED TOMOGRAPHY: AN ALTERNATIVE METHOD OF INSTRUMENTAL DIAGNOSIS OF GOUT
Ultrasound examination of the joints and DECT, which detects urate deposits, tophi, and bone degradation, are alternative instrumental methods of gout diagnosis.
On ultrasound examination of the joints, urate deposits can be detected on the surface of the articular cartilage as a hyperechoic intermittent band, independent of the viewing angle (double contour effect), or in synovial fluid as floating hyperechoic heterogeneous foci that look like a “snowstorm,” and hyperechoic aggregates visualized in the joint space or along the tendons [18].
DECT is also useful in differentiating between gout and septic arthritis or between monosodium urate accumulation and calcium pyrophosphate deposition (pseudogout and chondrocalcinosis) [19, 20]. DECT allows investigating the numerous anatomical locations in great detail, finding deposits of monosodium urate crystals noninvasively [21–23].
How dual-energy computed tomography works?
DECT, a modern and promising research method, involves the spectral differentiation of materials by scanning a specific body part with two different types of X-rays with varying energies. Signal absorption coefficients identify substances under these conditions, allowing them to be distinguished by their chemical composition. At low X-ray tube voltages (20–50 kV), X-ray energy is totally absorbed by the substance (with prevailing photoelectric effect), whereas at high voltages (50–150 kV), Compton scattering prevails, resulting in signal attenuation [24, 25]. The role of the photoelectric and Compton effects for each compound is determined by the substance’s electron density and atomic number [24, 26]: the higher the atomic number and lower the electron density (e.g., iodine, calcium, barium, and xenon), the greater the effect of photoelectric absorption, whereas elements with a low atomic number and higher electron density (carbon, nitrogen, hydrogen, and oxygen) depend more on the Compton effect [24]. For example, in iodine, calcium, and barium, the K-edge phenomenon is observed, characterized by photon absorption and photoelectron ejection from the K-shell. DECT is based on this phenomenon. Because some elements have well-defined K-edges, the difference between the absorption coefficients of the tested substances at different energies increases, allowing them to be distinguished.
DECT has several configurations: with two perpendicular sources and detectors, with a single source-detector system with quick voltage switching, or with a single X-ray source and a multilayer sandwich detector [26]. Data are processed using three- or two-material decomposition analysis. Two-material decomposition analysis in the diagnosis of gout is performed by uric acid and calcium. Soft tissues are the “reference point” for the algorithm to make judgment concerning the presence of calcium or monosodium urate in the area under study. Thus, a material density (MD) map can be created, on which each component is color coded. In the Siemens DECT systems, cortical bones, cancellous bones, and monosodium urate crystals are coded blue, pink, and green, respectively. Color scales used by other manufacturers’ processing algorithms may differ.
In addition to the qualitative assessment, a quantitative assessment of the chemical of interest is possible. The dual-energy gout software automatically determines the total volume of monosodium urate deposits in the field of view (FOV) [23]. Artifacts are included in the total volume; therefore, understanding their types and potential location is critical. Green areas corresponding to artifacts can be removed using the cropping tool. After this, the total volume of monosodium urate deposits will be automatically recalculated.
Three-dimensional reconstruction (volume-rendering technique image) with color coding is possible, as are other reconstruction algorithms employed in research (Fig. 2).

Fig. 2. Three-dimensional reconstruction, blended and color-coded image (right ankle joint and small foot joints): blue, pink, and green represent cortical bone, cancellous bone, and monosodium urate crystals, respectively (dual-energy computed tomography findings of the Medical Research and Education Center of the Lomonosov Moscow State University).
The key advantage of DECT over other diagnosis methods is its ability to determine the chemical composition by scanning at two energy levels and quantifying the chemical of interest. The non-invasiveness, speed of study, and absence of iatrogenic complications in DECT are all evident benefits.
An incorrect belief is that the radiation exposure during dual-energy scanning is double that received during single-energy scanning. However, numerous studies have found that the radiation exposure and image quality in DECT and single-energy CT are comparable [27–29]. This is accomplished not only through the device’s technical features but also through the use of methods that reduce radiation dose, such as the ability to independently set the current strength, iterative reconstruction and other modern algorithms, use of virtual non-contrast images, FOV size limitation to the area of interest [30, 31].
DECT allows for the reconstruction of virtual monochromatic images, which are the result of theoretical scanning with monochromatic radiation. This application aids in increasing contrast and decreasing the number of artifacts from metal structures [32].
The disadvantages include a small FOV for dual-energy images, which is a circle with a diameter of only 33–35 cm for different generations of tomographs, possibility of false-positive and false-negative results, and cross-scattering (when photons emitted by one source hit a detector designed for photons emitted by another source) [33, 34]. These technical flaws can result in data loss (Fig. 3a).
Diagnostic accuracy of dual-energy computed tomography
According to Baer et al. [35], DECT has 100% sensitivity in the tophi form of gout and 64% in the absence of tophi. According to the meta-analysis by Ogdie et al. [20], DECT has sensitivity and specificity of 87% and 84%, respectively, which exceed the same parameters for ultrasonography. Bongartz et al. [36] found reported sensitivity and specificity rates of 90% and 83%, respectively. According to Huppertz et al. [37], DECT is less sensitive than ultrasound (100% vs. 84.6%) because of lower resolution.
These data suggest that DECT has good diagnostic accuracy. Varying scan areas, which may be crucial in determining the accuracy of the method, and varying disease durations in some studies are likely to explain the discrepancy in findings between study groups [38].
However, the presence of false-positive and false-negative results is unavoidable in every study method. Objects mimicking monosodium urate crystals can be seen in the nail bed and skin calluses (Fig. 3b). This false-positive result is caused by the similarity of the dual-energy index of keratin to that of monosodium urate, which results in similar color coding [39]. Interestingly, these artifacts are more commonly found in the feet than in the hands [39, 40]. Generally, the skin above the knee and elbow joints does not produce such artifacts.
Metal structures and dense areas of cortical bone produce artifacts of increased radiation hardness, which might be misinterpreted as monosodium urate deposits [40]. When using polychromatic radiation, radiation hardness (beam hardening) increases, causing faster absorption of low-energy photons and slower absorption of high-energy photons, resulting in an increase in the total energy of X-ray radiation. Because of beam hardening, the attenuation of the radiation decreases and the intensity at the detectors increases, resulting in a deviation from the optimum absorption profile. Thus, the artifact appears in the image as depressions and dark bands between dense objects (Fig. 3c).
At low signal-to-noise ratios, small dotted green inclusions appear, mimicking monosodium urate crystals (Fig. 3d). However, if small dotted green inclusions are observed along any anatomical structure, such as the Achilles tendon, a case of true monosodium urate deposition must be considered [39].

Fig. 3. Artifacts in dual-energy computed tomography: a) data loss owing to incorrect positioning of the patient, b) nail bed artifact, c) increased radiation hardness artifact from a wedding ring, and d) multiple small dotted artifacts (dual-energy computed tomography findings of the Medical Research and Education Center of the Lomonosov Moscow State University).
A false-negative result is obtained when the monosodium urate microcrystals are <2 mm in diameter, when visualizing tophi with a monosodium urate concentration that is too low, and when the technical parameters are incorrectly set. However, in most cases, artifacts are quite typical and easily identified by an experienced radiologist. Artifacts can be removed using various image reconstruction algorithms, such as a kernel, and correctly setting image parameters on the workstation, such as “air distance,” “resolution,” “minimum [HU],” and “ratio” (for Syngo.via VB20A_HF06 class Dual-Energy Gout).
A kernel (reconstruction filter) is a mathematical algorithm that is used to reconstruct CT images [41].
The “air distance” parameter (the distance in voxels between monosodium urate crystals and the air and bone) allows the reduction of artifacts in the nailbed and skin. This operation removes all green elements within the specified distance from the skin surface, except for those that are simultaneously near bone structures at a distance not exceeding the specified value.
The “ratio” parameter is the dual-energy ratio, which is the ratio of low-energy MD to high-energy MD in Hounsfield units (HU). When using the two-material decomposition method, this value is critical for separating calcium from urate. An increase in the “ratio” parameter increases the sensitivity of DECT to monosodium urate crystals because of a decrease in specificity [39].
The “minimum [HU]” parameter determines the HU threshold in mixed images, which are virtually equal to images obtained at 120 kV [42]. Objects with densities less than the specified value will not have their dual-energy index calculated; however, they will be assigned “0” HU on MD maps and hence will not be color-coded [39].
The “resolution” parameter specifies the minimum amount of green pixels that the application will identify as monosodium urate deposition. If the number of such pixels in the given area is less than the specified value, they will not be displayed.
An extra tin filter can be used to shut off low-energy photons, lowering radiation exposure and enhancing image quality.
Comparison of clinical data and dual-energy computed tomography findings
Lee et al. [43] focused on parameters that are more likely to predict the presence of monosodium urate deposits on DECT. These parameters include uric acid levels in the blood serum, renal failure, and disease duration. Thus, the diagnostic value of DECT is limited in patients with new-onset gouty arthritis, and the likelihood of a positive DECT result is increased in patients who have chronic gout. Jia et al. [44] found that the sensitivity of DECT increases as the disease progresses. DECT had a sensitivity of 35.7% at the first visit for gout, 61.5% in patients with gout <2 years, and 92.9% in patients with gout >3 years. Other data suggest that monosodium urate deposits are found on DECT in 15%–24% of patients with asymptomatic hyperuricemia and 32.8% of patients with the first episode of gouty arthritis. This can be explained by the lack of monosodium urate volume and concentration for visualization in patients on their first attack of gouty arthritis [45]. Thus, DECT may be more effective for case follow-up than for primary diagnosis, whereas ultrasound examination may be useful for the first gout attack.
Chronic kidney disease and gout are comorbid conditions. A decrease in renal excretory function contributes to urate retention in the body, which increases the risk of monosodium urate crystal deposition in the joints and other tissues. On the contrary, Shang et al. [46] did not find a significant link between the presence of renal failure and the volume of monosodium urate deposits on DECT.
That a high serum uric acid concentration correlates with positive DECT findings is not always true. Hypouricemic therapy reduces uric acid levels in the blood serum, which leads to the breakdown of monosodium urate deposits. During a specific period, monosodium urate crystals have not yet dissolved at a specific time, at a sufficiently low uric acid level. Thus, using DECT to monitor urate deposit absorption allows the evaluation of treatment efficacy, and visible changes contribute to better compliance. Furthermore, not all patients with the same high level of uric acid in the blood have detectable monosodium urate deposits; thus, additional factors, such as genetic predisposition and age, influence the positive result of DECT [47].
Bayat et al. [23] developed a semiquantitative system for assessing monosodium urate crystal deposition (DECT urate scoring system) for the most affected area (feet). The analyzed area is divided into four parts, namely, first metatarsophalangeal joint, other joints of the foot, ankles, and tendons in the feet and ankles, which are assigned points and then summed up, depending on the number and nature of deposits. The results can be used to confirm the presence of gout and monitor the success of hypouricemic therapy. When compared with the automatic calculation of the volume of monosodium urate deposits, this technique saves time and makes it easier to work in difficult-to-measure locations. However, this scoring system only applies to foot lesions.
The semiquantitative method (DECT urate scoring system) was used by Shang et al. [46], and no correlation was found between the score and concentration of uric acid in the blood serum. However, the relationship between the amount of monosodium urate in tissues and a long disease period, presence of erosions, and presence of tophi was confirmed. The study timing could be a factor in the disparity between DECT findings and uric acid levels. Specifically, uric acid excretion in the urine increases during a gout attack [48].
However, studies have shown a link between uric acid levels in the blood serum and the presence of monosodium urate deposits on DECT. For example, Dalbeth et al. [49] report that urate deposits were discovered in 90.0% of patients with blood uric acid levels ≥360 mM and palpable tophi; however, monosodium urate deposits were only seen in 46.9% of patients with non-palpable tophi and lower laboratory findings. All study participants received allopurinol at a dose of ≥300 mg. In addition, patients with blood uric acid levels ≥360 mM and palpable tophi had a higher volume of monosodium urate crystals and a higher number of erosions than patients in the other group.
Dual-energy computed tomography in the differential diagnosis of microcrystalline arthropathies associated with calcium salt deposition
In addition to gouty arthritis, microcrystalline arthropathies include arthritis caused by the deposition of calcium pyrophosphate and calcium hydroxyapatite crystals.
Calcium pyrophosphate crystal deposition disease is characterized by the accumulation of crystals, primarily calcium pyrophosphate, in the fibrous and hyaline cartilage. Risk factors include age, joint injury, hereditary predisposition, and diseases such as hemochromatosis, primary hyperparathyroidism, hypophosphatasia, and hypomagnesemia [50].
Calcium pyrophosphate crystal deposition disease frequently mimics other conditions, making diagnosis challenging for specialists. It can also be combined with other forms of inflammatory arthritis. For example, patients with gout or rheumatoid arthritis are more likely to develop calcium pyrophosphate crystal deposition disease [51]. Given the foregoing, the search for an appropriate differential diagnosis method becomes necessary.
Clinically, acute crystalline arthritis associated with calcium pyrophosphate deposition is similar to acute gouty arthritis, with the sole difference being the disease duration. Acute arthritis associated with calcium pyrophosphate deposition can persist for weeks or even months [52, 53].
Chronic crystalline arthritis associated with calcium pyrophosphate deposition frequently progresses as degenerative osteoarthritis with mechanical joint pain and intermittent clinical outbreaks of acute arthritis associated with calcium pyrophosphate deposition [52]. The interphalangeal, second and third metacarpophalangeal, and knee joints are the most commonly affected [52–54].
Calcium pyrophosphate crystals may deposit along the cruciform ligament of the atlas, which is manifested as the crowned dens syndrome. The clinical presentation is nonspecific, consisting of severe neck pain, fever, neck muscle stiffness, and occipital headache [55]. In this case, the differential diagnosis includes meningitis, giant cell arteritis, rheumatoid arthritis, and others.
Calcium pyrophosphate deposition-associated crystalline arthritis can occasionally manifest as polyarthritis and thus mimic rheumatoid arthritis. Clinically, the distinction is that joint damage caused by calcium pyrophosphate crystals proceeds sequentially and less symmetrically than in rheumatoid arthritis [53]. Nonetheless, relying on this clinical parameter is problematic. Calcium pyrophosphate deposition-associated crystalline arthritis might mimic not just rheumatological diseases but also neurological diseases, cancers, and other conditions. The development of novel instrumental methods is critical for accurate and timely differential diagnosis.
The informative value of blood parameters is minimal for the diagnosis of arthritis associated with calcium pyrophosphate deposits. Polarized light microscopy of the synovial fluid and instrumental methods such as X-ray imaging, ultrasonography, and CT make a larger contribution.
To date, X-ray imaging is the most commonly used method in routine practice for diagnosing calcium pyrophosphate crystal deposition disease, whereas polarized light microscopy of the synovial fluid is the gold standard, according to the European League Against Rheumatism (EULAR) recommendations. As previously stated, this method has limitations and disadvantages that often cannot be corrected.
In X-ray imaging, the presence of chondrocalcinosis, which most commonly affects menisci, triangular cartilage in the triangular fibrocartilage complex, and pubic symphysis, is the primary symptom of calcium pyrophosphate crystal deposition disease. Chondrocalcinosis is visualized as linear zones of compaction parallel to the cortical bone surface, spicular inclusions along the cartilaginous structure, or cloud-like overlays along the contour of the synovial membrane [56]. This method has undeniable advantages, including noninvasiveness, absence of iatrogenic complications, rapidity with which it can be implemented, and low cost. Moreover, radiography is neither a very sensitive nor a completely specific method for diagnosing calcium pyrophosphate crystal deposition disease because a similar presentation can be seen with calcium hydroxyapatite deposition in the cartilage [50]. According to Lee et al. [57], the specificity and sensitivity of this method were 96.9% and 44.2%, respectively.
Distinguishing osteoarthritis associated with calcium pyrophosphate deposition from degenerative osteoarthritis using X-ray examination is difficult because the signs of differential diagnosis used are not absolute. These include the presence of more pronounced osteophytes and subchondral cysts, bone tissue degradation, lesion localization, and inflammation [50, 53, 54, 58]. Thus, the involvement of the shoulder, hand, and metacarpophalangeal joints is less common in degenerative osteoarthritis than in calcium pyrophosphate deposition-associated osteoarthritis [53]. Larger subchondral cysts and severe bone destruction are more common in calcium pyrophosphate deposition-associated osteoarthritis [54]. It is also worth paying attention to the calcified tendon of the quadriceps muscle and the Achilles tendon in the presence of chondrocalcinosis, which most likely implies calcium pyrophosphate crystal deposition disease.
Ultrasonography is becoming more popular because of its low cost, portability of equipment, and ease of usage. Frediani et al. [59] described three types of ultrasound findings in patients with calcium pyrophosphate crystal deposition disease. One of them is the presence of hyperechoic linear bands parallel to the cartilage surface, and this is more common with calcium pyrophosphate deposition in the hyaline cartilage. Another sign is more typical for calcium pyrophosphate deposition in the fibrocartilage. It is the formation of dotted hyperechoic inclusions along the cartilage tissue. In the joint cavity, the hyperechoic suspension containing mobile aggregates of round and/or oval calcium pyrophosphate crystals was seen the least. According to Lee et al. [57], the specificity and sensitivity of ultrasonography were 77.1% and 74.4%, respectively. Crucially, distinguishing between the ultrasound signs of gout and calcium pyrophosphate crystal deposition disease may be difficult when using this method, particularly for physicians who are not ultrasound specialists. One of the method’s drawbacks is the operator-dependent results. Furthermore, with pronounced osteophytes in the advanced stages of osteoarthritis, difficulties may be caused by an acoustic shadow from the bone tissue [60].
CT is primarily used in cases of axial skeleton localization in the crowned dens syndrome, injury to the intervertebral discs, etc. [61]. Calcifications of the transverse, alar, apical, and cruciate ligaments are clearly visualized in the atlantoaxial joint, and calcification of the yellow ligament as nodular foci was also reported [62].
The role of DECT in the diagnosis of calcium pyrophosphate crystal deposition disease is unclear. Calcium-containing deposits will be colored blue on color-coded images obtained with DECT in the dual-energy gout class, allowing them to be distinguished from monosodium urate-containing deposits. The cortical bone is color-coded similarly to calcium pyrophosphate and hydroxyapatite deposits because of its high calcium concentration (Fig. 4).

Fig. 4. Color-coded dual-energy coronal and sagittal images (left knee joint). Calcification of the medial meniscus (dual-energy computed tomography findings of the Medical Research and Education Center of the Lomonosov Moscow State University).
According to Kravchenko et al. [63], the sensitivity and specificity of DECT for the detection of calcium pyrophosphate crystals were 55% and 92%, respectively (with a mean disease duration of 1 month, using established imaging techniques for gout) [63]. Tanikawa et al. [60] reported that DECT had a sensitivity and specificity of 77.8% and 93.8%, respectively, for the detection of calcium pyrophosphate crystals in the menisci ex vivo.
Currently, no specific protocol has been made for calcium pyrophosphate crystal deposition disease, making it impossible to calculate the volume of calcium pyrophosphate deposits and, in some cases, distinguish them from bone tissue. Tedeschi et al. [64] modified the image reconstruction parameters for gout by increasing the “iodine ratio” parameter, resulting in an increase in the method’s sensitivity for calcium pyrophosphate crystals up to 90%–100%. Moreover, the possibility of distinguishing monosodium urate crystals from calcium pyrophosphate crystals disappeared.
An advantage of DECT is its ability to distinguish deposits of calcium hydroxyapatite from calcium pyrophosphate. Although calcium hydroxyapatite deposits are commonly found along the tendons, this characteristic is not absolute for the differential diagnosis. Calcium salts are radiographically defined as chondrocalcinosis, which also makes determining the chemical composition of the deposits difficult. Density values in multislice CT cannot be used as an unambiguous recommendation.
With DECT, a spectral analysis of calcium hydroxyapatite and calcium pyrophosphate deposits can be performed using the values of the dual-energy index and effective atomic number (Zeff), which are the result of the mathematical processing of DECT findings. These parameters help in distinguishing the two types of crystals [65]. Although the dual-energy index and Zeff for the differential diagnosis of calcium salt deposits is not currently the standard practice, this avenue is promising and worth further investigation.
CONCLUSION
DECT is a promising method for diagnosing crystalline arthropathy and has several advantages over other research methods such as polarized light microscopy, ultrasonography, X-ray, and CT. The advantages of DECT include its speed, absence of iatrogenic complications, qualitative and quantitative examination of materials, and dynamic monitoring. This radiation diagnostic technology solves numerous problems, including monitoring the efficacy of gout therapy and the potential of differential diagnosis of crystalline arthropathies.
Despite the drawbacks of this technique, there are methods that can aid in the correct interpretation of DECT results. DECT may simplify the confirmation of arthritis associated with the deposition of different types of crystals with atypical symptoms. However, questions remain regarding the early diagnosis of gout, possibility of accurate differentiation of calcium pyrophosphate from calcium hydroxyapatite crystals, and determining their volume, which necessitates additional research.
ADDITIONAL INFORMATION
Funding source. The work was conducted within the framework of the state assignment of the Lomonosov Moscow State University.
Competing interests. The authors declare that they have no competing interests.
Authors’ contribution. All authors made a substantial contribution to the conception of the work, acquisition, analysis, interpretation of data for the work, drafting and revising the work, final approval of the version to be published and agree to be accountable for all aspects of the work. M.V. Onoyko ― search for publications on the article topic, writing the text of the manuscript; E.A. Mershina ― expert evaluation of information, editing of the text of the manuscript, final version approval; O.A. Georginova ― expert evaluation of information, editing of the text of the manuscript, final version approval; M.L. Plotnikova ― editing of the text of the manuscript; A.V. Panyukova ― editing of the text of the manuscript; V.E. Sinitsin ― expert evaluation of information, final version approval.
About the authors
Maria V. Onoyko
Lomonosov Moscow State University
Email: onoykomary@gmail.com
ORCID iD: 0000-0002-7727-3360
Russian Federation, Moscow
Elena A. Mershina
Lomonosov Moscow State University
Email: elena_mershina@mail.ru
ORCID iD: 0000-0002-1266-4926
SPIN-code: 6897-9641
MD, Cand. Sci. (Med), Associate Professor
Russian Federation, MoscowOlga A. Georginova
Lomonosov Moscow State University
Email: olga.georginova@gmail.com
ORCID iD: 0000-0002-7542-8189
SPIN-code: 8331-3656
MD, Cand. Sci. (Med), Assistant Professor
Russian Federation, MoscowMaria L. Plotnikova
Lomonosov Moscow State University
Email: maria_plotnikova@inbox.ru
ORCID iD: 0000-0001-7533-9867
Russian Federation, Moscow
Alexandra V. Panyukova
Lomonosov Moscow State University
Email: panyukovaalexandra@gmail.com
ORCID iD: 0000-0002-5367-280X
Russian Federation, Moscow
Valentin E. Sinitsyn
Lomonosov Moscow State University
Author for correspondence.
Email: vsini@mail.ru
ORCID iD: 0000-0002-5649-2193
SPIN-code: 8449-6590
MD, Dr. Sci. (Med), Professor
Russian Federation, MoscowReferences
- Neogi T, Jansen TL, Dalbeth N, et al. 2015 Gout classification criteria: An American college of rheumatology / European league against rheumatism collaborative initiative. Arthritis Rheumatol. 2015;67(10):2557–2568. doi: 10.1002/art.39254
- Taylor WJ, Fransen J, Dalbeth N, et al. Diagnostic arthrocentesis for suspicion of gout is safe and well tolerated. J Rheumatol. 2016;43(1):150–153. doi: 10.3899/jrheum.150684
- Sikilinda V, Alabut A. Protocols of technique of punctions of joints and treatment blocades in trauma and orthopedic diseases of support-moving apparatus. Chief Physician South Russia. 2018;2 (60):14–20. (In Russ).
- Stauder SK, Peloso PM. Dual-Energy computed tomography has additional prognostic value over clinical measures in gout including tophi: A systematic literature review. J Rheumatol. 2022;49(11):1256–1268. doi: 10.3899/jrheum.211246
- Federal Clinical Guidelines. Gout. All-Russian Public Organization Association of Rheumatologists of Russia; 2014. (In Russ).
- Dalbeth N, Phipps-Green A, Frampton C, et al. Relationship between serum urate concentration and clinically evident incident gout: An individual participant data analysis. Ann Rheum Dis. 2018;77(7):1048–1052. doi: 10.1136/annrheumdis-2017-212288
- Pereverzev AP, Ostroumova OD. Drug-induced hyperuricemia/gout. Part I: Prevalence, pathophysiology, risk factors, clinical pattern. Therapy. 2021;7(6):136–145. (In Russ). doi: 10.18565/therapy.2021.7.159-169
- Chhana A, Lee G, Dalbeth N. Factors influencing the crystallization of monosodium urate: A systematic literature review. BMC Musculoskelet Disord. 2015;16(1):1–11. doi: 10.1186/s12891-015-0762-4
- Fiddis RW, Vlachos N, Calvert PD. Studies of urate crystallisation in relation to gout. Ann Rheum Dis. 1983;42(Suppl 1):12. doi: 10.1136/ard.42.suppl_1.12
- Dalbeth N, Pool B, Gamble GD, et al. Cellular characterization of the gouty tophus: A quantitative analysis. Arthritis Rheum. 2010;62(5):1549–1556. doi: 10.1002/art.27356
- Butler F, Alghubayshi A, Roman Y. The epidemiology and genetics of hyperuricemia and gout across major racial groups: A literature review and population genetics secondary database analysis. J Personalized Med. 2021;11(3):231. doi: 10.3390/jpm11030231
- Meneses-Leon J, Denova-Gutiérrez E, Castañón-Robles S, et al. Sweetened beverage consumption and the risk of hyperuricemia in Mexican adults: A cross-sectional study. BMC Public Health. 2014;14(1):1–11. doi: 10.1186/1471-2458-14-445
- Bae J, Chun BY, Park PS, et al. Higher consumption of sugar-sweetened soft drinks increases the risk of hyperuricemia in Korean population: The Korean multi-rural communities cohort study. Semin Arthritis Rheum. 2014;43(5):654–661. doi: 10.1016/j.semarthrit.2013.10.008
- Zhang W, Doherty M, Pascual E, et al. EULAR evidence based recommendations for gout. Part I: Diagnosis. Report of a task force of the standing committee for international clinical studies including therapeutics (ESCISIT). Ann Rheum Dis. 2006;65(10):1301–1311. doi: 10.1136/ard.2006.055251
- Kienhorst LB, Janssens HJ, Eijgelaar RS, et al. The detection of monosodium urate crystals in synovial fluid after long-term and varying storage conditions. Joint Bone Spine. 2015;82(6):470–471. doi: 10.1016/j.jbspin.2014.10.020
- Secrets of rheumatology. Ed. by S.D. West. Trans. from English ed. by O.M. Lesnyak. Moscow: GEOTAR-Media; 2021. 756 p. (In Russ).
- Malik A, Schumacher HR, Dinnella JE, Clayburne GM. Clinical diagnostic criteria for gout: Comparsion with the gold standard of synovial fluid crystal analysis. J Clin Rheumatol. 2009;15(1):22–24. doi: 10.1097/RHU.0b013e3181945b79
- Pascal Z, Valcov R, Fabreguet I, et al. A prospective evaluation of ultrasound as a diagnostic tool in acute microcrystalline arthritis. Arthritis Res Ther. 2015;17(1):1–8. doi: 10.1186/s13075-015-0701-7
- Omoumi P, Becce F, Racine D, et al. Basic principles, technical approaches, and applications in musculoskeletal imaging (Part I). Semin Musculoskelet Radiol. 2015;19(5):431–437. doi: 10.1055/s-0035-1569253
- Ogdie A, Taylor WJ, Weatherall M, et al. Imaging modalities for the classification of gout: systematic literature review and meta-analysis. Ann Rheum Dis. 2015;74(10):1868–1874. doi: 10.1136/annrheumdis-2014-205431
- Sapsford M, Gamble GD, Aati O, et al. Relationship of bone erosion with the urate and soft tissue components of the tophus in gout: A dual energy computed tomography study. Rheumatology (Oxford). 2017;56(1):129–133. doi: 10.1093/rheumatology/kew383
- Towiwat P, Doyle AJ, Gamble GD, et al. Urate crystal deposition and bone erosion in gout: “Inside-out” or “outside-in”? A dual-energy computed tomography study. Arthritis Res Ther. 2016;18(1):208. doi: 10.1186/s13075-016-1105-z
- Bayat S, Aati O, Rech J, et al. Development of a dual-energy computed tomography scoring system for measurement of urate deposition in gout. Arthritis Care Res (Hoboken). 2016;68(6):769–775. doi: 10.1002/acr.22754
- Rajiah P, Sundaram M, Subhas N. Dual-energy CT in musculoskeletal imaging: What is the role beyond gout? AJR Am J Roentgenol. 2019;213(3):493–505. doi: 10.2214/AJR.19.21095
- Klimkova MM, Sinitsyn VE, Mazurenko DA, et al. Perspectives of dual-energy computed tomography in diagnostic of urinary stone disease for the determination of urinary calculi composition (review). Med Visualization. 2016;(6):84–92. (In Russ).
- McCollough CH, Leng S, Yu L, Fletcher JG. Dual- and multi-energy CT: Principles, technical approaches, and clinical applications. Radiology. 2015;276(3):637–653. doi: 10.1148/radiol.2015142631
- Sodickson AD, Keraliya A, Czakowski B, et al. Dual energy CT in clinical routine: How it works and how it adds value. Emerg Radiol. 2021;28(1):103–117. doi: 10.1007/s10140-020-01785-2
- Megibow AJ, Kambadakone A, Ananthakrishnan L. Dual-energy computed tomography: Image acquisition, processing, and workflow. Radiol Clin North Am. 2018;56(4):507–520. doi: 10.1016/j.rcl.2018.03.001
- Forghani R, De Man B, Gupta R. Dual-energy computed tomography: Physical principles, approaches to scanning, usage, and implementation: Part 2. Neuroimaging Clin N Am. 2017;27(3):385–400. doi: 10.1016/j.nic.2017.03.002
- Henzler T, Fink C, Schoenberg SO, et al. Radiation dose aspects. AJR Am J Roentgenol. 2012;199(5 Suppl):S16–S25. doi: 10.2214/AJR.12.9210
- Borges AP, Antunes C, Curvo-Semedo L. Pros and cons of dual-energy CT systems: “One does not fit all”. Tomography. 2023;9(1):195–216. doi: 10.3390/tomography9010017
- Parakh A, Lennartz S, An C, et al. Dual-energy CT images: Pearls and pitfalls. Radiographics. 2021;41(1):98–119. doi: 10.1148/rg.2021200102
- Gosangi B, Mandell MC, Weaver MJ, et al. Bone marrow edema at dual-energy CT: A game changer in the emergency department. Radiographics. 2020;40(3):859–874. doi: 10.1148/rg.2020190173
- Goo HW, Goo JM. Dual-energy CT. New horizon in medical imaging. Korean J Radiol. 2017;18(4):555–569. doi: 10.3348/kjr.2017.18.4.555
- Baer AN, Kurano T, Thakur UJ, et al. Dual-energy computed tomography has limited sensitivity for non-tophaceous gout: A comparison study with tophaceous gout. BMC Musculoskelet Disord. 2016;17(1):1–9. doi: 10.1186/s12891-016-0943-9
- Bongartz T, Glazebrook KN, Kavros SJ, et al. Dual-energy CT for the diagnosis of gout: an accuracy and diagnostic yield study. Ann Rheum Dis. 2015;74(6):1072–1077. doi: 10.1136/annrheumdis-2013-205095
- Huppertz A, Hermann A, Diekhoff T, et al. Systemic staging for urate crystal deposits with dual-energy CT and ultrasound in patients with suspected gout. Rheumatol Int. 2014;(3):763–771. doi: 10.1007/s00296-014-2979-1
- Strobl S, Halpern EJ, Abd Ellah M, et al. Acute gouty knee arthritis: Ultrasound findings compared with dual-energy CT findings. AJR Am J Roentgenol. 2018;210(6):1323–1329. doi: 10.2214/AJR.17.19199
- Mallinson PI, Coupal T, Reisinger C, et al. Artifacts in dual-energy CT gout protocol: A review of 50 suspected cases with an artifact identification guide. AJR Am J Roentgenol. 2014;203(1):103–109. doi: 10.2214/AJR.13.11396
- Omoumi P, Zufferey P, Malghem J, So A. Imaging in gout and other crystal-related arthropathies. Rheum Dis Clin North Am. 2016;42(4):624–644. doi: 10.1016/j.rdc.2016.07.005
- Lee SM, Lee JG, Lee G, et al. CT Image conversion among different reconstruction kernels without a sinogram by using a convolutional neural network. Korean J Radiol. 2019;20(2):295–303. doi: 10.3348/kjr.2018.0249
- Alavandar E, Arunachalam VK, Narappulan N, et al. Principles and available hardware in DECT. J Gastrointestinal Abdominal Radiology. 2022;5(6). doi: 10.1055/s-0042-1742772
- Lee JS, Seo WJ. What is the diagnostic value of dual-energy computed tomography in patients with clinical diagnosis of gout? Adv Rheumatol. 2021;61(1):1–7. doi: 10.1186/s42358-021-00198-0
- Jia E, Zhu J, Huang W, et al. Dual-energy computed tomography has limited diagnostic sensitivity for short-term gout. Clin Rheumatol. 2018;37(3):773–777. doi: 10.1007/s10067-017-3753-z
- Ramon A, Ornetti P. Dual energy computed tomography: A breakthrough for gout? Joint Bone Spine. 2020;87(4):289–291. doi: 10.1016/j.jbspin.2019.12.002
- Shang J, Li XH, Lu SQ, et al. Gout of feet and ankles in different disease durations: Diagnostic value of single-source DECT and evaluation of urate deposition with a novel semi-quantitative DECT scoring system. Adv Rheumatol. 2021;61(1):1–14. doi: 10.1186/s42358-021-00194-4
- Wang P, Smith SE, Garg R, et al. Identification of monosodium urate crystal deposits in patients with asymptomatic hyperuricemia using dual-energy CT. RMD Open. 2018;4(1):593–597. doi: 10.1136/rmdopen-2017-000593
- Urano W, Yamanaka H, Tsutani H, et al. The inflammatory process in the mechanism of decreased serum uric acid concentrations during acute gouty arthritis. J Rheumatol. 2002;29(9):1950–1953.
- Dalbeth N, Nicolaou S, Baumgartner S, et al. Presence of monosodium urate crystal deposition by dual-energy CT in patients with gout treated with allopurinol. Ann Rheum Dis. 2018;77(3):364–370. doi: 10.1136/annrheumdis-2017-212046
- Zhang W, Doherty M, Bardin T, et al. European league against rheumatism recommendations for calcium pyrophosphate deposition. Part I: Terminology and diagnosis. Ann Rheum Dis. 2011;70(4):563–570. doi: 10.1136/ard.2010.139105
- Sabchyshyn V, Konon I, Ryan LM, Rosenthal AK. Concurrence of rheumatoid arthritis and calcium pyrophosphate deposition disease: A case collection and review of the literature. Semin Arthritis Rheum. 2018;48(1):9–11. doi: 10.1016/j.semarthrit.2017.11.009
- Williams CJ, Rosenthal AK. Pathogenesis of calcium pyrophosphate deposition disease. Best Pract Res Clin Rheumatol. 2021;35(4):101718. doi: 10.1016/j.berh.2021.101718
- Abhishek A. Calcium pyrophosphate deposition. Br J Hosp Med (Lond). 2014;75(4):61–64. doi: 10.12968/hmed.2014.75.sup4.c61
- Miksanek J, Rosenthal AK. Imaging of calcium pyrophosphate deposition disease. Curr Rheumatol Rep. 2015;17(3):20. doi: 10.1007/s11926-015-0496-1
- Godfrin-Valnet M, Godfrin G, Godard J, et al. Eighteen cases of crowned dens syndrome: Presentation and diagnosis. Neurochirurgie. 2013;59(3):115–120. doi: 10.1016/j.neuchi.2013.03.003
- Cipolletta E, Filippou G, Scirè CA, et al. The diagnostic value of conventional radiography and musculoskeletal ultrasonography in calcium pyrophosphate deposition disease: a systematic literature review and meta-analysis. Osteoarthr Cartil. 2021;29(5):619–632. doi: 10.1016/j.joca.2021.01.007
- Lee KA, Lee SH, Kim HR. Diagnostic value of ultrasound in calcium pyrophosphate deposition disease of the knee joint. Osteoarthr Cartil. 2019;27(5):781–787. doi: 10.1016/j.joca.2018.11.013
- Neame RL, Carr AJ, Muir K, Doherty M. UK community prevalence of knee chondrocalcinosis: Evidence that correlation with osteoarthritis is through a shared association with osteophyte. Ann Rheum Dis. 2003;62(6):513–518. doi: 10.1136/ard.62.6.513
- Frediani B, Filippou G, Falsetti P, et al. Diagnosis of calcium pyrophosphate dihydrate crystal deposition disease: Ultrasonographic criteria proposed. Ann Rheum Dis. 2005;64(4):638–640. doi: 10.1136/ard.2004.024109
- Tanikawa H, Ogawa R, Okuma K, et al. Detection of calcium pyrophosphate dihydrate crystals in knee meniscus by dual-energy computed tomography. J Orthop Surg Res. 2018;13(1):73. doi: 10.1186/s13018-018-0787-0
- Rosales-Alexander JL, Aznar JB, Magro-Checa C. Calcium pyrophosphate crystal deposition disease: Diagnosis and treatment. Open Access Rheumatol. 2014;(6):39–47. doi: 10.2147/OARRR.S39039
- Sekijima Y, Yoshida T, Ikeda SI. CPPD crystal deposition disease of the cervical spine: A common cause of acute neck pain encountered in the neurology department. J Neurol Sci. 2010;296(1–2):79–82. doi: 10.1016/j.jns.2010.05.028
- Kravchenko D, Karakostas P, Kuetting D, et al. The role of dual energy computed tomography in the differentiation of acute gout flares and acute calcium pyrophosphate crystal arthritis. Clin Rheumatol. 2022;41(1):223–233. doi: 10.1007/s10067-021-05949-4
- Tedeschi SK, Solomon DH, Yoshida K, et al. A prospective study of dual-energy CT scanning, US and X-ray in acute calcium pyrophosphate crystal arthritis. Rheumatology (Oxford). 2020;59(4):900–903. doi: 10.1093/rheumatology/kez431
- Pascart T, Norberciak L, Legrand J, et al. Dual-energy computed tomography in calcium pyrophosphate deposition: Initial clinical experience. Osteoarthr Cartil. 2019;27(9):1309–1314. doi: 10.1016/j.joca.2019.05.007
Supplementary files

